Leonid's Bitcoin Sharpe RatioThe Sharpe ratio is an old formula used to value the risk-adjusted return of an asset. It was developed by Nobel Laureate William F. Sharpe. In this case, I have applied it to Bitcoin with an adjustable look-back date.
The Sharpe Ratio shows you the average return earned after subtracting out the risk-free rate per unit of volatility (I've defaulted this to 0.02 ).
Volatility is a measure of the price fluctuations of an asset or portfolio. Subtracting the risk-free rate from the mean return allows you to understand what the extra returns are for taking the risk.
If the indicator is flashing red, Bitcoin is temporarily overbought (expensive).
If the indicator is flashing green, Bitcoin is temporarily oversold (cheap).
The goal of this indicator is to signal out local tops & bottoms. It can be adjusted as far as the lookback time but I have found 25-26 days to be ideal.
Portföy Yönetimi

Fx_Shepherd Lot Size Calculator [ALLDYN]This "Fx_Shepherd Lot Size Calculator" script is a basic yet essential tool designed for traders to calculate the appropriate lot size based on account balance, risk percentage, and stop-loss pips. It promotes disciplined risk management by ensuring that the user only risks a defined percentage of their account on each trade. The script also features a toggleable table that displays the account size, risk percentage, and calculated lot size, offering clear, real-time visualization for the user. This helps traders maintain consistency and avoid over-leveraging.
This "Fx_Shepherd Lot Size Calculator" script stands out as a unique utility for traders in several ways:
### 1. **Real-Time Lot Size Calculation**:
- The script provides an automatic, real-time calculation of the optimal lot size based on the account balance, risk percentage, and stop loss (SL) in pips. This offers traders immediate guidance on how much risk they are exposing their account to in each trade, streamlining risk management decisions.
### 2. **Dynamic Table Display**:
- The toggle-able table feature allows users to show or hide the lot size table on the chart. This makes the script non-intrusive for traders who may not want constant table overlays, providing more flexibility for chart space management.
### 3. **Customizable Inputs**:
- Inputs such as **balance**, **risk percentage**, and **stop loss** are easily configurable, allowing users to adjust the calculations to suit different trading strategies, account sizes, and risk tolerances.
- The `truncate()` function ensures the lot size is presented in a simple, rounded format, which is crucial for precise order placement and reduces the chance of errors.
### 4. **Responsive and Clean UI**:
- The table is color-coded for easy reading, with a sleek design that places key information — account size, risk percentage, and calculated lot size — in a clear, organized structure. The black background with white text for the data points improves readability, while the border and table cell colors (green and black) provide a professional look.
### 5. **Risk Management Focus**:
- The primary purpose of this script is to ensure that traders maintain consistent risk management by aligning their lot size with their defined risk per trade and stop loss distance. This automated approach to risk ensures that traders stay disciplined with risk exposure.
### 6. **Efficiency for All Trading Styles**:
- Whether a trader is scalping, day trading, or swing trading, this calculator adjusts dynamically, allowing it to be used across various timeframes and asset classes. It helps traders avoid manual calculations for each trade, thus improving efficiency and reducing human error.
### 7. **Non-Intrusive Clean-Up**:
- The feature to **clear** the table when not needed ensures the chart remains clean and decluttered when the table is hidden. This improves the user experience, especially for traders who switch between different strategies or charts.
Overall, this script combines simplicity and efficiency while being flexible enough to fit the needs of a broad spectrum of traders. Its focus on user customization, clean interface, and emphasis on risk management makes it a valuable tool for both novice and experienced traders.

Winning and Losing StreaksThe Pine Script indicator "Winning and Losing Streaks" tracks and visualizes the length of consecutive winning and losing streaks in a financial series, such as stock prices. Here’s a detailed description of the indicator, including the relevance of statistical analysis and streak tracking.
Indicator Description
The "Winning and Losing Streaks" indicator in Pine Script is designed to analyze and display streaks of consecutive winning and losing days in trading data. It helps traders and analysts understand the persistence of trends in price movements.
Here’s how it functions:
Streak Calculation:
Winning Streak: A series of consecutive days where the closing price is higher than the previous day's closing price.
Losing Streak: A series of consecutive days where the closing price is lower than the previous day's closing price.
Doji Candles: The indicator also considers Doji candles, where the difference between the opening and closing prices is minimal relative to the high-low range, and excludes these from being counted as winning or losing days.
Statistical Analysis:
The indicator computes the maximum and average lengths of winning and losing streaks.
It also tracks the current streak lengths and maintains arrays to store the historical streak data.
Visualization:
Histograms: Winning and losing streaks are visualized using histograms, which provide a clear graphical representation of streak lengths over time.
Relevance of Statistical Analysis and Streak Tracking
1. Statistical Significance of Streaks
Tracking winning and losing streaks has significant statistical implications for trading strategies and risk management:
Autocorrelation: Streaks in financial time series can reveal autocorrelation, where past returns influence future returns. Studies have shown that financial time series often exhibit autocorrelation, which can be used to forecast future price movements (Lo, 1991; Jegadeesh & Titman, 1993). Understanding streaks helps in identifying and leveraging these patterns.
Behavioral Finance: Streak analysis aligns with concepts from behavioral finance, such as the "hot-hand fallacy," where investors may perceive trends as more persistent than they are (Gilovich, Vallone, & Tversky, 1985). Statistical streak analysis provides a more objective view of trend persistence, helping to avoid biases.
2. Risk Management and Strategy Development
Risk Assessment: Identifying the length and frequency of losing streaks is crucial for managing risk and adjusting trading strategies. Long losing streaks can indicate potential strategy weaknesses or market regime changes, prompting a reassessment of trading rules and risk management practices (Brock, Lakonishok, & LeBaron, 1992).
Strategy Optimization: Statistical analysis of streaks can aid in optimizing trading strategies. For example, understanding the average length of winning and losing streaks can help in setting more effective stop-loss and take-profit levels, as well as in determining the optimal position sizing (Fama & French, 1993).
Scientific References:
Lo, A. W. (1991). "Long-Term Memory in Stock Market Prices." Econometrica, 59(5), 1279-1313. This paper discusses the presence of long-term memory in stock prices, which is relevant for understanding the persistence of streaks.
Jegadeesh, N., & Titman, S. (1993). "Returns to Buying Winners and Selling Losers: Implications for Stock Market Efficiency." Journal of Finance, 48(1), 65-91. This study explores momentum and reversal strategies, which are related to the concept of streaks.
Gilovich, T., Vallone, R., & Tversky, A. (1985). "The Hot Hand in Basketball: On the Misperception of Random Sequences." Cognitive Psychology, 17(3), 295-314. This paper provides insight into the psychological aspects of streaks and persistence.
Brock, W., Lakonishok, J., & LeBaron, B. (1992). "Simple Technical Trading Rules and the Stochastic Properties of Stock Returns." Journal of Finance, 47(5), 1731-1764. This research examines the effectiveness of technical trading rules, relevant for streak-based strategies.
Fama, E. F., & French, K. R. (1993). "Common Risk Factors in the Returns on Stocks and Bonds." Journal of Financial Economics, 33(1), 3-56. This paper provides a foundation for understanding risk factors and strategy performance.
By analyzing streaks, traders can gain valuable insights into market dynamics and refine their trading strategies based on empirical evidence.

Currency Futures StatisticsThe "Currency Futures Statistics" indicator provides comprehensive insights into the performance and characteristics of various currency futures. This indicator is crucial for portfolio management as it combines multiple metrics that are instrumental in evaluating currency futures' risk and return profiles.
Metrics Included:
Historical Volatility:
Definition: Historical volatility measures the standard deviation of returns over a specified period, scaled to an annual basis.
Importance: High volatility indicates greater price fluctuations, which translates to higher risk. Investors and portfolio managers use volatility to gauge the stability of a currency future and to make informed decisions about risk management and position sizing (Hull, J. C. (2017). Options, Futures, and Other Derivatives).
Open Interest:
Definition: Open interest represents the total number of outstanding futures contracts that are held by market participants.
Importance: High open interest often signifies liquidity in the market, meaning that entering and exiting positions is less likely to impact the price significantly. It also reflects market sentiment and the degree of participation in the futures market (Black, F., & Scholes, M. (1973). The Pricing of Options and Corporate Liabilities).
Year-over-Year (YoY) Performance:
Definition: YoY performance calculates the percentage change in the futures contract's price compared to the same week from the previous year.
Importance: This metric provides insight into the long-term trend and relative performance of a currency future. Positive YoY performance suggests strengthening trends, while negative values indicate weakening trends (Fama, E. F. (1991). Efficient Capital Markets: II).
200-Day Simple Moving Average (SMA) Position:
Definition: This metric indicates whether the current price of the currency future is above or below its 200-day simple moving average.
Importance: The 200-day SMA is a widely used trend indicator. If the price is above the SMA, it suggests a bullish trend, while being below indicates a bearish trend. This information is vital for trend-following strategies and can help in making buy or sell decisions (Bollinger, J. (2001). Bollinger on Bollinger Bands).
Why These Metrics are Important for Portfolio Management:
Risk Assessment: Historical volatility and open interest provide essential information for assessing the risk associated with currency futures. Understanding the volatility helps in estimating potential price swings, which is crucial for managing risk and setting appropriate stop-loss levels.
Liquidity and Market Participation: Open interest is a critical indicator of market liquidity. Higher open interest usually means tighter bid-ask spreads and better liquidity, which facilitates smoother trading and better execution of trades.
Trend Analysis: YoY performance and the SMA position help in analyzing long-term trends. This analysis is crucial for making strategic investment decisions and adjusting the portfolio based on changing market conditions.
Informed Decision-Making: Combining these metrics allows for a holistic view of the currency futures market. This comprehensive view helps in making informed decisions, balancing risks and returns, and optimizing the portfolio to align with investment goals.
In summary, the "Currency Futures Statistics" indicator equips investors and portfolio managers with valuable data points that are essential for effective risk management, liquidity assessment, trend analysis, and overall portfolio optimization.

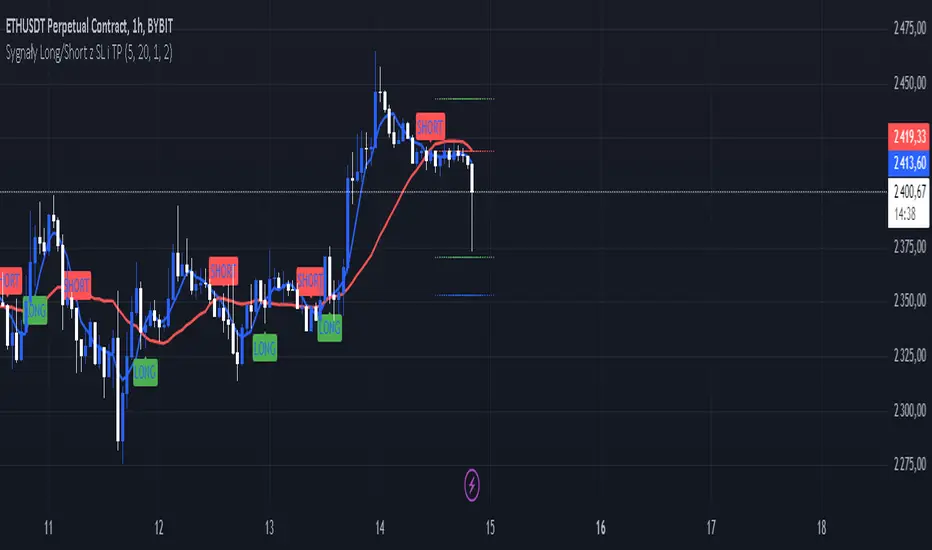
Sygnały Long/Short z SL i TPChoosing the Best Timeframe for Your Trading Strategy
The ideal timeframe for your trading strategy depends on several factors, including your trading style, risk preferences, and the goals of your strategy. Here’s a guide to different timeframes and their applications:
Timeframes and Their Uses:
Short-Term Timeframes (e.g., 5-minute, 15-minute):
Advantages: Provide more frequent signals and allow for quick responses to market changes. Ideal for day traders who prefer short, rapid trades.
Disadvantages: Can generate more false signals and be more susceptible to market noise. Requires more frequent attention and monitoring.
Medium-Term Timeframes (e.g., 1-hour, 4-hour):
Advantages: Offer fewer false signals compared to shorter timeframes. Suitable for swing traders looking to capture short-term trends.
Disadvantages: Fewer signals compared to shorter timeframes. Requires less frequent monitoring.
Long-Term Timeframes (e.g., daily, weekly):
Advantages: Provide more stable signals and are less affected by market noise. Ideal for long-term investors and those trading based on trends.
Disadvantages: Fewer signals, which may be less frequent but more reliable. Requires longer confirmation times.
Recommendation for Your Strategy:
For a strategy based on moving averages (MA) and generating long/short signals, the 5-minute and 15-minute timeframes might be suitable if:
You are a day trader and want to generate multiple signals per day.
You prefer quick responses to price changes and want to execute trades within a shorter timeframe.
For more stable signals and fewer false signals:
1-hour or 4-hour timeframes might be more appropriate.
Testing and Optimization:
Test Different Timeframes: See how your strategy performs on various timeframes to find the one that works best for you.
Adjust Parameters: Modify the lengths of the short and long SMAs, as well as the SL and TP levels, to fit the chosen timeframe.
How to Test:
Add the script to your chart on different timeframes on TradingView.
Observe the effectiveness and accuracy of the signals.
Adjust settings based on results and personal preferences.
Summary:
There isn’t a single “best” timeframe as it depends on your trading style and objectives. Start by testing on shorter timeframes if you are interested in day trading, and then explore how the strategy performs on longer timeframes for more stable signals.
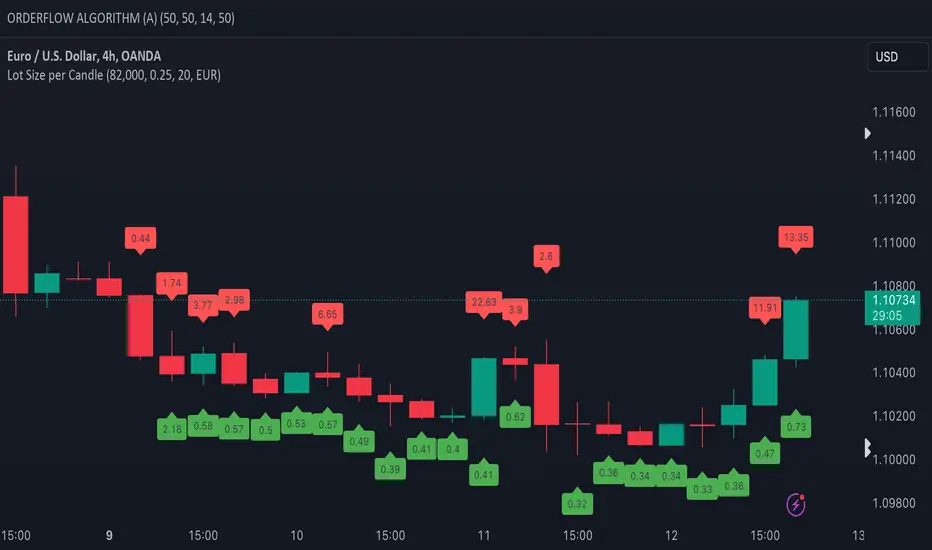
Lot Size per CandleThis script indicates the lotsize based on your accountsize and risk per trade.
You have the option to select account in EUR or USD. You can set account size and risk%.
Valid for next combination of currencies:
EUR
JPY
GBP
AUD
CHF
CAD
XAUUSD
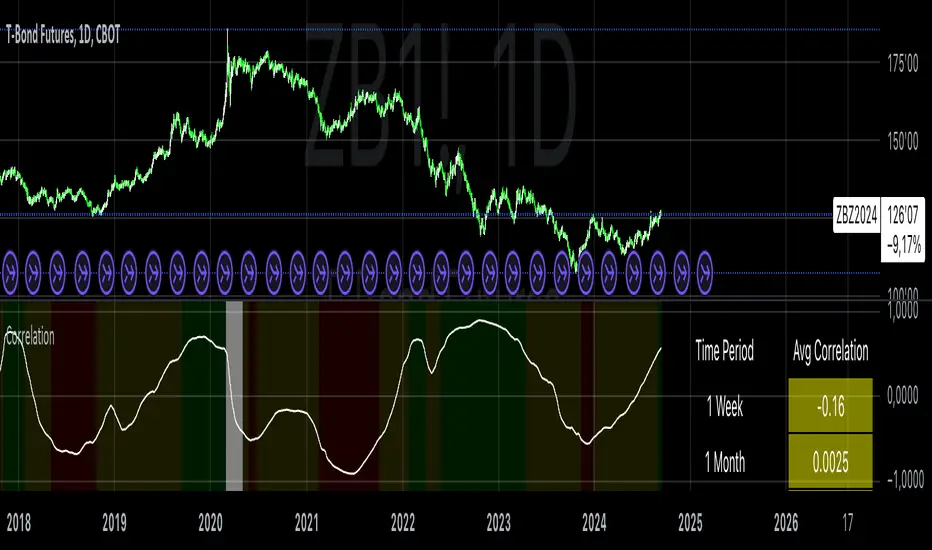
Correlation with AveragesThe "Correlation with Averages" indicator is designed to visualize and analyze the correlation between a selected asset's price and a base symbol's price, such as the S&P 500 (SPY). This indicator allows users to evaluate how closely an asset’s price movements align with those of the base symbol over various time periods, providing insights into market trends and potential portfolio adjustments.
Key Features:
Base Symbol and Correlation Period:
Users can specify the base symbol (default is SPY) and the period for correlation measurement (default is 252 trading days, approximating one year).
Correlation Calculation:
The indicator computes the correlation between the asset’s closing price and the base symbol’s closing price for the defined period.
Visualization:
The correlation value is plotted on the chart, with conditional background colors indicating the strength and direction of the correlation:
Red for negative correlation (below -0.5)
Green for positive correlation (above 0.5)
Yellow for neutral correlation (between -0.5 and 0.5)
Average Correlation Over Time:
Average correlations are calculated and displayed for various periods: one week, one month, one year, and five years.
A table on the chart provides dynamic updates of these average values with color-coded backgrounds to indicate correlation strength.
The Role of Correlation in Portfolio Management
Correlation is a crucial concept in portfolio management because it measures the degree to which two securities move in relation to each other. Understanding correlation helps investors construct diversified portfolios that balance risk and return. Here's why correlation is important:
Diversification:
By including assets with low or negative correlation in a portfolio, investors can reduce overall portfolio volatility and risk. For instance, if one asset is negatively correlated with another, when one performs poorly, the other may perform well, thus smoothing the overall returns.
Risk Management:
Correlation analysis helps in identifying the potential impact of one asset’s performance on the entire portfolio. Assets with high correlation can lead to concentrated risk, while those with low correlation offer better risk management.
Performance Analysis:
Correlation measures the degree to which asset returns move together. This can inform strategic decisions, such as whether to adjust positions based on expected market conditions.
Scientific References
Markowitz, H. M. (1952). "Portfolio Selection." Journal of Finance, 7(1), 77-91.
This foundational paper introduced Modern Portfolio Theory, highlighting the importance of diversification and correlation in reducing portfolio risk.
Jorion, P. (2007). Financial Risk Manager Handbook. Wiley.
This handbook provides an in-depth exploration of risk management techniques, including the use of correlation in portfolio management.
Elton, E. J., Gruber, M. J., Brown, S. J., & Goetzmann, W. N. (2014). Modern Portfolio Theory and Investment Analysis. Wiley.
This book elaborates on the concepts of correlation and diversification, offering practical insights into portfolio construction and risk management.
By utilizing the "Correlation with Averages" indicator, traders and portfolio managers can make informed decisions based on the relationship between asset prices and the base symbol, ultimately enhancing their investment strategies.
Risk TrackerThis Risk Tracker Pine Script provides traders with a customizable tool for tracking and managing trade risk directly on their chart. The script is designed to accommodate both futures and crypto trades, allowing you to monitor risk and reward parameters, adjust contract sizes, and manage leverage in real-time.
Key Features:
1. Trade Direction and Risk-Reward Ratio:
• Select between Long or Short trade directions.
• Set a custom Risk-Reward Ratio (RRR) to calculate potential profit and loss levels based on your trade setup.
2. Customizable Parameters:
• Input fields for contract size, leverage, margin, and maximum drawdown allow you to adjust the risk settings depending on the market you are trading.
• You can toggle between using a dollar-based or percentage-based risk calculation depending on whether you’re trading futures (USD-based) or crypto.
3. Real-time Stop-Loss and Take-Profit Calculation:
• The script automatically calculates and draws the Stop-Loss (SL) and Take-Profit (TP) levels on the chart based on your entry price and selected risk settings.
• The color of the SL and TP lines is customizable, allowing you to visually distinguish profit and loss levels.
4. Historical Price Levels:
• If there is no active trade, the script scans historical price data to find the last instances when the price hit the predefined stop-loss or take-profit levels, helping you understand past price behavior.
5. Risk Management Table:
• A summary table is displayed on the chart, showing the key metrics of your trade, including:
• Tick value and Dollar value for futures.
• Margin and Leverage for crypto.
• Risk-Reward Ratio, Entry price, Risk and Profit in USD or percentage terms.
• The table dynamically updates based on the current trade status.
6. Extended Chart Visualization:
• Option to extend the SL and TP lines to the left of the chart, allowing you to easily view these levels across multiple timeframes and bars.
This script helps ensure you are always aware of your trade’s risk profile, providing a clear and visual representation of potential profit and loss, both in terms of percentage and dollar value. Ideal for futures and crypto traders who rely on precise risk management to maintain profitability.

Investments Follower Table
🔸 Investments Follower Table is a useful tool to visualize the performance of your investments, regardless of which graph you are viewing.
🔸 By entering the name and the quantities of the stock you own, and your average purchase price, you can view the percentage changes and the profit/loss of your investments, regardless of the graph you’re viewing.
🔸 This indicator allows you to follow 4 stocks at the same time.
🔸 When you first open the indicator, you won’t see the table until you’ll fill the fields necessary to show the data.
🔸 Explanation of the menu:
- % TABLE toggle: Turns On and Off the table
- $ TABLE toggle: This function removes the column of the profit or loss in $. The percentage one will be kept.
- TICKER 1/2/3/4: It’s the part of the settings in which you put the name of the share you own.
- ONLY VALUES toggle: Reduces the table by removing the name of the ticker.
- REDUCED TABLE toggle: Removes all the rows of the table associated to the single investment, to just keep the summery of all the investments active
🔸If you turn off a toggle, but keeping some values inside the menu, the table will also consider that values in the calculation of the summery into the table. To avoid this, you just need to put in the A.P.P. and in the QTY the value “0”.
🔸If you want to reset the indicator, you just have to click “Defaults” in the bottom left corner, and then “Reset settings”.

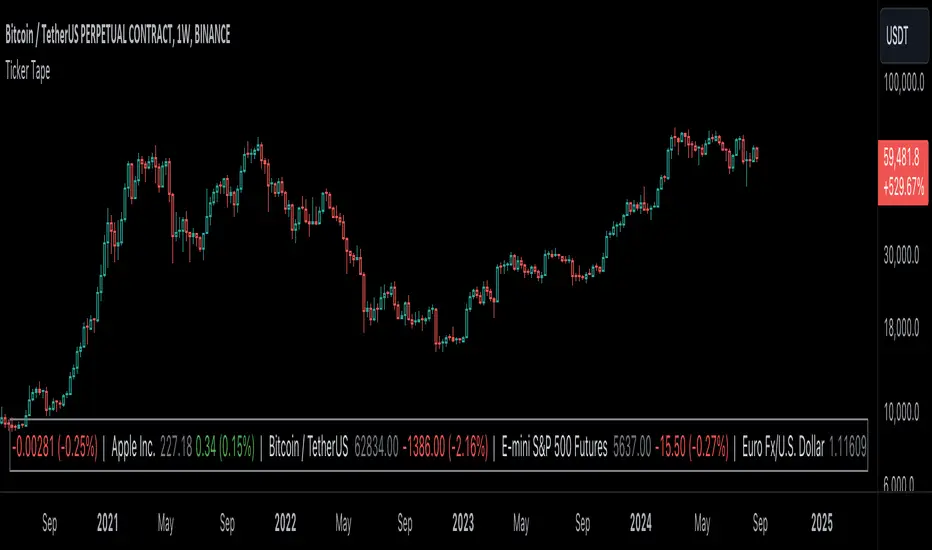
Ticker Tape█ OVERVIEW
This indicator creates a dynamic, scrolling display of multiple securities' latest prices and daily changes, similar to the ticker tapes on financial news channels and the Ticker Tape Widget . It shows realtime market information for a user-specified list of symbols along the bottom of the main chart pane.
█ CONCEPTS
Ticker tape
Traditionally, a ticker tape was a continuous, narrow strip of paper that displayed stock prices, trade volumes, and other financial and security information. Invented by Edward A. Calahan in 1867, ticker tapes were the earliest method for electronically transmitting live stock market data.
A machine known as a "stock ticker" received stock information via telegraph, printing abbreviated company names, transaction prices, and other information in a linear sequence on the paper as new data came in. The term "ticker" in the name comes from the "tick" sound the machine made as it printed stock information. The printed tape provided a running record of trading activity, allowing market participants to stay informed on recent market conditions without needing to be on the exchange floor.
In modern times, electronic displays have replaced physical ticker tapes. However, the term "ticker" remains persistent in today's financial lexicon. Nowadays, ticker symbols and digital tickers appear on financial news networks, trading platforms, and brokerage/exchange websites, offering live updates on market information. Modern electronic displays, thankfully, do not rely on telegraph updates to operate.
█ FEATURES
Requesting a list of securities
The "Symbol list" text box in the indicator's "Settings/Inputs" tab allows users to list up to 40 symbols or ticker Identifiers. The indicator dynamically requests and displays information for each one. To add symbols to the list, enter their names separated by commas . For example: "BITSTAMP:BTCUSD, TSLA, MSFT".
Each item in the comma-separated list must represent a valid symbol or ticker ID. If the list includes an invalid symbol, the script will raise a runtime error.
To specify a broker/exchange for a symbol, include its name as a prefix with a colon in the "EXCHANGE:SYMBOL" format. If a symbol in the list does not specify an exchange prefix, the indicator selects the most commonly used exchange when requesting the data.
Realtime updates
This indicator requests symbol descriptions, current market prices, daily price changes, and daily change percentages for each ticker from the user-specified list of symbols or ticker identifiers. It receives updated information for each security after new realtime ticks on the current chart.
After a new realtime price update, the indicator updates the values shown in the tape display and their colors.
The color of the percentages in the tape depends on the change in price from the previous day . The text is green when the daily change is positive, red when the value is negative, and gray when the value is 0.
The color of each displayed price depends on the change in value from the last recorded update, not the change over a daily period. For example, if a security's price increases in the latest update, the ticker tape shows that price with green text, even if the current price is below the previous day's closing price. This behavior allows users to monitor realtime directional changes in the requested securities.
NOTE: Pine scripts execute on realtime bars when new ticks are available in the chart's data feed. If no new updates are available from the chart's realtime feed, it may cause a delay in the data the indicator receives.
Ticker motion
This indicator's tape display shows a list of security information that incrementally scrolls horizontally from right to left after new chart updates, providing a dynamic visual stream of current market data. The scrolling effect works by using a counter that increments across successive intervals after realtime ticks to control the offset of each listed security. Users can set the initial scroll offset with the "Offset" input in the "Settings/Inputs" tab.
The scrolling rate of the ticker tape display depends on the realtime ticks available from the chart's data feed. Using the indicator on a chart with frequent realtime updates results in smoother scrolling. If no new realtime ticks are available in the chart's feed, the ticker tape does not move. Users can also deactivate the scrolling feature by toggling the "Running" input in the indicator's settings.
█ FOR Pine Script™ CODERS
• This script utilizes dynamic requests to iteratively fetch information from multiple contexts using a single request.security() instance in the code. Previously, `request.*()` functions were not allowed within the local scopes of loops or conditional structures, and most `request.*()` function parameters, excluding `expression`, required arguments of a simple or weaker qualified type. The new `dynamic_requests` parameter in script declaration statements enables more flexibility in how scripts can use `request.*()` calls. When its value is `true`, all `request.*()` functions can accept series arguments for the parameters that define their requested contexts, and `request.*()` functions can execute within local scopes. See the Dynamic requests section of the Pine Script™ User Manual to learn more.
• Scripts can execute up to 40 unique `request.*()` function calls. A `request.*()` call is unique only if the script does not already call the same function with the same arguments. See this section of the User Manual's Limitations page for more information.
• This script converts a comma-separated "string" list of symbols or ticker IDs into an array . It then loops through this array, dynamically requesting data from each symbol's context and storing the results within a collection of custom `Tape` objects . Each `Tape` instance holds information about a symbol, which the script uses to populate the table that displays the ticker tape.
• This script uses the varip keyword to declare variables and `Tape` fields that update across ticks on unconfirmed bars without rolling back. This behavior allows the script to color the tape's text based on the latest price movements and change the locations of the table cells after realtime updates without reverting. See the `varip` section of the User Manual to learn more about using this keyword.
• Typically, when requesting higher-timeframe data with request.security() using barmerge.lookahead_on as the `lookahead` argument, the `expression` argument should use the history-referencing operator to offset the series, preventing lookahead bias on historical bars. However, the request.security() call in this script uses barmerge.lookahead_on without offsetting the `expression` because the script only displays results for the latest historical bar and all realtime bars, where there is no future information to leak into the past. Instead, using this call on those bars ensures each request fetches the most recent data available from each context.
• The request.security() instance in this script includes a `calc_bars_count` argument to specify that each request retrieves only a minimal number of bars from the end of each symbol's historical data feed. The script does not need to request all the historical data for each symbol because it only shows results on the last chart bar that do not depend on the entire time series. In this case, reducing the retrieved bars in each request helps minimize resource usage without impacting the calculated results.
Look first. Then leap.
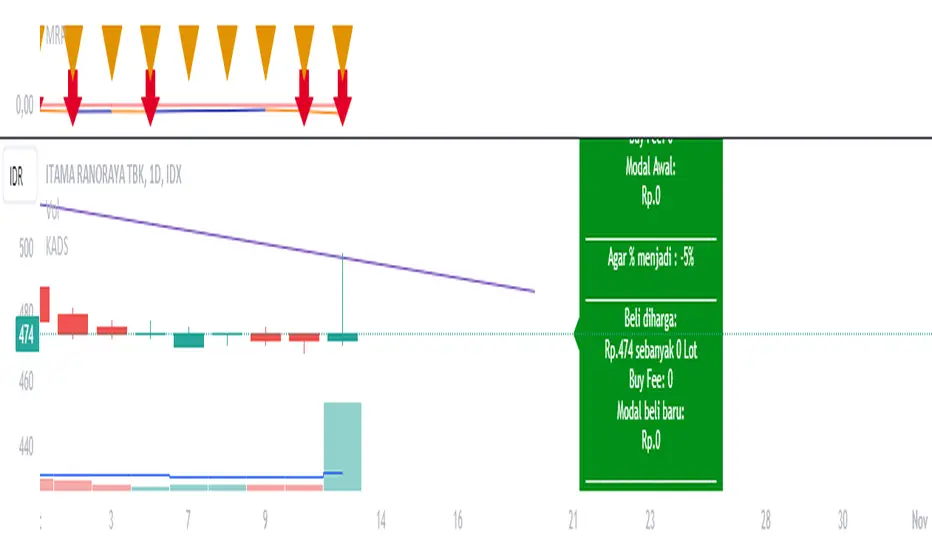
Average Down CalculatorAverage Down Calculator is an indicator for investors looking to manage their portfolio. It aids in calculating the average share price, providing insights into optimizing investment strategies. Averaging down is a strategy investors use when the price of a security they own goes down. Instead of selling at a loss, they buy more shares at the lower price to reduce the average cost per share.
There are situations where a stock's price moves contrary to your expectations. The market moves downward. Despite this, your faith in the stock persists. This indicator allowing you to strategically add more stocks to lower the average price. But You must remember, it’s not without risks, as it involves investing more money in a losing position.
This Indicator allowing you to quickly understand your new position and make informed decisions. It’s designed for easy use, regardless of your experience level with investing.
Steps to use it:
1.put buy fee from your securitas
2.next put the price of the emiten from your portofolio
3.and how many lot you have
4.next is the the taget of percentage you want it become.
5 the last you can choose, the price that you want to buy for average.
this calculator is designed to help you navigate your investment better, choose it wisely.Be aware of the risks of investing more in a declining asset and consider diversification to manage potential losses.
Time Zone Box & Alerts (Simplified)### Description
This Pine Script indicator is designed for TradingView and provides functionality for drawing time-based boxes on the chart, as well as generating alerts and labels. It is particularly useful for visualizing specific time ranges within each trading day and managing alerts based on those time intervals.
#### **Features:**
1. **Box Drawing for Specific Time Ranges**:
- **Time Interval Customization**: Allows users to specify the start and end times for the box using inputs (e.g., from 9:30 AM to 12:30 PM). The box will automatically adjust based on these times.
- **Historical Data**: The script calculates the high and low prices within the specified time range and draws a box accordingly. This box will be created for each trading day, capturing all relevant historical data within the defined time interval.
2. **Dynamic Alerts**:
- **Custom Alerts**: Users can define custom alert messages for specific times within the trading day (e.g., before and after the trading range). Alerts are triggered once per bar close at the specified times.
3. **Labels for Key Time Points**:
- **Customizable Labels**: Labels can be added at specific times to indicate important trading actions (e.g., "No Trade," "Open Trade," and "Close Trade"). The text, color, and size of these labels are customizable.
- **Label Display**: Labels appear on the chart at defined times to provide visual cues for trading decisions.
4. **Visual Customization**:
- **Box and Label Colors**: Users can choose colors for the box and labels to match their preferences or trading setup.
- **Box Transparency**: The box can be customized with varying levels of transparency to enhance chart visibility.
#### **Usage:**
1. **Set Up Time Intervals**: Define the start and end times for the box using the input fields. Adjust these settings to fit your trading strategy and time zones.
2. **Adjust Alerts and Labels**: Customize the alert messages and label text to fit your trading plan.
3. **Apply to Chart**: Add the script to your TradingView chart to visualize the time-based boxes, receive alerts, and see the labels.
This script helps traders visually identify significant time ranges within the trading day and receive timely alerts and labels, enhancing their decision-making process.

SP500 RatiosThe "SP500 Ratios" indicator is a powerful tool developed for the TradingView platform, allowing users to access a variety of financial ratios and inflation-adjusted data related to the S&P 500 index. This indicator integrates with Nasdaq Data Link (formerly known as Quandl) to retrieve historical data, providing a comprehensive overview of key financial metrics associated with the S&P 500.
Key Features
Price to Sales Ratio: Quarterly ratio of price to sales (revenue) for the S&P 500.
Dividend Yield: Monthly dividend yield based on 12-month dividend per share.
Price Earnings Ratio (PE Ratio): Monthly price-to-earnings ratio based on trailing twelve-month reported earnings.
CAPE Ratio (Shiller PE Ratio): Monthly cyclically adjusted PE ratio, based on average inflation-adjusted earnings over the past ten years.
Earnings Yield: Monthly earnings yield, the inverse of the PE ratio.
Price to Book Ratio: Quarterly ratio of price to book value.
Inflation Adjusted S&P 500: Monthly S&P 500 level adjusted for inflation.
Revenue Per Share: Quarterly trailing twelve-month sales per share, not adjusted for inflation.
Earnings Per Share: Monthly real earnings per share, adjusted for inflation.
User Configuration
The indicator offers flexibility through user-configurable options. You can choose to display or hide each metric according to your analysis needs. Users can also adjust the line width for better visibility on the chart.
Visualization
The selected data is plotted on the chart with distinct colors for each metric, facilitating visual analysis. A dynamic legend table is also generated in the top-right corner of the chart, listing the currently displayed metrics with their associated colors.
This indicator is ideal for traders and analysts seeking detailed insights into the financial performance and valuations of the S&P 500, while benefiting from the customization flexibility offered by TradingView.

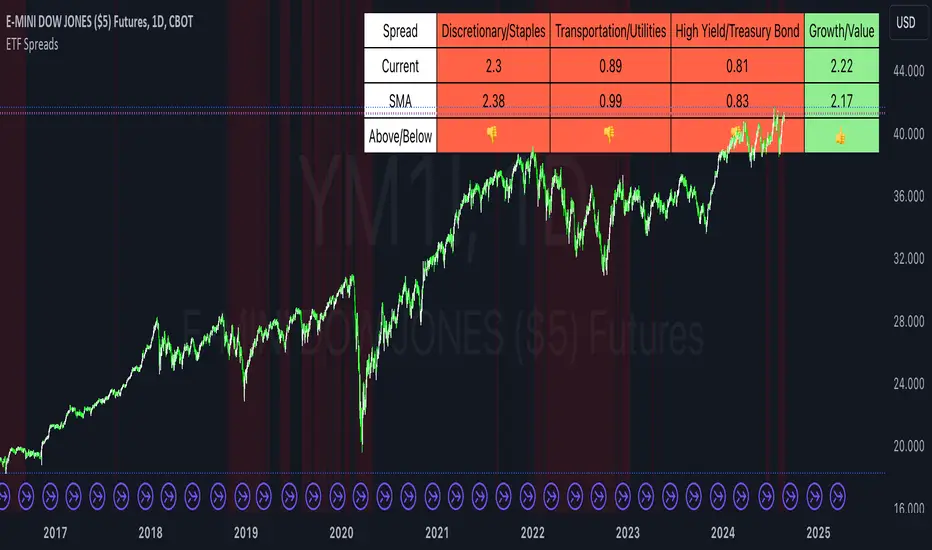
ETF SpreadsThis script provides a visual representation of various financial spreads along with their Simple Moving Averages (SMA) in a table format overlayed on the chart. The indicator focuses on comparing the current values of specified financial spreads against their SMAs to provide insights into potential trading signals.
Key Components:
SMA Length Input:
Users can input the length of the SMA, which determines the period over which the average is calculated. The default length is set to 20 days.
Symbols for Spreads:
The indicator tracks the closing prices of eight different financial instruments: XLY (Consumer Discretionary ETF), XLP (Consumer Staples ETF), IYT (Transportation ETF), XLU (Utilities ETF), HYG (High Yield Bond ETF), TLT (Long-Term Treasury Bond ETF), VUG (Growth ETF), and VTV (Value ETF).
Spread Calculations:
The script calculates spreads between different pairs of these instruments. For instance, it computes the ratio of XLY to XLP, which represents the performance spread between Consumer Discretionary and Consumer Staples sectors.
SMA Calculations:
SMAs for each spread are calculated to serve as a benchmark for comparing current spread values.
Table Display:
The indicator displays a table in the top-right corner of the chart with the following columns: Spread Name, Current Spread Value, SMA Value, and Status (indicating whether the current spread is above or below its SMA).
Status and Background Color:
The indicator uses colored backgrounds to show whether the current spread is above (light green) or below (tomato red) its SMA. Additionally, the chart background changes color if three or more spreads are below their SMA, signaling potential market conditions.
Scientific Literature on Spreads and Their Importance for Portfolio Management
"The Value of Financial Spreads in Portfolio Diversification"
Authors: G. Gregoriou, A. Z. P. G. Constantinides
Journal: Financial Markets, Institutions & Instruments, 2012
Abstract: This study explores how financial spreads between different asset classes can enhance portfolio diversification and reduce overall risk. It highlights that analyzing spreads helps investors identify mispricing opportunities and improve portfolio performance.
"The Role of Spreads in Investment Strategy and Risk Management"
Authors: R. J. Hodrick, E. S. S. Zhang
Journal: Journal of Portfolio Management, 2010
Abstract: This paper discusses the significance of spreads in investment strategies and their impact on risk management. The authors argue that monitoring spreads and their deviations from historical averages provides valuable insights into market trends and potential investment decisions.
"Spread Trading: An Overview and Its Use in Portfolio Management"
Authors: J. M. M. Perkins, L. A. B. Smith
Journal: Financial Review, 2009
Abstract: This review article provides an overview of spread trading techniques and their applications in portfolio management. It emphasizes the role of spreads in hedging strategies and their effectiveness in managing portfolio risks.
"Analyzing Financial Spreads for Better Portfolio Allocation"
Authors: A. S. Dechow, J. E. Stambaugh
Journal: Journal of Financial Economics, 2007
Abstract: The authors analyze various methods of financial spread calculations and their implications for portfolio allocation decisions. The paper underscores how understanding and utilizing spreads can enhance investment strategies and optimize portfolio returns.
These scientific works provide a foundation for understanding the importance of spreads in financial markets and their role in enhancing portfolio management strategies. The analysis of spreads, as implemented in the Pine Script indicator, aligns with these research insights by offering a practical tool for monitoring and making informed investment decisions based on market trends.
Qty CalculatorThis Pine Script indicator, titled "Qty Calculator," is a customizable tool designed to assist traders in managing their trades by calculating key metrics related to risk management. It takes into account your total capital, entry price, stop-loss level, and desired risk percentage to provide a comprehensive overview of potential trade outcomes.
Key Features:
User Inputs:
Total Capital: The total amount of money available for trading.
Entry Price: The price at which the trader enters the trade.
Stop Loss: The price level at which the trade will automatically close to prevent further losses.
Risk Percentage: The percentage of the total capital that the trader is willing to risk on a single trade.
Customizable Table:
Position: The indicator allows you to choose the position of the table on the chart, with options including top-left, top-center, top-right, bottom-left, bottom-center, and bottom-right.
Size: You can adjust the number of rows and columns in the table to fit your needs.
Risk Management Calculations:
Difference Calculation: The difference between the entry price and the stop-loss level.
Risk Per Trade: Calculated as a percentage of your total capital.
Risk Levels: The indicator evaluates multiple risk levels (0.10%, 0.25%, 0.50%, 1.00%) and calculates the quantity, capital per trade, percentage of total capital, and the risk amount associated with each level.
R-Multiples Calculation:
The indicator calculates potential profit levels at 2x, 3x, 4x, and 5x the risk (R-Multiples), showing the potential gains if the trade moves in your favor by these multiples.
Table Display:
The table includes the following columns:
CapRisk%: Displays the risk percentage.
Qty: The quantity of the asset you should trade.
Cap/Trade: The capital allocated per trade.
%OfCapital: The percentage of total capital used in the trade.
Risk Amount: The monetary risk taken on each trade.
R Gains: Displays potential gains at different R-Multiples.
This indicator is particularly useful for traders who prioritize risk management and want to ensure that their trades are aligned with their capital and risk tolerance. By providing a clear and customizable table of critical metrics, it helps traders make informed decisions and better manage their trading strategies.

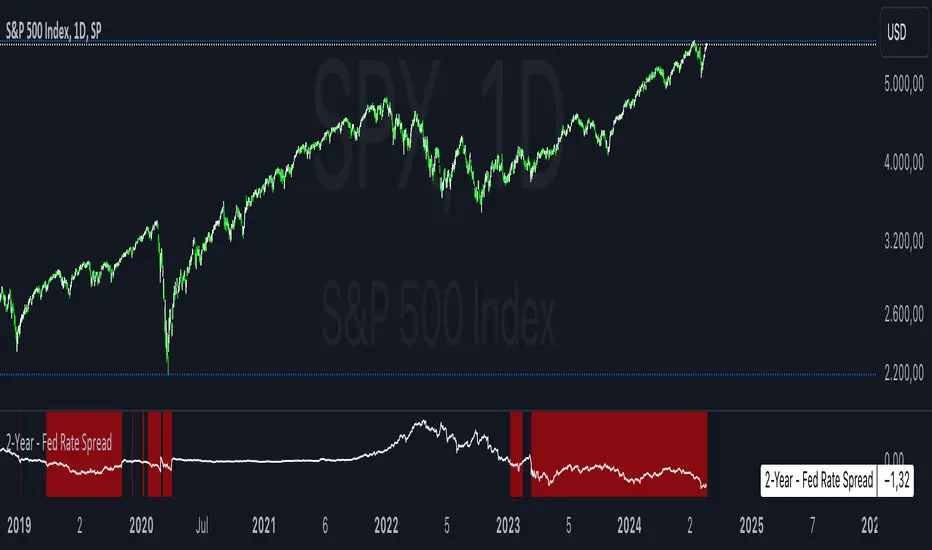
2-Year - Fed Rate SpreadThe “2-Year - Fed Rate Spread” is a financial indicator that measures the difference between the 2-Year Treasury Yield and the Federal Funds Rate (Fed Funds Rate). This spread is often used as a gauge of market sentiment regarding the future direction of interest rates and economic conditions.
Calculation
• 2-Year Treasury Yield: This is the return on investment, expressed as a percentage, on the U.S. government’s debt obligations that mature in two years.
• Federal Funds Rate: The interest rate at which depository institutions trade federal funds (balances held at Federal Reserve Banks) with each other overnight.
The indicator calculates the spread by subtracting the Fed Funds Rate from the 2-Year Treasury Yield:
{2-Year - Fed Rate Spread} = {2-Year Treasury Yield} - {Fed Funds Rate}
Interpretation:
• Positive Spread: A positive spread (2-Year Treasury Yield > Fed Funds Rate) typically suggests that the market expects the Fed to raise rates in the future, indicating confidence in economic growth.
• Negative Spread: A negative spread (2-Year Treasury Yield < Fed Funds Rate) can indicate market expectations of a rate cut, often signaling concerns about an economic slowdown or recession. When the spread turns negative, the indicator’s background turns red, making it visually easy to identify these periods.
How to Use:
• Trend Analysis: Investors and analysts can use this spread to assess the market’s expectations for future monetary policy. A persistent negative spread may suggest a cautious approach to equity investments, as it often precedes economic downturns.
• Confirmation Tool: The spread can be used alongside other economic indicators, such as the yield curve, to confirm signals about the direction of interest rates and economic activity.
Research and Academic References:
The 2-Year - Fed Rate Spread is part of a broader analysis of yield spreads and their implications for economic forecasting. Several academic studies have examined the predictive power of yield spreads, including those that involve the 2-Year Treasury Yield and Fed Funds Rate:
1. Estrella, Arturo, and Frederic S. Mishkin (1998). “Predicting U.S. Recessions: Financial Variables as Leading Indicators.” The Review of Economics and Statistics, 80(1): 45-61.
• This study explores the predictive power of various financial variables, including yield spreads, in forecasting U.S. recessions. The authors find that the yield spread is a robust leading indicator of economic downturns.
2. Estrella, Arturo, and Gikas A. Hardouvelis (1991). “The Term Structure as a Predictor of Real Economic Activity.” The Journal of Finance, 46(2): 555-576.
• The paper examines the relationship between the term structure of interest rates (including short-term spreads like the 2-Year - Fed Rate) and future economic activity. The study finds that yield spreads are significant predictors of future economic performance.
3. Rudebusch, Glenn D., and John C. Williams (2009). “Forecasting Recessions: The Puzzle of the Enduring Power of the Yield Curve.” Journal of Business & Economic Statistics, 27(4): 492-503.
• This research investigates why the yield curve, particularly spreads involving short-term rates like the 2-Year Treasury Yield, remains a powerful tool for forecasting recessions despite changes in monetary policy.
Conclusion:
The 2-Year - Fed Rate Spread is a valuable tool for market participants seeking to understand future interest rate movements and potential economic conditions. By monitoring the spread, especially when it turns negative, investors can gain insights into market sentiment and adjust their strategies accordingly. The academic research supports the use of such yield spreads as reliable indicators of future economic activity.
Weighted US Liquidity ROC Indicator with FED RatesThe Weighted US Liquidity ROC Indicator is a technical indicator that measures the Rate of Change (ROC) of a weighted liquidity index. This index aggregates multiple monetary and liquidity measures to provide a comprehensive view of liquidity in the economy. The ROC of the liquidity index indicates the relative change in this index over a specified period, helping to identify trend changes and market movements.
1. Liquidity Components:
The indicator incorporates various monetary and liquidity measures, including M1, M2, the monetary base, total reserves of depository institutions, money market funds, commercial paper, and repurchase agreements (repos). Each of these components is assigned a weight that reflects its relative importance to overall liquidity.
2. ROC Calculation:
The Rate of Change (ROC) of the weighted liquidity index is calculated by finding the difference between the current value of the index and its value from a previous period (ROC period), then dividing this difference by the value from the previous period. This gives the percentage increase or decrease in the index.
3. Visualization:
The ROC value is plotted as a histogram, with positive and negative changes indicated by different colors. The Federal Funds Rate is also plotted separately to show the impact of central bank policy on liquidity.
Discussion of the Relationship Between Liquidity and Stock Market Returns
The relationship between liquidity and stock market returns has been extensively studied in financial economics. Here are some key insights supported by scientific research:
Liquidity and Stock Returns:
Liquidity Premium Theory: One of the primary theories is the liquidity premium theory, which suggests that assets with higher liquidity typically offer lower returns because investors are willing to accept lower yields for more liquid assets. Conversely, assets with lower liquidity may offer higher returns to compensate for the increased risk associated with their illiquidity (Amihud & Mendelson, 1986).
Empirical Evidence: Research by Fama and French (1992) has shown that liquidity is an important factor in explaining stock returns. Their studies suggest that stocks with lower liquidity tend to have higher expected returns, aligning with the liquidity premium theory.
Market Impact of Liquidity Changes:
Liquidity Shocks: Changes in liquidity can impact stock returns significantly. For example, an increase in liquidity is often associated with higher stock prices, as it reduces the cost of trading and enhances market efficiency (Chordia, Roll, & Subrahmanyam, 2000). Conversely, a liquidity shock, such as a sudden decrease in market liquidity, can lead to higher volatility and lower stock prices.
Financial Crises: During financial crises, liquidity tends to dry up, leading to sharp declines in stock market returns. For instance, studies on the 2008 financial crisis illustrate how a reduction in market liquidity exacerbated the decline in stock prices (Brunnermeier & Pedersen, 2009).
Central Bank Policies and Liquidity:
Monetary Policy Impact: Central bank policies, such as changes in the Federal Funds Rate, directly influence market liquidity. Lower interest rates generally increase liquidity by making borrowing cheaper, which can lead to higher stock market returns. On the other hand, higher rates can reduce liquidity and negatively impact stock prices (Bernanke & Gertler, 1999).
Policy Expectations: The anticipation of changes in monetary policy can also affect stock market returns. For example, expectations of rate cuts can lead to a rise in stock prices even before the actual policy change occurs (Kuttner, 2001).
Key References:
Amihud, Y., & Mendelson, H. (1986). "Asset Pricing and the Bid-Ask Spread." Journal of Financial Economics, 17(2), 223-249.
Fama, E. F., & French, K. R. (1992). "The Cross-Section of Expected Stock Returns." Journal of Finance, 47(2), 427-465.
Chordia, T., Roll, R., & Subrahmanyam, A. (2000). "Market Liquidity and Trading Activity." Journal of Finance, 55(2), 265-289.
Brunnermeier, M. K., & Pedersen, L. H. (2009). "Market Liquidity and Funding Liquidity." Review of Financial Studies, 22(6), 2201-2238.
Bernanke, B. S., & Gertler, M. (1999). "Monetary Policy and Asset Prices." NBER Working Paper No. 7559.
Kuttner, K. N. (2001). "Monetary Policy Surprises and Interest Rates: Evidence from the Fed Funds Futures Market." Journal of Monetary Economics, 47(3), 523-544.
These studies collectively highlight how liquidity influences stock market returns and how changes in liquidity conditions, influenced by monetary policy and other factors, can significantly impact stock prices and market stability.

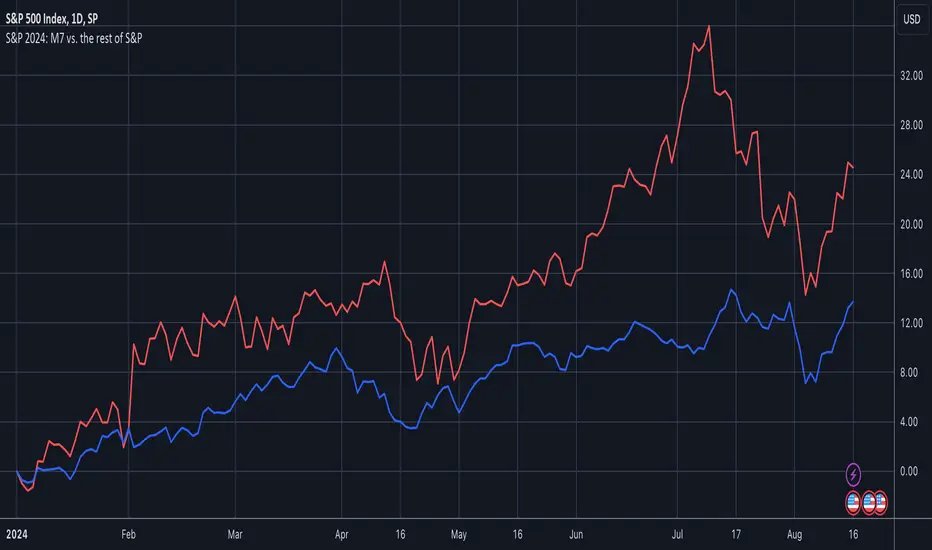
S&P 2024: Magnificent 7 vs. the rest of S&PThis chart is designed to calculate and display the percentage change of the Magnificent 7 (M7) stocks and the S&P 500 excluding the M7 (Ex-M7) from the beginning of 2024 to the most recent data point. The Magnificent 7 consists of seven major technology stocks: Apple (AAPL), Microsoft (MSFT), Amazon (AMZN), Alphabet (GOOGL), Meta (META), Nvidia (NVDA), and Tesla (TSLA). These stocks are a significant part of the S&P 500 and can have a substantial impact on its overall performance.
Key Components and Functionality:
1. Start of 2024 Baseline:
- The script identifies the closing prices of the S&P 500 and each of the Magnificent 7 stocks on the first trading day of 2024. These values serve as the baseline for calculating percentage changes.
2. Current Value Calculation:
- It then fetches the most recent closing prices of these stocks and the S&P 500 index to calculate their current values.
3. Percentage Change Calculation:
- The script calculates the percentage change for the M7 by comparing the sum of the current prices of the M7 stocks to their combined value at the start of 2024.
- Similarly, it calculates the percentage change for the Ex-M7 by comparing the current value of the S&P 500 excluding the M7 to its value at the start of 2024.
4. Plotting:
- The calculated percentage changes are plotted on the chart, with the M7’s percentage change shown in red and the Ex-M7’s percentage change shown in blue.
Use Case:
This indicator is particularly useful for investors and analysts who want to understand how much the performance of the S&P 500 in 2024 is driven by the Magnificent 7 stocks compared to the rest of the index. By showing the percentage change from the start of the year, it provides clear insights into the relative growth or decline of these two segments of the market over the course of the year.
Visualization:
- Red Line (M7 % Change): Displays the percentage change of the combined value of the Magnificent 7 stocks since the start of 2024.
- Blue Line (Ex-M7 % Change): Displays the percentage change of the S&P 500 excluding the Magnificent 7 since the start of 2024.
This script enables a straightforward comparison of the performance of the M7 and Ex-M7, highlighting which segment is contributing more to the overall movement of the S&P 500 in 2024.
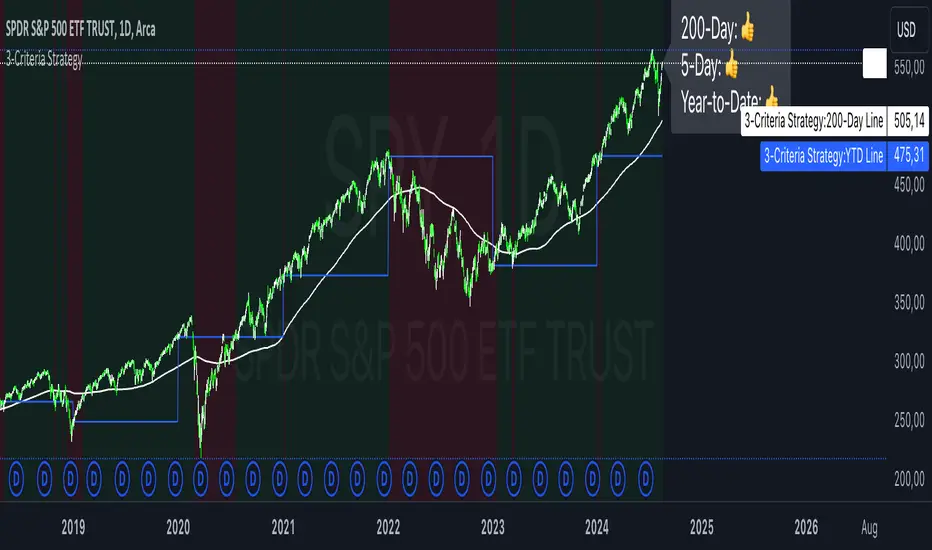
3-Criteria StrategyThe "3-Criteria Strategy" is a simple yet effective trading strategy based on three criteria:
200-Day Moving Average: The first criterion checks whether the current price is above or below the 200-day moving average (SMA). A price above the 200-day line is considered bullish (thumbs up), while a price below is considered bearish (thumbs down).
5-Day Indicator: The second criterion evaluates the performance of the first five trading days of the year. If the closing price on the fifth trading day is higher than the closing price on the last trading day of the previous year, this is considered bullish (thumbs up). Otherwise, it's bearish (thumbs down).
Year-to-Date (YTD) Effect: The third criterion compares the current price with the closing price at the end of the previous year. A current price above the year-end price is bullish (thumbs up), while a price below is bearish (thumbs down).
Signal Interpretation:
Buy Signal: At least two of the three criteria must give a bullish signal (thumbs up).
Sell Signal: Zero or one bullish signal results in a bearish outlook.
The script provides visual cues with background colors:
Green background: Indicates a buy signal.
Red background: Indicates a sell signal.
Additionally, the script plots the 200-day moving average and the YTD line on the chart for better visualization.
Usage:
Apply the Script: Add the script to your TradingView chart.
Interpret Signals: Monitor the background color and the status label to determine trading actions.
Visual Aids: Use the 200-day line and YTD line plotted on the chart to confirm the criteria visually.
Scientific Research
The concepts used in this script—like the 200-day moving average and Year-to-Date effects—are well-documented in financial literature. However, the combination of these specific criteria as a trading strategy is more of a heuristic approach commonly used by traders rather than a subject of extensive academic research.
200-Day Moving Average: The 200-day moving average is widely regarded as a significant level in technical analysis, often serving as a demarcation between long-term bullish and bearish trends. Research has shown that long-term moving averages can be useful for trend-following strategies.
Reference: Brock, W., Lakonishok, J., & LeBaron, B. (1992). Simple Technical Trading Rules and the Stochastic Properties of Stock Returns. Journal of Finance, 47(5), 1731-1764.
Year-to-Date and Calendar Effects: The Year-to-Date effect and early-year performance (such as the January effect) have been studied extensively in the context of seasonal market anomalies.
Reference: Rozeff, M. S., & Kinney, W. R. (1976). Capital Market Seasonality: The Case of Stock Returns. Journal of Financial Economics, 3(4), 379-402.
While these papers don't address the exact combination of criteria used in your strategy, they provide a solid foundation for understanding the underlying concepts.
Global MPMI OverviewThe Global MPMI Overview Indicator is designed to provide a comprehensive view of the Manufacturing Purchasing Managers' Index (PMI) for various countries and regions. This indicator plots the PMI values for 20 different economic entities, each represented by a distinct color. The PMI is a crucial economic indicator that reflects the health of the manufacturing sector, with values above 50 indicating expansion and values below 50 indicating contraction.
Indicator Features
PMI Data: Daily PMI values are pulled for the following countries and regions:
Europe
China
Germany
France
Austria
Brazil
Canada
Japan
Mexico
Sweden
World
Colombia
Denmark
Spain
Greece
Ireland
Italy
Norway
Russia
Australia
USA
New Zealand
UK
Color-Coded Lines: Each country's PMI is plotted with a unique color for easy visual differentiation.
Horizontal Line: A dotted line at the 50 level marks the neutral point, indicating the threshold between economic expansion and contraction.
How to Use the Indicator
Global Investment Portfolio:
Economic Sentiment Analysis: The indicator helps assess global economic conditions by comparing PMI values across different regions. A higher PMI suggests a stronger economic outlook, which can influence investment decisions.
Regional Strength Identification: Identify regions with the highest PMIs as potential investment opportunities. Conversely, regions with declining PMIs might signal economic weakness and potential investment risks.
Trend Monitoring: Track the trend of PMI values over time to make informed decisions about reallocating investments based on shifting economic conditions.
Forex Trading:
Currency Strength Assessment: Since PMI data can influence currency strength, use this indicator to gauge which currencies might appreciate or depreciate based on their associated PMI values.
Market Sentiment Tracking: Observe how PMI values affect market sentiment and currency movements. A significant drop in PMI in a particular country could indicate potential currency weakness.
Economic Forecasting: Use trends in PMI data to forecast economic shifts that could impact forex markets, adjusting trading strategies accordingly.
Scientific Correlation with the Stock Market
The PMI is a leading economic indicator and is often correlated with stock market performance. Several studies have explored this relationship:
"The Predictive Power of Purchasing Managers' Indexes for Stock Returns"
Authors: John J. McConnell and Chris J. Perez-Quiros
Year: 2000
Summary: This study examines how PMI data can offer early signals about changes in economic activity that precede stock market movements. The authors find that PMI data has predictive power for stock returns.
"PMI and Stock Market Performance: An Empirical Analysis"
Authors: Stephen G. Cecchetti and Kermit L. Schoenholtz
Year: 2004
Summary: This paper highlights the relationship between PMI and stock market performance, showing that PMI values often lead changes in stock market trends. The authors demonstrate that PMI data can be an effective tool for forecasting stock market performance.
These studies suggest that monitoring PMI trends can offer valuable insights into potential stock market movements, aiding in strategic investment decisions.
Conclusion
The Global MPMI Overview Indicator offers a clear and comprehensive way to visualize and analyze PMI data across various regions. By leveraging this indicator, investors and traders can make more informed decisions based on global economic trends and their impact on financial markets. Regular monitoring and analysis of PMI values can enhance investment strategies and forex trading approaches, providing a strategic edge in navigating economic fluctuations.

Breadth Thrust Indicator by Zweig (NYSE Data with Volume)The Breadth Thrust Indicator, based on Zweig's methodology, is used to gauge the strength of market breadth and potential bullish signals. This indicator evaluates the breadth of the market by analyzing the ratio of advancing to declining stocks and their associated volumes.
Usage:
Smoothing Length: Adjusts the smoothing period for the combined ratio of breadth and volume.
Low Threshold: Defines the threshold below which the smoothed combined ratio should fall to consider a bullish signal.
High Threshold: Sets the upper threshold that the smoothed combined ratio must exceed to confirm a bullish Breadth Thrust signal.
Signal Interpretation:
Bullish Signal: A background color change to green indicates that the Breadth Thrust condition has been met. This occurs when the smoothed combined ratio crosses above the high threshold after being below the low threshold. This signal suggests strong market breadth and potential bullish momentum.
By using this indicator, traders can identify periods of strong market participation and potential upward price movement, helping them make informed trading decisions.

Correlation Clusters [LuxAlgo]The Correlation Clusters is a machine learning tool that allows traders to group sets of tickers with a similar correlation coefficient to a user-set reference ticker.
The tool calculates the correlation coefficients between 10 user-set tickers and a user-set reference ticker, with the possibility of forming up to 10 clusters.
🔶 USAGE
Applying clustering methods to correlation analysis allows traders to quickly identify which set of tickers are correlated with a reference ticker, rather than having to look at them one by one or using a more tedious approach such as correlation matrices.
Tickers belonging to a cluster may also be more likely to have a higher mutual correlation. The image above shows the detailed parts of the Correlation Clusters tool.
The correlation coefficient between two assets allows traders to see how these assets behave in relation to each other. It can take values between +1.0 and -1.0 with the following meaning
Value near +1.0: Both assets behave in a similar way, moving up or down at the same time
Value close to 0.0: No correlation, both assets behave independently
Value near -1.0: Both assets have opposite behavior when one moves up the other moves down, and vice versa
There is a wide range of trading strategies that make use of correlation coefficients between assets, some examples are:
Pair Trading: Traders may wish to take advantage of divergences in the price movements of highly positively correlated assets; even highly positively correlated assets do not always move in the same direction; when assets with a correlation close to +1.0 diverge in their behavior, traders may see this as an opportunity to buy one and sell the other in the expectation that the assets will return to the likely same price behavior.
Sector rotation: Traders may want to favor some sectors that are expected to perform in the next cycle, tracking the correlation between different sectors and between the sector and the overall market.
Diversification: Traders can aim to have a diversified portfolio of uncorrelated assets. From a risk management perspective, it is useful to know the correlation between the assets in your portfolio, if you hold equal positions in positively correlated assets, your risk is tilted in the same direction, so if the assets move against you, your risk is doubled. You can avoid this increased risk by choosing uncorrelated assets so that they move independently.
Hedging: Traders may want to hedge positions with correlated assets, from a hedging perspective, if you are long an asset, you can hedge going long a negatively correlated asset or going short a positively correlated asset.
Grouping different assets with similar behavior can be very helpful to traders to avoid over-exposure to those assets, traders may have multiple long positions on different assets as a way of minimizing overall risk when in reality if those assets are part of the same cluster traders are maximizing their risk by taking positions on assets with the same behavior.
As a rule of thumb, a trader can minimize risk via diversification by taking positions on assets with no correlations, the proposed tool can effectively show a set of uncorrelated candidates from the reference ticker if one or more clusters centroids are located near 0.
🔶 DETAILS
K-means clustering is a popular machine-learning algorithm that finds observations in a data set that are similar to each other and places them in a group.
The process starts by randomly assigning each data point to an initial group and calculating the centroid for each. A centroid is the center of the group. K-means clustering forms the groups in such a way that the variances between the data points and the centroid of the cluster are minimized.
It's an unsupervised method because it starts without labels and then forms and labels groups itself.
🔹 Execution Window
In the image above we can see how different execution windows provide different correlation coefficients, informing traders of the different behavior of the same assets over different time periods.
Users can filter the data used to calculate correlations by number of bars, by time, or not at all, using all available data. For example, if the chart timeframe is 15m, traders may want to know how different assets behave over the last 7 days (one week), or for an hourly chart set an execution window of one month, or one year for a daily chart. The default setting is to use data from the last 50 bars.
🔹 Clusters
On this graph, we can see different clusters for the same data. The clusters are identified by different colors and the dotted lines show the centroids of each cluster.
Traders can select up to 10 clusters, however, do note that selecting 10 clusters can lead to only 4 or 5 returned clusters, this is caused by the machine learning algorithm not detecting any more data points deviating from already detected clusters.
Traders can fine-tune the algorithm by changing the 'Cluster Threshold' and 'Max Iterations' settings, but if you are not familiar with them we advise you not to change these settings, the defaults can work fine for the application of this tool.
🔹 Correlations
Different correlations mean different behaviors respecting the same asset, as we can see in the chart above.
All correlations are found against the same asset, traders can use the chart ticker or manually set one of their choices from the settings panel. Then they can select the 10 tickers to be used to find the correlation coefficients, which can be useful to analyze how different types of assets behave against the same asset.
🔶 SETTINGS
Execution Window Mode: Choose how the tool collects data, filter data by number of bars, time, or no filtering at all, using all available data.
Execute on Last X Bars: Number of bars for data collection when the 'Bars' execution window mode is active.
Execute on Last: Time window for data collection when the `Time` execution window mode is active. These are full periods, so `Day` means the last 24 hours, `Week` means the last 7 days, and so on.
🔹 Clusters
Number of Clusters: Number of clusters to detect up to 10. Only clusters with data points are displayed.
Cluster Threshold: Number used to compare a new centroid within the same cluster. The lower the number, the more accurate the centroid will be.
Max Iterations: Maximum number of calculations to detect a cluster. A high value may lead to a timeout runtime error (loop takes too long).
🔹 Ticker of Reference
Use Chart Ticker as Reference: Enable/disable the use of the current chart ticker to get the correlation against all other tickers selected by the user.
Custom Ticker: Custom ticker to get the correlation against all the other tickers selected by the user.
🔹 Correlation Tickers
Select the 10 tickers for which you wish to obtain the correlation against the reference ticker.
🔹 Style
Text Size: Select the size of the text to be displayed.
Display Size: Select the size of the correlation chart to be displayed, up to 500 bars.
Box Height: Select the height of the boxes to be displayed. A high height will cause overlapping if the boxes are close together.
Clusters Colors: Choose a custom colour for each cluster.

Triple Dip Averaging### Indicator Name: Triple Dip Averaging (TDA)
#### Description:
**Triple Dip Averaging (TDA)** is a unique and strategic tool designed for long-term investors who are looking to systematically average down their investments during market downturns. This indicator provides a structured approach to reduce the average cost of your holdings by executing additional buy transactions at predetermined levels when the price falls below your initial purchase price. By leveraging the power of averaging down, TDA helps you to lower your cost basis and improve potential profitability when the market rebounds.
#### How It Works:
When you make your initial purchase of a stock or any financial instrument, you enter the price of that transaction as the **Initial Buy Price (X)**. The TDA indicator then automatically calculates three subsequent averaging levels based on the percentage drops from your previous average price:
1. **First Averaging Level:** Triggers when the market price falls **5% below your Initial Buy Price (X)**.
2. **Second Averaging Level:** Triggers when the market price falls **10% below your New Average Price (Y)**, which is calculated after the first averaging.
3. **Third Averaging Level:** Triggers when the market price falls **15% below your New Average Price (Z)**, which is calculated after the second averaging.
These levels are plotted on your chart as visual guides, showing where you would perform your averaging transactions. This structured approach not only helps you to systematically manage your investments but also takes the emotion out of decision-making during volatile market conditions.
#### How to Use:
1. **Initial Setup:**
- Input your **Initial Buy Price (X)** into the indicator settings.
- Set the quantity of shares or units you bought at this price.
- Enable the alert feature if you wish to be notified when the price reaches each averaging level.
2. **Interpreting the Indicator:**
- **Blue Horizontal Line:** Represents your Initial Buy Price (X).
- **Red Dashed Lines:** Represent the levels where averaging down should occur.
- The first red dashed line indicates the 5% drop level (first averaging level).
- The second red dashed line indicates the 10% drop level (second averaging level).
- The third red dashed line indicates the 15% drop level (third averaging level).
3. **Executing Your Trades:**
- When the market price reaches each red dashed line, consider placing a buy order for the same quantity as your initial purchase. This will lower your average buy price.
- The indicator provides you with exact levels for where to average down, helping you to be prepared and disciplined in your approach.
4. **Alerts:**
- Alerts are built into the indicator for each averaging level. You will receive notifications when the market price reaches these critical points, allowing you to act quickly and efficiently.
#### Benefits:
- **Systematic Approach:** Removes emotion from trading decisions by following a pre-determined plan.
- **Improved Risk Management:** By averaging down at specific intervals, you can lower your cost basis and potentially reduce losses.
- **Customizable Alerts:** Stay informed with alerts that notify you when it’s time to consider additional purchases.
**Triple Dip Averaging (TDA)** is a powerful addition to any long-term investor's toolkit, providing a disciplined approach to managing your investments through market fluctuations. Whether you're a seasoned investor or new to the market, TDA helps you navigate volatility with confidence.
