Breakout Strategy #1Breakout above previous pivot points trigger a long. Close below pivot lows trigger the exit.
Most effective during trends.
Pivot Noktaları
TFs I Love Mondays V1The strategy calculates highs and lows of the previous week, and uses them as resistance and support lines. If crossing such resistance/support lines, the strategy enters a long or short position, and exists an open position with predefined profit-targets and a stop-loss.

@scorpiomanojFRM CBOSThis is a Camarilla pivot based trading strategy.
It falls under the category of initiative trading strategy and not responsive trading strategy.
This strategy buys or sells when price crosses Camarilla 4th level and exits at the close of the day or it breaches Camarilla 3rd level.
Backtested results are not guaranteed to perform in the future. Hence please use it at your own risk.
Respect risk management.

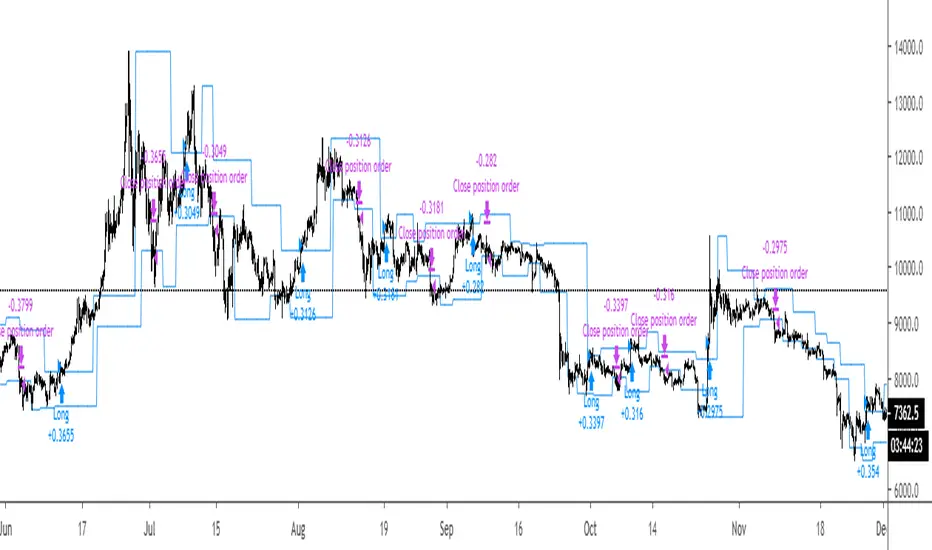
Pivot of Pivot Reversal Strategy [QuantNomad]Continue looking for more signifcant pivot points.
This script is based on my "Significant Pivot Reversal Strategy".
In this strategy I use concept of pivot of pivot points.
So for PoP I require that pivot highs point should have 2 lower pivot highs points around them and pivot low 2 higher pivot lows points.
Transparent lines represent usual pivot levels ints.
Not transparent lines represent pivot of pivot levels.
Link to original script:

Vilarso BotThis script is a trading strategy that is based on mathematical calculations of the average price on a chart for a certain period of time (EMA).
It is recommended to use an indicator (script Vilarso Bot) using a chart with a time frame of 1 hour. On other timeframes, the trading strategy will be less effective.
The indicator (script Vilarso Bot) is well suited for intraday trading strategy. Inside the day, on the 1 hour timeframe, the indicator determines high and low price values. You must also take into account the direction of the trend, since in the lateral movement the flat indicator can (locally) mislead you.
It is recommended to use with additional technical analysis tools, which are also built into the functionality.
Before applying this indicator, be sure to study its behavior on the history of the chart!

SAMURAI SWORDSamurai Sword is an add on tool for Ninja Scalper and the next evolution of the Trend Trade Indicator.
It auto plots the fib retracement to speed up target acquisition support and resistance areas based on the formula to increase the success rate of trade entry and exits.
None of this is to be taken as investment advice but rather Edutainment and infotainment
#TradeSocially

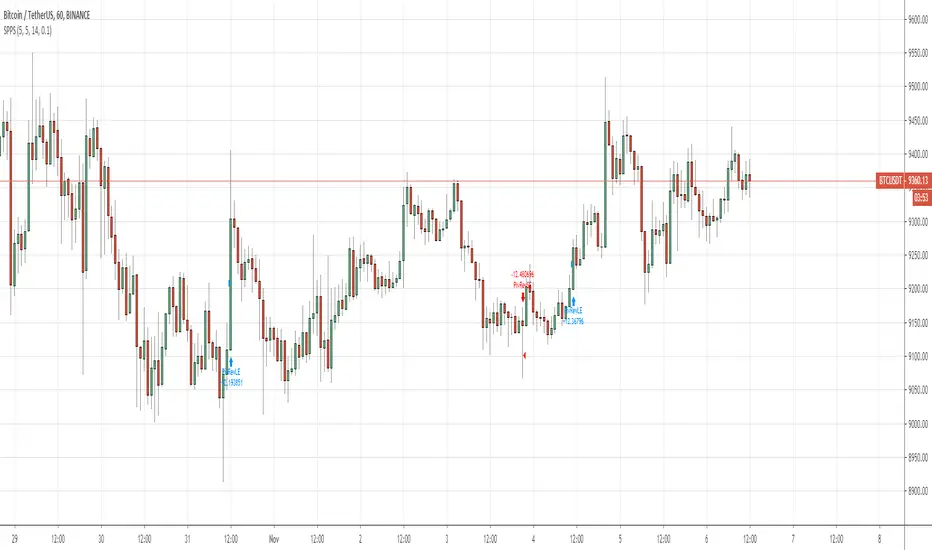
QuantNomad - Significant Pivot Reversal StrategyI'm working on improving the Pivot Points Reversal Strategy.
As one of the ways to filter out insignificant levels I decided to check that pivot point is not above/below neighbors, but check that it's above/below at least by a certain amount.
I use ATR, so in params, you can set length of ATR and also ATR multiplier. The new level will be calculated only if PP will be above/below neighbors by atr * atr_mult.
It seems this approach might help in some cases.
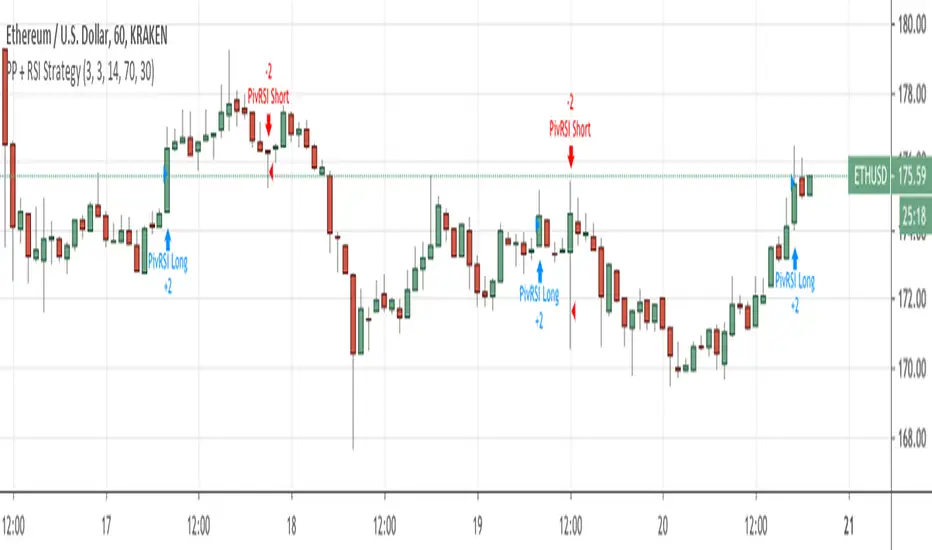
Here I have PivotPoint + RSI strategy:
Market Structure Finder [Dzenis]This indicator is designed to help you visualize the high timeframe market structure breaks and shifts in trend.
It finds local swing highs and lows, and defines the market structure based on them.
Break above the blue line = market structure is bullish, look for long/buy
Break below the red line = market structure is bearish, look for short/sell
I wrote it as a strategy so it can be easily backtested, giving a more complete picture of its effectiveness for catching larger swings.
It works best in trending markets such as Bitcoin.
This specific backtesting strategy and buy/sell signals on the chart are meant for trading the spot markets.
Buy signal triggers the entry with 70% of the trading capital (can be adjusted in the indicator menu and backtested with different percentages).
Sell signal exits the position.
The results assume 0.1% trading fees by default (adjustable in the menu as well).
It does not repaint.
If trading the futures markets it can be used purely as an indicator to help you form a HTF bullish/bearish bias and look for trade setups accordingly.
Although it's not designed for intraday moves, it can be used on lower timeframes as well.
8h timeframe for swing trades.
1h timeframe for intraday setups.
Daily timeframe is still the suggested and main use of this indicator (forming high timeframe bias).
For any questions and inquiries, feel free to DM me.

Pivot Point Reversal + RSI StrategyThis strategy joins the Pivot Reversal strategy with the RSI indicator.
We check RSI level at the pivot point level and only if RSI condition is satisfied we update levels for stop orders.
The strategy works pretty good for crypto, 30m, 1h, 2h timeframes.
Arrows 1.0Version 1.0
This script uses cycle values to create arrow triggers for support/restiance strategy

Channel Strategy for CryptoCurrenciesIts a break-out strategy with simple rules and strict money management (every trade risk 1% of the equity)
Entry happens on breakout of significant swing points.
Initial stop loss is on the opposite swingpoint and will be trailed by multiple factors including a maximum distance to the current price.
Works best on BTCUSD on H4. Also good results on higher timeframes.
also cross checked other pairs. works on IOTUSD and EOSUSD . Seems to have some troubles (in default params) with LTC and XRP.
feel free to leave a comment and please tell me if you find a reason why this shouldn't make you rich :D


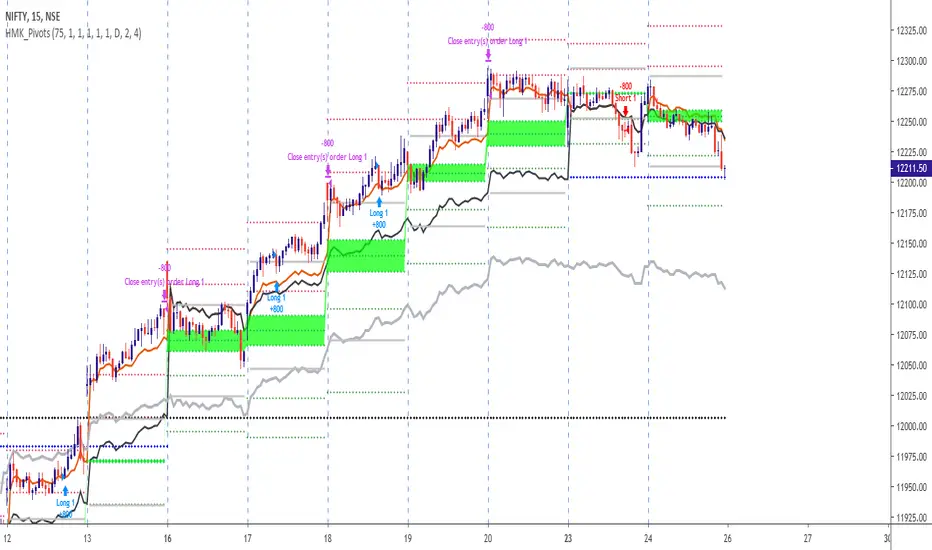
PivotIntradayStrategy@scorpiomanojFRMThis is an intraday trading strategy using Floor Pivots for BankNifty.
This strategy overlays on the charts with wide variety of drawing floor pivots and previous day levels.
VERY IMPORTANT :
1) LONGS AND SHORTS TO BE TAKEN IN 5 MIN CHART. 15 MIN CHART IS DISPLAYED BECAUSE TV DOESNT ALLOW TO PUBLISH WITH TF LESS THAN 15 MIN.
2) BACKTEST RESULTS ASSUME EXITS AT DAY CLOSE ONLY AND NOT BASED ON ANY OTHER CONDITIONS. HENCE ONCE LONG OR SHORT INITIATED IT IS SUGGESTED TO EXIT USING TRAILING STOP OR YOUR OWN RISK APPETITE. EVEN DAY CLOSE INTRADAY EXITS OFFERS A FAIRLY GOOD RESULT WITH ABOVE AVERAGE SUCCESS RATE AND PROFIT FACTOR IN EXCESS OF 1.75.
3) STRATEGY IS BASED ON COMBINATION OF PATTERNS INVOLVING DAILY PIVOTS AND PREV DAY LEVELS THAT IS FOUND TO REPEAT IN BANKNIFTY.
THE DETAILS OF THE STRATEGY IS CONFIDENTIAL.
4) THIS WILL BE AVAILABLE PUBLICLY ONLY FOR A LIMITED PERIOD. THIS LIMITED PERIOD AVAILABILITY IS TO TEST THE RESULTS AMONG VARIOUS PARTICIPANTS INORDER TO SEE THE CONSISTENCY.
YOU CAN REACH ME AT MY TWITTER ID scorpiomanojfrm or my email scorpiomanojfrm AT gmail DOT com
Pivot Extension Strategy_MoneyManagmentCreated using pinescript version 4, just an updated script of the example Pivot Extension Strategy.

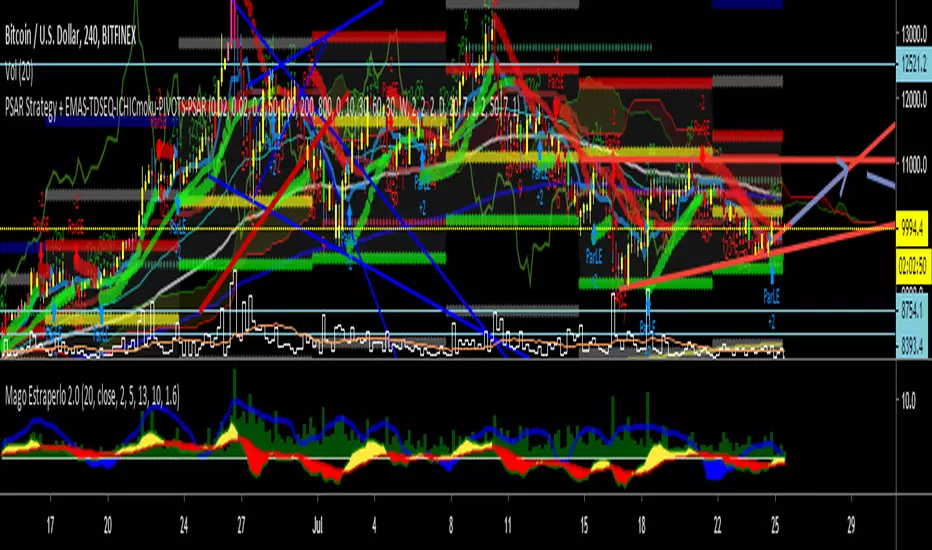
PSAR Strategy + EMAS-TDSEQ-ICHICmoku-PIVOTS-PSARPSAR Strategy + EMAS-TDSEQ-ICHICmoku-PIVOTS-PSAR
In this script you have a good strategy, called Parabollic PSAR and this indicators:
4 EMAS --> 50, 100, 200 and 800
TD Secuential
Ichimoku indicator
Pivots
Parabolic PSAR.
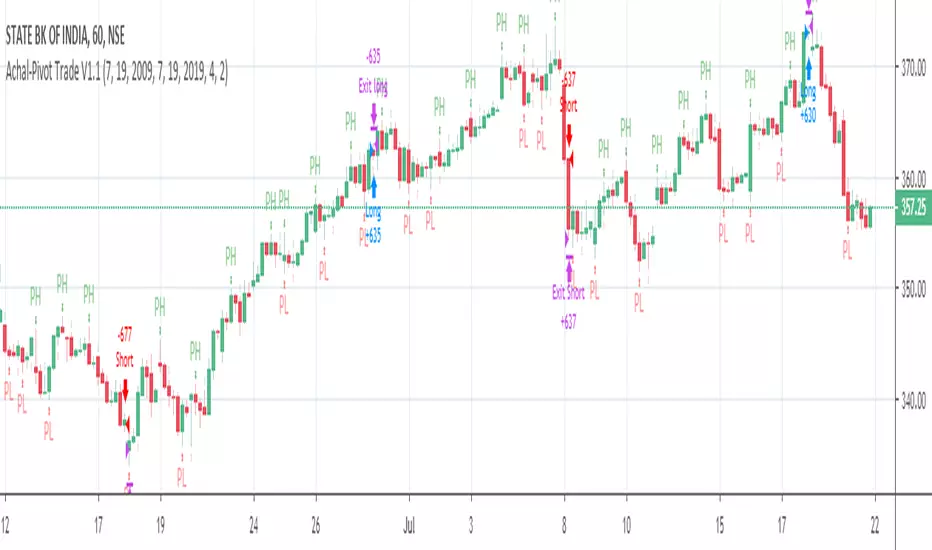
Achal-Pivot Trade Strategy v1.0Yesterday , I learned to script in pine. I have implemented strategy based on pivot points . When previous pivot point is broken , script takes decision to go long on various other parameters i.e. filtering of signals. Exit of position is purely based on trailing stop loss.
This script seems to be best suited for intraday trading as average bars per trades are less.
Short function has not been defined yet.
Waiting for comments, so that improvements can be made
Regards
QuantNomad - Pivot Reversal Strategy - XBTUSD - 1hPivot reversal strategy almost always works pretty good for crypto.
Here is setup with 4 left, 4 right bars for pivot points for XBTUSD 1h chart.
It shows a pretty nice performance of 350% with only 10% dd, Sharpe is 1.16.
If you're interested in using this strategy in my scripts you can find alerts for it and a version with added backtesting range.
And remember:
Past performance does not guarantee future results.


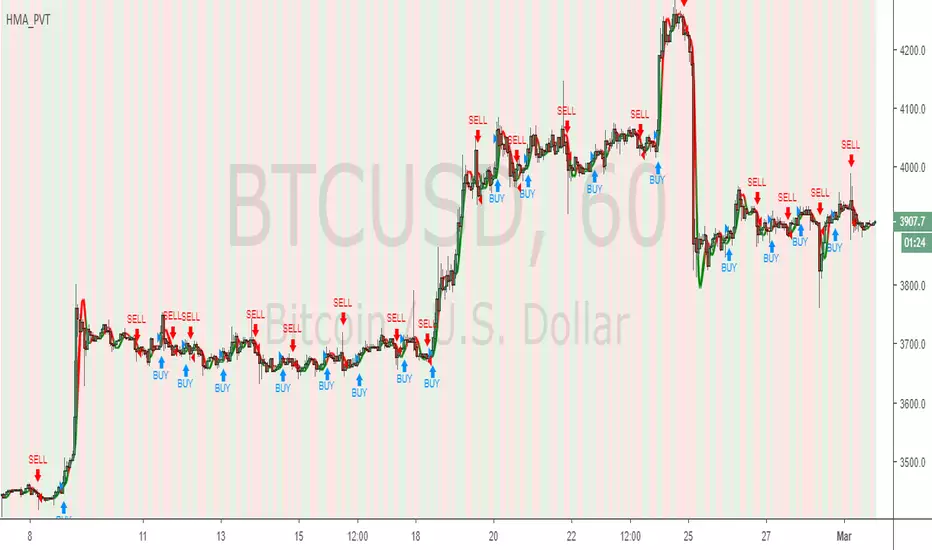
Hull MA & Pivot StrategyPivot points combined with HMA x2 crossover
(Hull moving average, 2 of them, if the price hits a pivot point in combination with the hull crossover being the same way, order entry)
FractalSqueezeRecommended; Range Bars / find the optimal hit rate between the 33R / 66R / 100R for individual securities or a combination of all 3.
Algorithm determines the geometric state of securities prices and is triggered by volatility expansion on multiple key scales in a unified direction. The unique advantage of this system is that the signal is capable of both strengthening on the long side in the face of negative price action and strengthening on the short side in the face of positive price action, to optimize the signal, trade the divergence of price and output value.


Failure Swing Strategy (stop hunting) V1 (Made on XBT/USD 4h Bitmex)
This strategy is a first attempt to countertrade the false break of a key support/resistance.
If a candle breaks the level, but it comes back before close, it will trigger an order.
The Stop Loss is in %, the Take Profit is near the EMA.
There is a "volatility filter" to block orders when the price is near the EMA and a coefficient to adjust a little the Stop Loss and Take Profit according to the chart condition.
