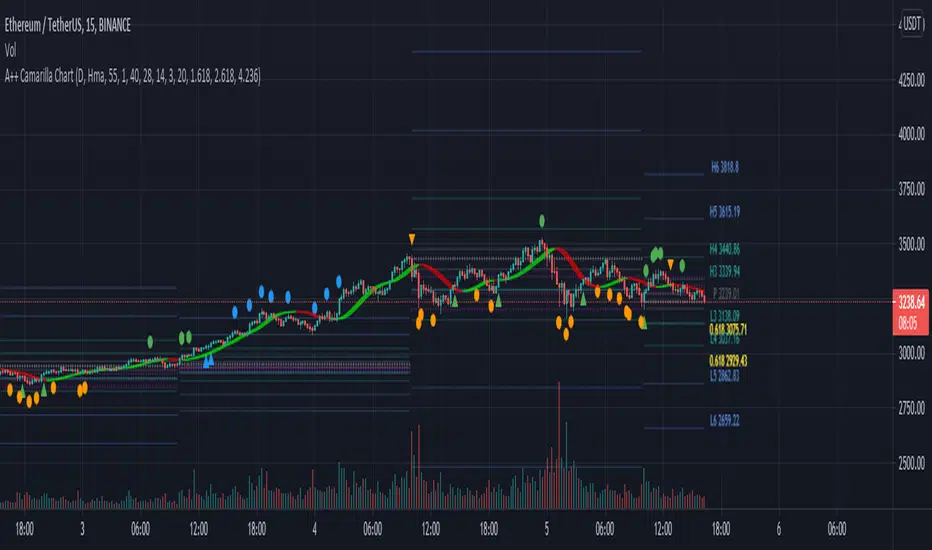
A++ Camarilla ChartChart Only
How to Use Camarilla Pivot Points
Camarilla Pivot Points offer guidance for both sideways and trending markets.
Trading the Camarilla Pivot Points is done on the basis of open price on the next day (or session).
Depending on where price opens, the tool can suggest a trade that could exploit a reversion to the mean or a breakout to new highs or lows.
CENTRAL PIVOT RANGE
Wide CPR >1%= possible ranging day within h3 to l3
Narrow CPR<1%= possible breakout/breakdown day…up to h5 or l5
CPR forming within previous day’s cpr =possible breakout/breakdown day…up to h5 or l5
The Rules Associated with this Indicator are as follows:
Look at the opening price for the stock/ futures / commodities /currency.
CAMARILLA PIVOTS POINT RULES FOR THIS INDICATOR
-------------------------------------------------- Scenario 1 --------------------------------------------------
------------------------- Case 1 - Open price is between H3 and L3 -------------------------
If CPR width >1%
For Long (strong buy signal)
Wait for the price to go below L3 and then when it moves back above L3, buy.
Stoploss- L4.
Target1 - H1
Target2 - H2
Target3 - H3
CPR Test Required? -(NO)
For Short Sell (strong sell signal)
Wait for the price to go above H3 and then when the price moves back below H3, sell.
Stoploss- H4.
Target1 - L1
Target2 - L2
Target3 - L3
CPR Test Required? - (NO)
------------------------- Case 2 - Open price is between H3 and L3 -------------------------
If CPR width >1% nd L3 or H3 are forming within the CPR
For Long (strong buy signal)
Wait for the price to go below L3 and then when it moves back above L3, buy.
Stoploss- L4
Target1 - H1
Target2 - H2
Target3 - H3
CPR Test Required? - (yes)
For Short Sell (strong sell signal)
Wait for the price to go above H3 and then when the price moves back below H3, sell.
Stoploss- H4
Target1 - L1
Target2 - L2
Target3 - L3
CPR Test Required? - (yes)
------------------------- Case 3 Open price is between H3 and L3-------------------------
Not Considering CPR
For Long
Wait for the price to go below L3 and then when it moves back above L3, buy.
Stoploss- L4
Target1 - H1
Target2 - H2
Target3 - H3
For Short Sell
Wait for the price to go above H3 and then when the price moves back below H3, sell.
Stoploss- H4
Target1 - L1
Target2 - L2
Target3 - L3
-------------------------------------------------- Scenario 2 --------------------------------------------------
Open price is between H3 and H4
IF CPR is narrow and width is <1 %
For Long
When price moves above H4, buy.
Stoploss - H3
Target 1 - H5
Target 2 - H6
For Short Sell
When the price goes below H3, sell.
Stopless- H4
Target1 - L1
Target2 - L2
Target3 - L3
-------------------------------------------------- Scenario 3 --------------------------------------------------
Open price is between L3 and L4
For Long
When price moves above L3, buy.
Stoploss - L4.
Target1 - H1
Target2 - H2
Target3 - H3
For Short Sell
When the price goes below L4, sell. Stoploss when price moves above L3.
Target 1 - L5
Target 2 - L6
-------------------------------------------------- Scenario 4 --------------------------------------------------
Open price is outside the H4 and L4
Wait for the prices to come in range and trade accordingly.
Pivot Noktaları
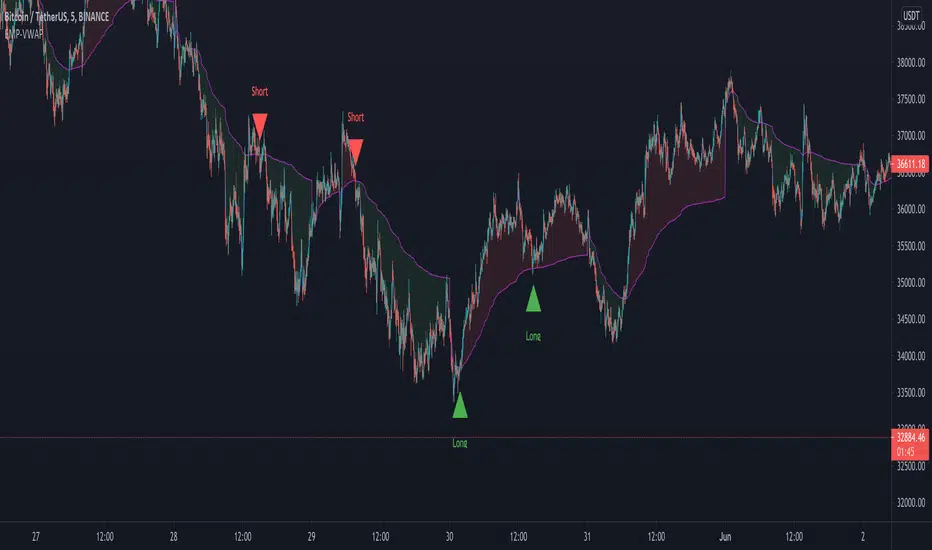
EmperorBTC's VWAP IndicatorThis indicator was created after EmperorBTC's conditions. Conditions displayed below:
Good timeframes for it: 30', 15', 5'
To convert from strategy to study switch the commented lines in the beginning and at the end of the script
What this indicator does is:
1) Check if Pivot Point was crossed
2) Stoch-RSI and VWAP were crossed up in current or previous candle
3) Candle (or previous candle) is green
Then, it will plot a Long opportunity.
FUTURE IDEAS:
- Volume Expansion
- Candle Stick patterns
ORTI Swing High Low / Support Resistance (Static TFM)The "ORTI Swing High Low / Support Resistance (Static Timeframe Multi-Period)" is based into existing studies that shows support and resistance levels taking as reference the highest and lowest points of certain periods, as a redesigned and recalculated set of the common plotted lenght.
The cherry on the top for this version is, when you want to get a predetermined count in (ranges) units of time, as: minutes, hours or days, in any a intraday graph you could get a static lenght, and this count will be automatically respected. For example, an average could be configured to know a high or low levels per hour, day, week or month ... or whatever comes to mind, and at every single chart that you move through (5m, 15m, 1h, 4h, etc), you will see the same lenght to make your own "support and resistance analysis" into a micro / macro market view.
Remember that part of analyzing chart patterns, the support and resistance levels are undoubtedly two of the most highly discussed attributes of technical analysis. Part of analyzing chart patterns, these terms are used by traders to refer to price levels on charts that tend to act as barriers, preventing the price of an asset from getting pushed in a certain direction.
With the new features, you will get a little help to identify in your technical analysis some signals to identify price points on a chart where the probabilities favor a pause or reversal of a prevailing trend. Support and resistance areas can be identified on your charts using this indicator.
For more technical information look at Investopedia.
Note: The previous calculation example is not the default, the parameters can be adjusted according to the criteria of the merchant.

Horizontal Plot Lines - Max. 24 - grid strategy - DARK LINESWhen I looked for something like this I couldn't find it. Although simple in appearance, this script was actually quite long and complicated to create. It allows you to break up any horizontal space in up to 24 lines. Just remember that 13 lines equal 12 levels, as the top and bottom lines are the placeholders. So, if you are using quarters theory, you would want to select 5 lines.
It automatically sets the top line at a user-selectable place, like the close of the highest candlestick. It also allows you to select the lowest point as the close or the low. This way you can use the bodies of the candlestick or the wicks. You can also set the lookback period, so that your high and low can be set as far back as you prefer in the timescale you are looking at.
You can use these lines in things like quarters theory, or analyze buy and sell points in a grid bot strategy. This indicator could help you to determine where to equally place your buy and sells in a grid with up to 24 different placements.
This version has dark lines and is suitable for the light template. There is a matching light line version for a dark template.

EMA SMA 100 CrossThis script utilizes the 100 EMA and the 100 SMA with printing labels for "Buy", "Short", and "Take Profit".
Essentially this indicator will print a "Buy" label when the 100 EMA(green line) is above the 100 SMA(red line) and "Take Profit" at the pivot points.
NOTE: There will be instances where the labels print based on coded criteria but will be false compared to trend. This is because the 100 EMA and SMA crosses can be short periods and reversals can happen frequently. This indicator should be used in conjunction with other indicators to help build a case for potential long or short entries.

Pivot Point CandlesIndicator that highlights Hammer, Inverted Hammer, Engulfing, and Harami candlestick patterns. Great for those looking for a quick way to show the most popular reversal patterns on the charts.
Options will allow you to select to show Hammers, Engulfing or Harami patterns only. You choose the combinations that you want. Great tool to learn and training your eyes to the patterns.
You also have an option to select "Super" versions of the Engulfing and the Harami patterns, the Supers only shows if the pattern engulfs the body and the wick of the smaller candle in the pattern.
The indicator will show Bullish opportunities and Bearish opportunities on the chart for each of the patterns. The inverted hammer will show at the top indicating a Bear move, and the Hammer will show below price indicating a Bullish move.
Use this indicator in conjunction with other Support & Resistance such as the simple moving averages, trend lines, flat lines, or even Bollinger bands. When these patterns show at or around these points on the chart they will indicate a reversal is pending. Wait for the next candle as confirmation that the move will actually take place in the direction indicated and you will have your pivot point on the chart and create a higher probability of success. Leverage Stochastic, RSI, or CCI indicators to help confirm the reversal as well. Look out for resistance above or support below to determine your targets for the reversal.
Happy trading!

Session Breaks by KrisWatersThis indicator draw vertical lines on session break dates. There are 1H, 4H, D, W, M, 3M, 12M options. You can change line colors and style as you wish.
If you are using this indicator please drop me comment and like also.

Fibonacci PP Party LTMulti-timeframe fibonacci pivot point analysis with 38.2%, 61.8% and 100% retracement levels.
Select and agglomerate different fib timeframes on your single timeframe chart fren .
The following scopes made available and stackable to your heart's desire (toggle on or off timeframes within settings):
1 Month
3 Week
2 Week
1 Week
5 Day
4 Day
3 Day
2 Day
1 Day
Go ahead, hit up that 1m & keep major support and resistance levels in plain view.
Rid your self of narrow scope , ya dope.
Warning: slow performance due to enormous heaps of timeframes hitting the dome.
Let me know where the errors are.
Make Money
Ya dummy

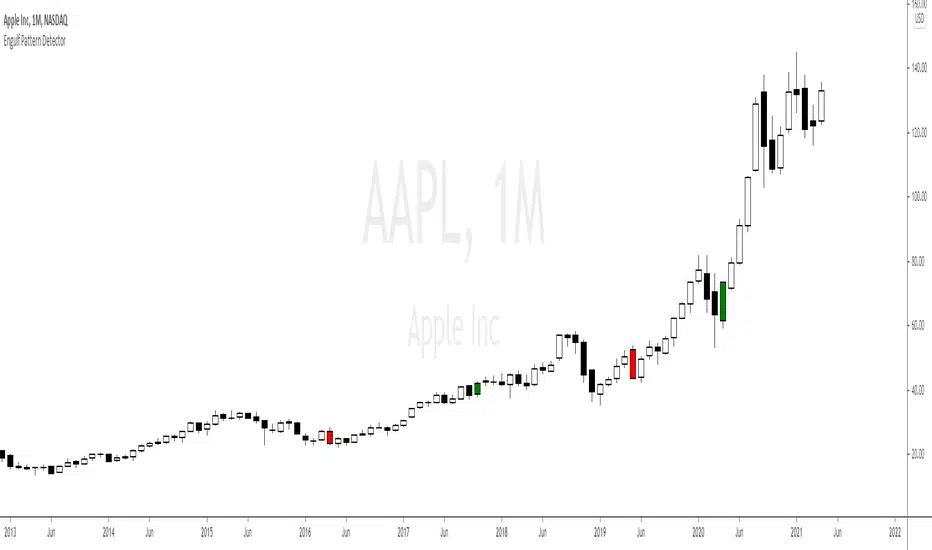
Engulf Pattern DetectorThis indicator let us automatically detect and color the strongest and most powerful Engulf Patterns in any time frame.
Its difference and great potential regarding other existing indicators is that its formula takes into account the average size of the previous candles throughout the ATR, therefore, it only indicates the really strong ones that interest us for Price Action, Supports and Resistances in supply and demand levels. These strongest levels are the ones which work at best as turning points pivot points for the market.
This indicator let us to adjust ourselves to the best configuration by means of parameters in order to be more strict in the force of the impulses and to approximately mark the quantity of Engulf Patterns.
Este indicador nos permite detectar y pintar de color de forma automática los Patrones Engulf más fuertes y potentes en cualquier marco de tiempo posible.
Su diferencia y gran potencial con respecto a los demás indicadores existentes es que su fórmula tiene en cuenta el tamaño medio de las velas anteriores mediante el ATR y por tanto, sólo señala los realmente fuertes que nos interesan para el Price Action y los Soportes y Resistencias en niveles de Oferta y Demanda. Estos niveles más fuertes son aquellos que mejor funcionan como puntos pivote de giro del mercado.
Este indicador nos permite ajustar mediante los parámetros la mejor configuración para ser más estrictos en la fuerza de los impulsos y marcar más o menos cantidad de patrones de Engulf.
Parameters Settings / Parámetros Ajustables:
[ ERC Min Body vs Full Candle Size % : Minimum body percentage vs full candle to consider “Extended Range Candle”, default 75% / Porcentaje mínimo del “cuerpo” de la vela con respecto a la vela entera para considerarla una “Vela Extendida”, por defecto 75%]
[ Engulf Full Candle Size vs ATR % : Minimum Full candle size percentage vs ATR average, default 150% / Porcentaje mínimo del tamaño de la vela completa respecto al ATR medio, por defecto 150%]
[ ATR Length : Candles Number to calculate ATR average, default 30 / Cantidad de velas para medir el ATR, por defecto 30]
[ Use ATR filter? : We can activate or deactivate the ATR calculates, default activated / Podemos anular el cálculo sobre el ATR y hacerlo normal, por defecto activado]
Color Settings / Colores Ajustables:
[ Color 0 : Vela Engulf Alcista / Bullish Engulf]
[ Color 1 : Vela Engulf Bajista / Bearish Engulf]
Pivot Points - Daily(with CPR)/Weekly/Monthly with two EMAsThis script plots all the Pivot points and Support/Resistance on your chart
You can chose Daily, Weekly or Monthly pivot.
Daily Pivot has CPR, 4 support levels and 4 resistance levels
Monthly and Weekly pivot has 3 supports and 3 resistance.
You will also get to plot two EMAs if you want.
Untick the checkbox of Primary EMA and Secondary EMA if you don't want to see EMAs(by default EMAs are disabled)
As this is a leading indicator, price reacts to these levels quite significantly.
You can use this indicator by 'Add to Favourite Indicators' option

Fibonacci Extension / Retracement / Pivot Points by DGTFɪʙᴏɴᴀᴄᴄɪ Exᴛᴇɴᴛɪᴏɴ / Rᴇᴛʀᴀᴄᴍᴇɴᴛ / Pɪᴠᴏᴛ Pᴏɪɴᴛꜱ
This study combines various Fibonacci concepts into one, and some basic volume and volatility indications
█ Pɪᴠᴏᴛ Pᴏɪɴᴛꜱ — is a technical indicator that is used to determine the levels at which price may face support or resistance. The Pivot Points indicator consists of a pivot point (PP) level and several support (S) and resistance (R) levels. PP, resistance and support values are calculated in different ways, depending on the type of the indicator, this study implements Fibonacci Pivot Points
The indicator resolution is set by the input of the Pivot Points TF (Timeframe). If the Pivot Points TF is set to AUTO (the default value), then the increased resolution is determined by the following algorithm:
for intraday resolutions up to and including 5 min, 4HOURS (4H) is used
for intraday resolutions more than 5 min and up to and including 45 min, DAY (1D) is used
for intraday resolutions more than 45 min and up to and including 4 hour, WEEK (1W) is used
for daily resolutions MONTH is used (1M)
for weekly resolutions, 3-MONTH (3M) is used
for monthly resolutions, 12-MONTH (12M) is used
If the Pivot Points TF is set to User Defined, users may choose any higher timeframe of their preference
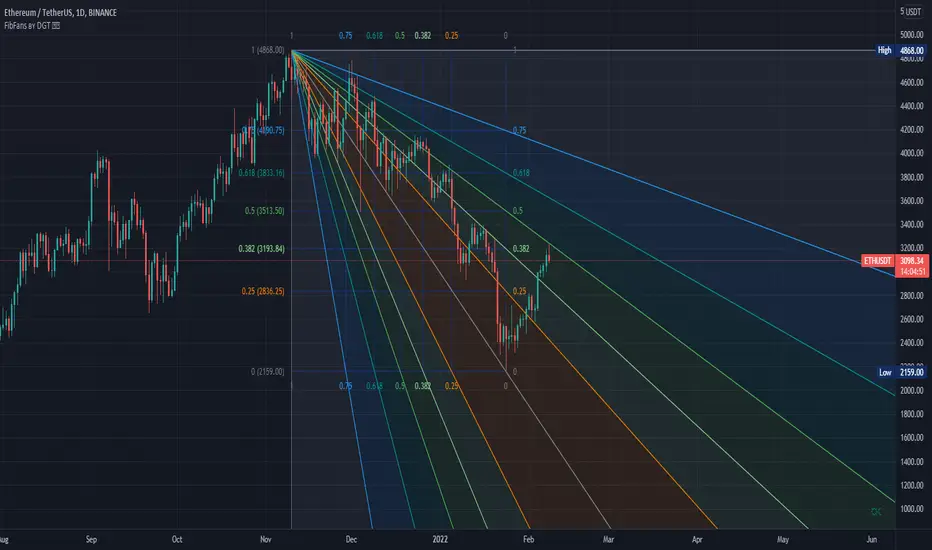
█ Fɪʙ Rᴇᴛʀᴀᴄᴇᴍᴇɴᴛ — Fibonacci retracements is a popular instrument used by technical analysts to determine support and resistance areas. In technical analysis, this tool is created by taking two extreme points (usually a peak and a trough) on the chart and dividing the vertical distance by the key Fibonacci coefficients equal to 23.6%, 38.2%, 50%, 61.8%, and 100%. This study implements an automated method of identifying the pivot lows/highs and automatically draws horizontal lines that are used to determine possible support and resistance levels
█ Fɪʙᴏɴᴀᴄᴄɪ Exᴛᴇɴꜱɪᴏɴꜱ — Fibonacci extensions are a tool that traders can use to establish profit targets or estimate how far a price may travel AFTER a retracement/pullback is finished. Extension levels are also possible areas where the price may reverse. This study implements an automated method of identifying the pivot lows/highs and automatically draws horizontal lines that are used to determine possible support and resistance levels.
IMPORTANT NOTE: Fibonacci extensions option may require to do further adjustment of the study parameters for proper usage. Extensions are aimed to be used when a trend is present and they aim to measure how far a price may travel AFTER a retracement/pullback. I will strongly suggest users of this study to check the education post for further details, where to use extensions and where to use retracements
Important input options for both Fibonacci Extensions and Retracements
Deviation, is a multiplier that affects how much the price should deviate from the previous pivot in order for the bar to become a new pivot. Increasing its value is one way to get higher timeframe Fib Retracement Levels
Depth, affects the minimum number of bars that will be taken into account when building
█ Volume / Volatility Add-Ons
High Volatile Bar Indication
Volume Spike Bar Indication
Volume Weighted Colored Bars
This study benefits from build-in auto fib retracement tv study and modifications applied to get extentions and also to fit this combo
Disclaimer:
Trading success is all about following your trading strategy and the indicators should fit within your trading strategy, and not to be traded upon solely
The script is for informational and educational purposes only. Use of the script does not constitute professional and/or financial advice. You alone have the sole responsibility of evaluating the script output and risks associated with the use of the script. In exchange for using the script, you agree not to hold dgtrd TradingView user liable for any possible claim for damages arising from any decision you make based on use of the script

Pivot Points by stelmaxFor pivot levels, we use different definitions of the pivot point. In fact, there are three different methods to calculate the reference level using this method.
For these pivot points, we set the variable x, the value of which depends on whether the open is higher or lower than the close.
If the close is less than the open, x = H + 2L + C.
If the close is higher than the open, x = 2H + L + C.
When open equals close, x = H + L + 2C
This final value will be one of the most commonly used designs. This is because, as FX is a 24 hour market, the open is almost always equal to the close.
If you look at the daily chart throughout the week, the close and the open are really just names. This is in contrast to the stock market, where the open and close are very different things, separated by time and price.
Once we have the pivot point and the x-value, we use it to compute the pivot point of the base P.
P = x / 4
Support and resistance levels are also calculated from x (pivot points do not use more than one support and resistance level).
S₁ = x / 2 - H
S₂ = x / 2 - L
Thus, we have seen how to calculate different types of Pivot Points indicator. But how can we now use them in our trade?
First, we can use our anchor point to define the general direction. - If the existing market price is above the key PP level, it suggests a bullish trend.
- If the market is below the key PP level, it suggests a bearish trend.
Pivot levels are set according to the value of the previous trading day.
+ If the price is below the PP pivot level - priority is given to sell deals, if higher - to purchases
+ Confirmatory signals can be candlestick patterns and the Stochastic indicator
+ The SL level can be set either for a signal candle or for the nearest level
+ Target - movement to the nearest support / resistance level
Keep in mind that the Pivot Level Indicator is not a complete trading system!
Remember that there are no indicators in trading that do not make mistakes, Pivot Points, like any others, require confirmation of their signals. When building your own trading system, use several indicators.
Observe Money Management. Never risk more than 2 percent of your capital in one trade. This approach will protect you from ruin and will allow you to consistently make money on Forex using the Pivot Point.
Be clear about your trading strategy. If, according to the pivot point strategy, you need to open a deal - open, if you fix the result - fix it, and it doesn't matter if you are in the black or not. Only following the rules of Pivot Points "from and to" will allow you to earn.

Camarilla TradingScenario 1
Open price is between H3 and L3
For Long
Wait for the price to go below L3 and then when it moves back above L3, buy. Stoploss will be when price moves below L4. Target1 - H1, Target2 - H2, Target3 - H3
For Short Sell
Wait for the price to go above H3 and then when the price moves back below H3, sell. Stoploss will be when price moves above H4. Target1 - L1, Target2 - L2, Target3- L3
Scenario 2
Open price is between H3 and H4
For Long
When price moves above H4, buy. Stoploss when price goes below H3. Target 1 - H5,
For Short Sell
When the price goes below H3, sell. Stopless when prices moves above H4. Target1 - L1, Target2 - L2, Target3- L3
Scenario 3
Open price is between L3 and L4
For Long
When price moves above L3, buy. Stoploss when price moves below L4. Target1 - H1, Target2 - H2, Target3 - H3
For Short Sell
When the price goes below L4, sell. Stoploss when price moves above L3. Target 1 - L5,
Scenario 4
Open price is outside the H4 and L4
Wait for the prices to come in range and trade accordingly.

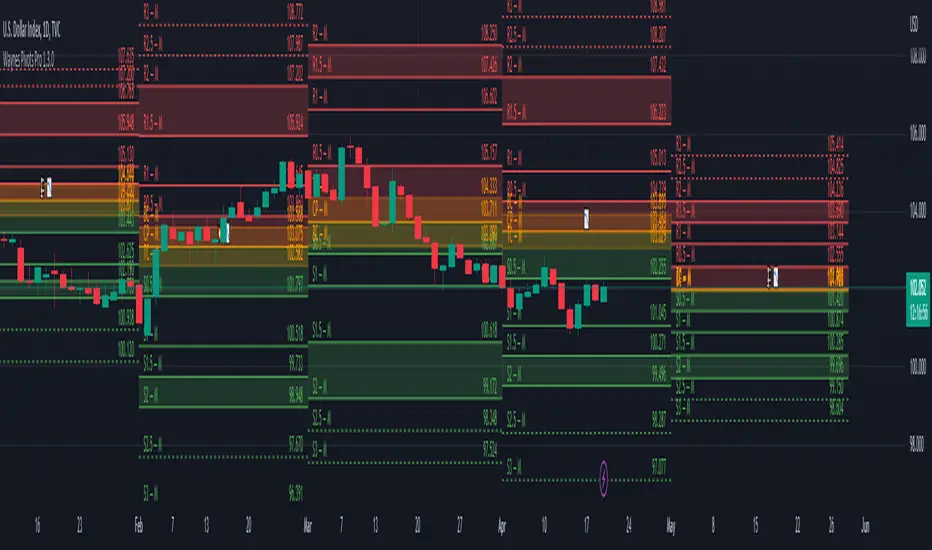
Wayne's Pivots ProThere is a public version of this indicator titled "Wayne's Pivots" if you would like to try out something similar to this indicator.
Wayne's Pivots Pro is named after Wayne McDonnel who came up with this indicator's pivot trading methodology. Wayne's Pivots are only one part of his methodology, but these pivots are the most critical part. They are frequently applied to supplement other trading methodologies as well. There are 3 key features that separate Wayne's Pivots specifically from every other pivot point indicator out there.
1. Midpoint Pivots
2. Biased Pivots
3. Next Period's Pivots
Understand that this indicator is supposed to be used, according to the methodology, alongside a fundamental bias. If you have not done fundamental research to know if you're a bull or bear on an asset, then you will likely not be using these pivots correctly. They do not tell you which direction the market will move. It tells you how far and how long a trade may go depending on which way you bias the pivots, and if your fundamental view was correct. This is trade planning tool for your entries and exits.
Breaking each point down:
1. Midpoint Pivots
If you take regular pivots (S#, R#), and get a histogram of every time price closed at or above each level, you generally end up with an even distribution. By adding midpoint levels you are doubling the amount of data, and increasing the resolution of the histogram. While these extra levels don't necessarily give us entries or exits, they do tell us when price doesn't quite reach a major support or resistance level. Midpoint pivot levels are calculated by finding the midpoint between each pivot level, and are labeled from the bottom up starting at M0 (Midpoint 0).
2. Biased Pivots
The traditional rules for trading pivot points are to buy support levels and sell resistance levels. In Wayne's methodology, we see pivots as a set for entries and take profits depending on our bias. It is known that trading the inverse of traditional pivot point rules that you can end up with a reasonable strategy. Biased pivots let us focus on only what matter to us by removing all other pivots, lines, and labels. Only showing us pivots useful to the bias we set.
For example, if you are a bull fundamentally you would set the bullish biased pivots. You would look for an entry in the area between the central pivot and second midpoint (M2), and an exit in the area between R2 and M4.
3. Next Period's Pivots
The third major feature of Wayne's Pivots are the "future" pivots. These are really calculated by taking the current HLC data and plotting it in realtime into the future before there's any data there. When we enter a new trading period, let say the day, we will have little data on the next day's pivots. As the current trading day goes on and gets closer to it's close, we start to see the next day's pivot points firm up. It's at this point that future pivots become actionable to create trading plans for the next day. The next period's pivots are exceptionally useful when scaled up to weekly, monthly, quarterly, and yearly timeframes. Daily, weekly, and monthly are the most commonly used within communities trading Wayne's methodology.
This is a completely rebuilt, professional use version of Wayne's Pivots. It includes many technical upgrades required by professional using Wayne's methodology. I released the original version publicly because it does not have many of the features here included in the Professional's version.
Features in Pro that are not in the public version:
Works on ALL timeframes.
Realtime pivot point updates.
Price levels on the pivots.
Extra pivots. (R3, M5, M0, S3)
All pivots start and end at the correct dates and times. (public version can't due to plot())
Easier to add more features!
Does this mean that you've abandoned the public version of Wayne's Pivots?
Absolutely not. Whenever there is a new feature in the Pro version, I always see if I can add it into the public one. It's just that the way it's built was not how I originally envisioned these pivots to be. If there's ever something that breaks the public version, I'm going to fix it because there's hundreds of people who use it.
I use the public version of Wayne's Pivots perfectly fine with my trading. Why switch to Pro?
Simply put, it's not going to give you the most accurate pivots that a professional would need. The pivots do not print properly on months with more or less than 30 days, and do their worst on short weeks. The public version has been like this ever since I first made it, and the only work around was to completely rebuild it. That's the major reason why I made the public version available to everyone in the first place. On top of all that, I can add way more features and customization options to these pivots than the public ones.
If I have a feature request will you try to implement it?
Absolutely! Some requests do have their limits, but don't be afraid to ask for something you really want. I'll try and implement lots of requested features as time goes on.
Trading Con Propositomy scrip intention is to make easier and simpler my analisis, having everything toghether helps me take desicions when to enter the market, the estrategy is based in moving averages, pivot points and structure, and the bollinger bands and the sthochastic are just another tool of confirmation when i'm goin to execute the trade.
the market for this strategy is more focused on futures and us stocks but it can be use in any other market. the way to use this strategy is simple, every time a candle goes thru a MA and pull's back to it is a sign of a possible trade, samething when it cuts thru a pivot point and the perfect condition is when the bollinger bands and the sthocasthic are in oversold and overbuy areas.

Auto Round Number and Repdigit LineAuto Round Number and Repdigit Line
It is an indicator that automatically draws round numbers of any number of digits and doublet horizontal lines.
Two horizon lines are drawn above and below the current price and are designed to always follow the price.
For "Round-Up / Round-Down Digits", specify "Number of zeros you want to arrange".
For "Repdigit Digits", specify "what digit of the current price you want to get doublet".
If you want to know how it behaves, use "Bar Replay".
(Google Translate)
任意の桁数のラウンドナンバーとゾロ目の水平線を自動で描画するインジケーターです。
水平線は現在の価格の上下に2本ずつ描画され、常に価格に追従するように設計されています。
「Round-Up / Round-Down Digits」は、「並べたいゼロの数」を指定してください。
「Repdigit Digits」は、「現在の価格の何桁目をゾロ目にしたいか」を指定してください。
挙動を知りたい場合は、「バーのリプレイ」を使ってください。

Lachie T.A.N.G.L.E.S system 1.0.9 (Alpha Release)The 'Lachie T.A.N.G.L.E.S system' is further development in my line of divergence indicators which applies a few different factors besides just flat divergence logic. This innovative script has been completely rebuilt from its predecessor: Lachie 5.0.1.2: DDS , which was not missing a lot of opportunities for users as it's sensitivity was pruned right back.
Introduction
The purpose of this indicator is to assist users in finding entries primarily using divergence logic. The indicator will show users when they should be paying attention as well as highlighting areas of entry as well as confirmation. While this indicator has 'signal' like components, its aim is more to assist users in making their own moves by providing confidence and/or educating them on areas of interest.
This indicator is a further release of my previous indicator Lachie 3.0: DDS (Divergence Detection System) and Lachie 5.0.1.2: DDS (Divergence Detection System).
What's new
Feedback on both Lachie 5.0.1.2: DDS and Lachie 3.0 DDS has helped shape the future direction of my indicators. With the aim of providing reliable results to users while maintaining a reasonable amount of opportunities, this new system is:
--Fully customizable (sensitivity and removal and/or addition of certain signals)
--Completely new re worked core logic (no longer RSI based)
--Increased compatibility over multiple timeframes
--Three components of confirmation.
--Increased compatibly across markets and pairs.
How to use and interpretation
Once permission has been assigned, you will add this indicator via 'indicators' and 'invite only scripts' section of TradingView's chart page. The system will spit out 6 types of signals. There will be bullish (green) and bearish (red) flags which are more to wake users up and pay attention to the set up unfolding (bullish/bearish divergence). Notably these flags on lower timeframes work well as scalping signals. The yellow triangles aim to highlight divergence formations and reasonable areas to consider taking a position. The purple diamonds are bullish and bearish confirmations based off separate proprietary logic. The strongest confirmation observed so far is having a flag, triangle and diamond within extremely close proximity to each other.
Customization
The system is completely customizable by selecting the little gear to the right of the indicator name. In the input section you will be able to control the sensitivity of the core logic of the indicator if it is too loud/not loud enough. If you find a particular component irrelevant or too annoying you can disable it in the styles tab. The style section will also allow you to manipulate the colour scheme and icons should you have a particular theme on your charts that the default settings break.
Future implementations
--Increased customization of each signal specifically (in development right now)
--Low volume support
--May be moved to pay for access once moved out of Alpha (BCE members not applicable to charge)
What is T.A.N.G.L.E.S?
Tangles is my Rainbow Lorikeet and the signals are based off her colours.
How to gain access (vendor requirement)
Please contact me in a direct message via TradingView to apply. BCE members contact via the BCE platform.
Created and owned by Lachlan Schahinger. (2021)

Bubbles DectorIn this version of my indicator, you can see the trend in the bars themselves, this is an extremely accurate view of how the market is performing on a lower scale timeframe.
The indicator calculates the buy and sell signals using HLC3, Simple Moving Average ( SMA ), and the Exponential Moving Average ( EMA ) as soon as they cross. This indicator is useful with time intervals starting at 3m .
I have already tested many other timeframes, the 3m gives the most logical point of view when trying to enter the market. I've also been able to see how the buy/sells signals perform, which they perform well if you're using ZONES. This is to note they help once you're able to see where the wick rejects.

Auto Fib Speed Resistance Fans by DGTFibonacci Speed and Resistance Fan is an analytical drawing tool used to indicate the support and resistance levels of an existing trend and the price level at which possible changes in the trend may occur.
A Fibonacci Speed Resistance Fan consists of a trend line drawn between two extreme points - a trough and opposing peak or a peak and opposing trough - on which a set of sequential speed resistance lines are drawn above (which represents time) and below (which represents price). These lines are drawn based on time/price percentages of the distance between the beginning and the end of the trend line.
Speed resistance lines not only help to measure trend corrections but also measure the speed of a trend (the rate at which a trendline ascends or descends)
Traders can use the lines of the Fibonacci Speed and Resistance Fan to predict key points of resistance or support, at which they might expect price trends to reverse. Once a trader identifies patterns within a chart, they can use those patterns to predict future price movements and future levels of support and resistance. Traders use the predictions to time their trades. Key support and resistance levels tend to occur frequently at the 61.8-percent level on both uptrends and downtrends.
Please check for further details in the education post that I will share shortly after this publication :
Nobody appears to know whether Fibonacci tools work because markets exhibit some form of natural pattern or because many investors use Fibonacci ratios to predict price movements, making them a self-fulfilling prophecy.
█ Study OPTIONS
Auto Fibonacci Speed and Resistance Fan , the main aim of the study
- Pivot threshold can be adjusted via “Deviation” and “Depth” input options
- Historical Fans option will allow plotting of Speed and Resistance Fans on previous pivot high/lows
- Ability to set ALERTs for the Speed and Resistance Levels
- Price Grid Lines if extended it will result with Fib Retracement levels
- All lines, line levels are customizable, default values are set exactly to the same with the available Fib Speed and Resistance Fan drawing tool
Zig Zag – Derived from build-in Auto Fib Retracement with some customization options.
Example Usages :
Disclaimer :
Trading success is all about following your trading strategy and the indicators should fit within your trading strategy, and not to be traded upon solely
The script is for informational and educational purposes only. Use of the script does not constitute professional and/or financial advice. You alone have the sole responsibility of evaluating the script output and risks associated with the use of the script. In exchange for using the script, you agree not to hold dgtrd TradingView user liable for any possible claim for damages arising from any decision you make based on use of the script
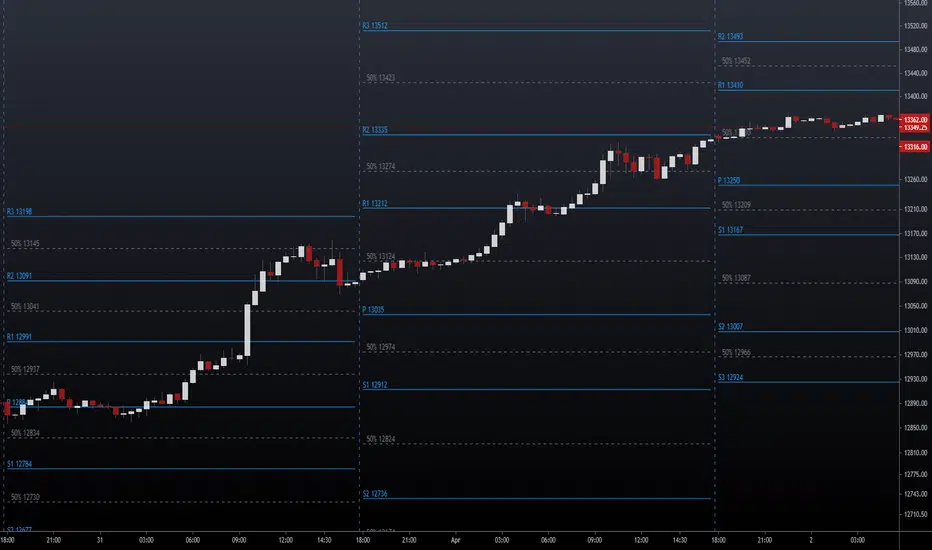
NSDT Pivot Points PlusThis script uses the Traditional Pivot Points but includes the price levels and the 50% line between levels. We added the ability to change the line color of the major levels and the minor levels independently, for better clarity. Added alerts - used code from QuantNomad.
Pivot Points description from TradingView default indicator:
Pivot Point analysis is a technique of determining key levels that price may react to. Pivot points tend to function as support or resistance and can be turning points. This technique is commonly used by day traders, though the concepts are valid on various timeframes. There are several methods of identifying the exact points. Common types of pivot points are Traditional, Fibonacci, Woodie, Classic, Camarilla and DM and each type has its own calculation method.
Most use a variation of significant prices such as established highs, lows, opening and closing prices and then apply a calculation to determine these points. They all calculate additional support and resistance levels alongside the pivot points. They can be used to determine when to enter or exit trades or to determine the range of a market. Conservative traders look for additional confirmation before entering a trade. Whether pivot points are used alone or in combination with other techniques, they are a useful tool in a technical trader's toolbox.
Standard Fibonacci Pivot PointsPivot points are probably one of the greatest leading indicator for any and all asset classes, used since the advent of the public/private markets, granted it uses previous days data, it is an awesome leading indicator that produces guide rails for future trading periods. This project was born out of the necessity to have the additional fibonacci levels and to have pivot point for the current day to appear for pre and post market hours. The latter inspiration was later added by the TV team at my request and it was greatly appreciated.
This tool can be handy in any trading process from short-long term trades or timeframes, multiple timeframe analysis, trend trades, swing trades, position trades, and momentum trades.
The tool can also be a great addition to any part of your processes especially if you are looking for instances of confluences on higher or lower timeframes.
"Pivot points are a technical indicator that is used to determine the levels at which price may face support or resistance. The Pivot Points indicator consists of a pivot point (PP) level and several support (S) and resistance (R) levels." - TV Help Center
We have found the Fibonacci levels to be more respected/self-fulfilling than other versions of the pivot point indicator. (Find example in code notes below)
Note: (If you all love the flexibility of this code then we will be happy to replicate it using the other pivot point formulas. Just drop us a private message.)
TV has a great default version of the indicator but it lacks dynamism . (The compile time is relatively similar to the default indicator also)
Some of the features that we loved from the default we have been able to carry over after many many difficult iterations :
-- Showing historical pivots (probably the most difficult feature add up until some recent pine script features additions)
-- Automatic pivot timeframe creation...meaning for appropriate pivot lines populate for daily, weekly, monthly, and yearly timeframe periods
-- Labels that do not lay on top of the lines as labels normally do
By dynamism we are referring to the following abilities/features:
-- Ability for the next day's pivot to populate before the next market open (pivots populate when the market time changes over to the next day)
-- Ability to turn on/off every support and/or resistance line...sometime you just want to see the resistance levels if it is an up kind of day
-- Ability to have the support/resistance lines to be different colors
-- Ability to change what the pivot point itself if based on
-- The additional fibonacci ratios
Default Ratios + Matching Labels:
38.2% - S1/R1
61.8% - S2/R2
100% - S3/R3
Additional (Mid) Ratios + Matching Labels:
23.6% - SA/RA
50% - SB/RB
76.4% - SC/RC
127.2% - S4/R4
141.4% - S5/R5
161.8% - S6/R6
200% - S7/R7
Code Notes and Insight:
pivot point = (high + low + close) / 3
support lines = pivot - (prevhigh - prevlow) * 0.236
resistance lines = pivot - (prevhigh - prevlow) * 0.236
The high, low and close is based on the indicator resolution which by default is set too auto due to smaller timeframes not being able to pull back enough data at time when attempting to show multiple periods of pivots.
The increased resolution is determined by the following parameters (similar to the default TV indicator):
-- for intraday resolutions up to and including 15 min, DAY (1D) is used
-- for intraday resolutions 26m, 30m, and 1H then WEEK (1W) is used
-- for 3H, 4H and daily resolutions MONTH (1M) is used
-- for weekly and monthly resolutions, 12-MONTH (12M) is used
-- Tooltips have been added on the labels as subtle references in case you forget what a specific level's formula is
-- Remember to set your changes as default in the input menu after changing the colors of lines or default populated levels
-- Number of pivots back has been limited to 20 given that indicators are only able to populate 500 lines and labels but 20 historical periods should be more than enough for sufficient use
---------
Past performance is not indicative of future performance.
Please PM us to obtain access to any of our indicators.
Please PM or comment if you run into any bugs within your use or any questions about functionality.

Pivot Points AlgoThis is a Pivot Points Algo (PPA).
PPA uses an adaptive pivot algorithm that adapts to different market situations based on various factors.
PPA also includes depth filtering to make it more precise at its signal decision.
======= Signal Types ======
Main Signal of BUY and SELL shown by buy/sell labels.
Mini Signals of BUY and SELL shown by buy/sell arrows and shows additional breakouts after the Main Signal occurred.
Optional reversal signals show a possible reversal in trend (small triangle).
======= Alerts =======
Main Signals alerts - Alerts when a main Buy or Sell is triggered (Shown as Labels).
Combo Alerts - Alerts when main or mini signals of Buy and Sell are triggered (Shown as Arrows).
======= Assets and Time frames =======
Can be used on various assets, stocks, forex, crypto and works great for day trading as well as swing trading and long term investing.
PPA is designed to adjust to any time frame!
======= General info =======
The purpose of this indicator is to signal possible breakouts with a high rate of success.
PPA has been extensively tested and fine tuned to provide traders and investors with a valuable tool for timing long and short entries. However, no system is 100% perfect, and it is good practice to have a plan in place and use stop losses or other tools to mitigate unforeseen risk.
Also, note, I don't hide what PPA is doing as opposed to some other commercial indicators on the market. You can view pivot lines and pivot bands and so on.
The magic is the inner system itself which works for you to pinpoint the best entrance possible, I recommend confirming your own methods to make sure you want to take the trade.
To subscribe to Pivot Points Algo service see “Author's instructions” below.
For any question you can PM me.
Happy and profitable trading!
