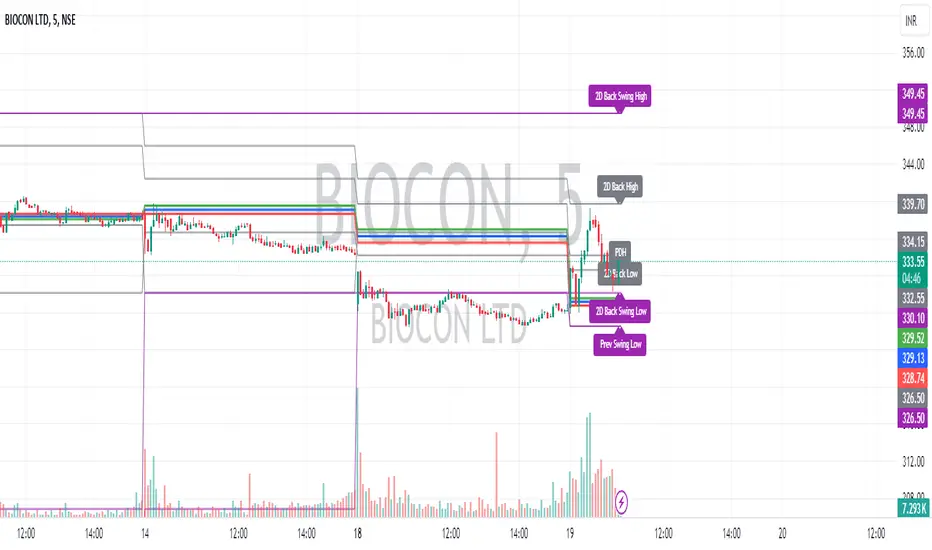
Intraday CPR with Previous Highs and Lows and Swing Highs/LowsThis Pine Script indicator plots the Central Pivot Range (CPR) for the current trading day along with previous day's high (PDH), low (PDL), and swing high/low (Swing H/L) values. It also includes the high, low, and swing high/low values from two days back for reference.
Key Features:
Central Pivot Range (CPR):
Pivot Point (PP): The central pivot point.
Bottom Central Pivot (BC): The lower boundary of the CPR.
Top Central Pivot (TC): The upper boundary of the CPR.
The area between the BC and TC is shaded for better visualization.
Previous Day and Two Days Back Values:
Previous Day High (PDH) and Low (PDL): Plots the high and low of the previous trading day.
Two Days Back High and Low: Plots the high and low from two trading days ago.
Previous Day Swing High/Low: The highest high and lowest low from a specified period (swing period) of the previous trading day.
Two Days Back Swing High/Low: The highest high and lowest low from a specified period (swing period) of two trading days ago.
Pivotlevels
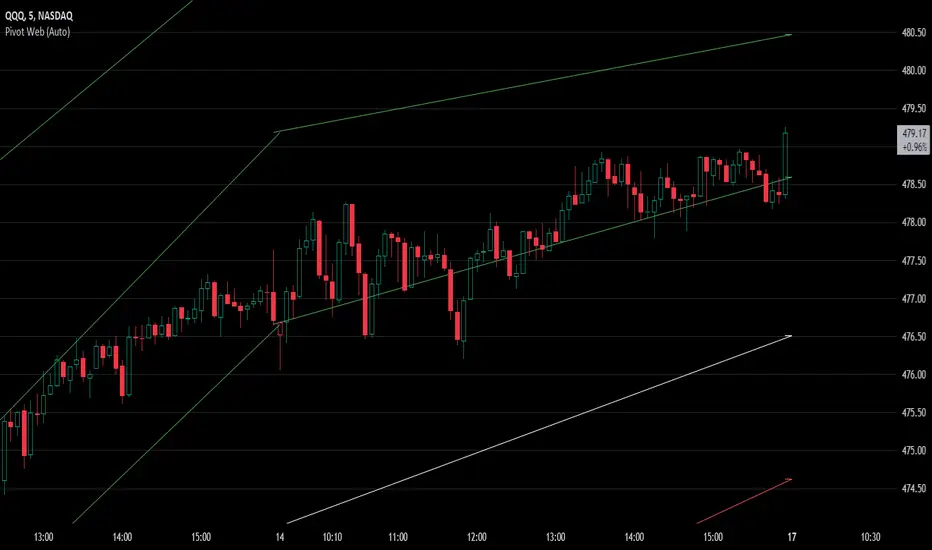
Pivot WebThe Pivot Web is a prototype with its base derived from TradingView's standard pivot point indicator plus inspiration from LuxAlgo's trendline work alongside my own observations/experiences.
The theory is that there's legitimacy, from a technical standpoint, pivot point calculations are an adequate gauge of momentum and sentiment because the same math was used under pressure by floor traders themselves. That calculation is centered on the average of high, low, and closing prices. This indicator creates trendlines connecting the last pivot, support, and resistance levels to the current ones. A dynamic visual cue could make it easier to assess if the price will continue or reverse the current trajectory. This method also shows us an excellent visual for volatility.
Key Takeaways:
This indicator draws new dynamic trendlines.
These new trendlines connect the past and present pivot point levels based on the timeframe you select.
Shorter timeframes = More trendlines
Price adherence to the path of these lines may offer insight for trading.
Lastly, note the first set of data in each new timeframe displays the current original pivot point levels along with the trendlines attached to their ending point. Most of the time this indicator leaves room by briefly highlighting the original static levels with all levels also being optional displays. Also note that a more stable asset may not require the outermost support and resistance levels. Like most time series analysis tools, the Pivot Web requires current data to function properly.
"Nature is pleased with simplicity, and nature is no dummy."
Stop Hunts [MK]Liquidity rests above/below previous highs and lows because these are the areas where traders are most likely to leave their orders/stop losses. The market can tap into this liquidity source by going beyond the previous highs and lows, this liquidity can then be used to reverse the market in the opposite direction.
As traders we may want to know if price will continue beyond previous highs and lows, or reverse the market. If price looks to be reversing after tapping into liquidity, this can be a good area to enter a trade. The same area can be used as a take profit level also.
The indicator identifies previous high/lows in two ways:
1. previous high/lows using 'PIVOT POINTS'. Pivots are easy to spot and are obvious within a price trend. Also called 'higher highs", "lower lows" etc. The number of candles required to form the pivot point can be adjusted in the script settings.
see below example of pivot point and stop hunt:
www.tradingview.com
see how price reversed upwards after stop hunt on pivot point above.
2. previous candle high/lows. A previous candles high and low are also good areas of liquidity.
see below example of previous candle stop hunt:
see how price reversed upwards after stop hunt on previous candle low above.
Personally, I use the pivot point stop hunts on lower timeframes and previous candle stop hunts on higher timeframes. However users can adjust on which timeframes to show the indicator depending on their own trading style.
As ever all items within 'settings' are customizable.
The indicator is by no means a 'trading strategy' and users should be fully aware of the stop hunt concept and have conducted extensive back-testing before using with 'live' accounts.
The indicator may also serve as a 'teaching aid' to new students and as a reminder to more experienced traders.

Pivot Point Calculator [JP&Dia]English User Guide
Script Name: Pivot Point Calculator
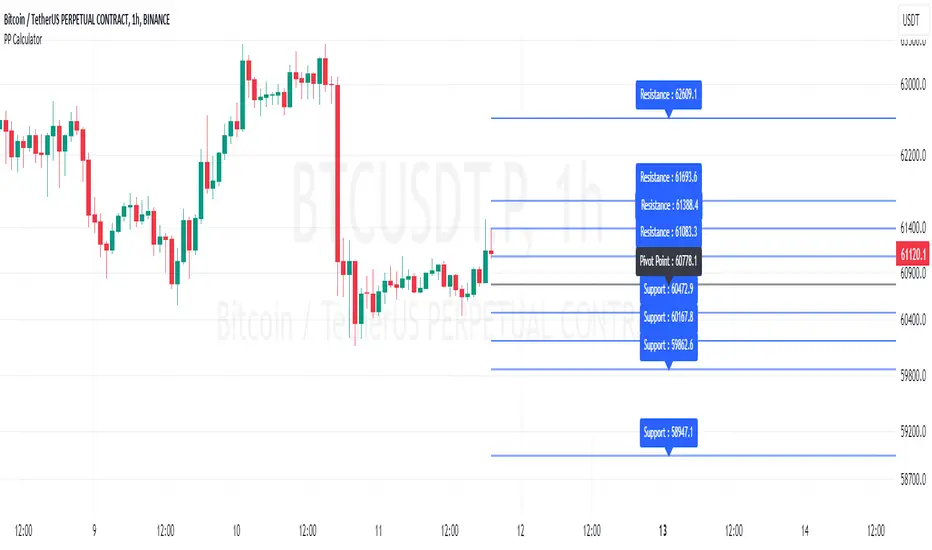
What Does This Script Do? This script calculates classic and Camarilla pivot points used in financial markets. Pivot points are used to identify key support and resistance levels, and this script helps traders better understand market movements.
How to Use It?
Add the script to your charts on TradingView.
Enter your desired time frame in the “Enter Time Frame” field (e.g., M, W, D).
Choose either or both “Classic Pivot” and “Camarilla Pivot” options to display them.
The script will automatically calculate the pivot points and display them on the chart.
Why Is This Script Unique? This script combines both classic and Camarilla pivot calculations, allowing users to easily utilize both pivot styles through a single script.
How Can People Benefit? Traders can use this script to identify potential buy-sell points and market trends. They can also conduct their market analyses more efficiently and effectively.
Script Adı: Pivot Noktası Hesaplayıcı
Script Ne İşe Yarar? Bu script, finansal piyasalarda kullanılan klasik ve Camarilla pivot noktalarını hesaplar. Pivot noktaları, önemli destek ve direnç seviyelerini belirlemek için kullanılır ve bu script, yatırımcıların piyasa hareketlerini daha iyi anlamalarına yardımcı olur.
Nasıl Kullanılır?
Scripti TradingView’deki grafiklerinize ekleyin.
“Zaman Dilimi Girin” alanına istediğiniz zaman dilimini girin (Örneğin: M, W, D).
“Classic Pivot” ve “Camarilla Pivot” seçeneklerinden birini veya her ikisini de seçerek gösterilmesini sağlayabilirsiniz.
Script otomatik olarak pivot noktalarını hesaplayacak ve grafik üzerinde gösterecektir.
Neden Özgü Bir Script? Bu script, hem klasik hem de Camarilla pivot hesaplamalarını birleştirir ve kullanıcıların her iki pivot stilini de tek bir script üzerinden kolayca kullanmalarını sağlar.
İnsanlar Nasıl Faydalanabilir? Yatırımcılar, bu scripti kullanarak potansiyel alım-satım noktalarını ve piyasa trendlerini belirleyebilirler. Ayrıca, piyasa analizlerini daha verimli ve etkili bir şekilde yapabilirler.
Fib Pivot Points HLThis TradingView indicator allows users to select a specific timeframe (TF) and then analyzes the high, low, and closing prices from the past period within that TF to calculate a central pivot point. The pivot point is determined using the formula (High + Close + Low) / 3, providing a key level around which the market is expected to pivot or change direction.
In addition to the central pivot point, the indicator enhances its utility by incorporating Fibonacci levels. These levels are calculated based on the range from the low to the high of the selected timeframe. For instance, a Fibonacci level like R0.38 would be calculated by adding 38% of the high-low range to the pivot point, giving traders potential resistance levels above the pivot.
Key features of this indicator include:
Timeframe Selection: Users can choose their desired timeframe, such as weekly, daily, etc., for analysis.
Pivot Point Calculation: The indicator calculates the pivot point based on the previous period's high, low, and closing prices within the selected timeframe.
Fibonacci Levels: Adds Fibonacci retracement levels to the pivot point, offering traders additional layers of potential support and resistance based on the natural Fibonacci sequence.
This indicator is particularly useful for traders looking to identify potential turning points in the market and key levels of support and resistance based on historical price action and the Fibonacci sequence, which is widely regarded for its ability to predict market movements.
Example:
Suppose you're analyzing the EUR/USD currency pair using this indicator with a weekly timeframe setting. The previous week's price action showed a high of 1.2100, a low of 1.1900, and the week closed at 1.2000.
Using the formula ( High + Close + Low ) / 3 (High+Close+Low)/3, the pivot point would be calculated as ( 1.2100 + 1.2000 + 1.1900 ) / 3 = 1.2000. Thus, the central pivot point for the current week is at 1.2000.
The range from the low to the high is 1.2100 − 1.1900 = 0.0200 1.2100−1.1900=0.0200.
To calculate a specific Fibonacci level, such as R0.38, you would add 38% of the high-low range to the pivot point: 1.2000 + ( 0.0200 ∗ 0.38 ) = 1.2076 1.2000+(0.0200∗0.38)=1.2076. Thus, the R0.38 Fibonacci resistance level is at 1.2076.
Similarly, you can calculate other Fibonacci levels such as S0.38 (Support level at 38% retracement) by subtracting 38% of the high-low range from the pivot point.
Traders can use the pivot point as a reference for the market's directional bias: prices above the pivot point suggest bullish sentiment, while prices below indicate bearish sentiment. The Fibonacci levels act as potential stepping stones for price movements, offering strategic points for entry, exit, or placing stop-loss orders.

Pivot Points [MisterMoTA]The Pivot Points indicator by MisterMoTA allow users to get pivots points calculated from last candle high, low and close on any timeframe from 1 minute to weekly.
This will help users that are trading ins small timeframes to see the pivots that are near their timeframes and not only daily timeframe.
Here is an example on the chart from nex image the timeframe is set to 1 minute and pivot points displayed are at 15 minutes :
The users have control on pivots colors, pivot labels colors, text color from labels, decimal numbers displayed in the labels and style of the pivots lines.
Please follow me for other script like this one.
Kind regards,
MisterMoTA

Bitcoin as Heikin Ashi Candles with Pivot PointsI use this Indicator to show me where Bitcoin is heading.
Most pine programmers are not aware of the possibility to combine Heikin Ashi Candles with Pivot Points that easy.
You can switch between Traditional, Fibonacci, Woodie, Classic, DM, and Camarilla as usual.
When on a Intraday Chart it will automaticly calculate daily Pivots for Haikin Ashi candles.
On the daily Chart it will calculate weekly Pivots, and when switching to monthly candles it will calculate Pivots for one year.
There is also an option where you can deactivate all support and resistance lines, except for today. Meaning you will see the Central Pivot Point on all previous days only.
This is a lagging indicator!
When you can see Altcoin correlation with BTC then both might get pretty strong leading indicators.
I am pleased to hear some advice/wishes to improve this script.
It is still in the beginning and some updates will follow, I promise.
Happy Trading!

Multi-Timeframe High Low (@JP7FX)Multi-Timeframe High Low Levels (@JP7FX)
This Price Action indicator displays high and low levels from a selected timeframe on your current chart.
These levels COULD represent areas of potential liquidity, providing key price points where traders can target entries, reversals, or continuation trades.
Key Features:
Display high and low levels from a selected timeframe.
Customize line width, colors for high and low levels, and label text color.
Enable or disable the display of high levels, low levels, and labels.
Receive alerts when the price takes out high or low levels.
How to use:
It is important to note that using this indicator on it's own is not advisable. Instead, it should be combined with other tools and analysis for a more comprehensive trading strategy.
Possibly look to use my MTF Supply and Demand Indicator to look for zones to trade from at these levels?
If the price breaks above a high level, you might consider entering a long position, with the expectation that the price will continue to rise. Conversely, if the price breaks below a low level, you may think about entering a short position, anticipating further downward movement.
On the other hand, you can also use high or low levels to look for reversal trades, as these areas can represent attractive liquidity zones.
By identifying these key price points, you could take advantage of potential market reversals and capitalise on new trading opportunities.
Always remember to use this indicator in conjunction with other technical analysis tools for the best results.
Additionally, you can enable alerts to notify you when the price takes out high or low levels, helping you stay informed about significant price movements.
This indicator could be a valuable tool for traders looking to identify key price points for potential trading opportunities.
As always with the markets, Trade Safe :)

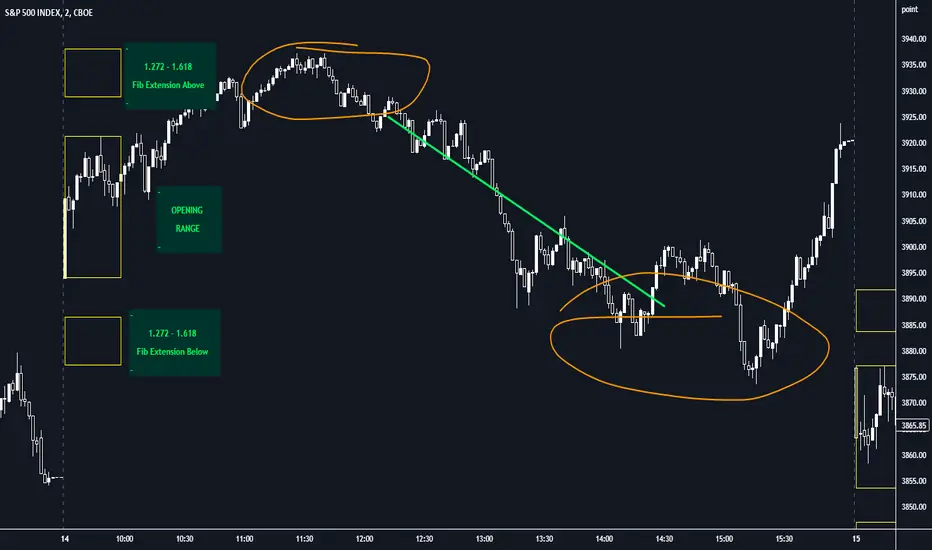
Opening Range with FibsThe indicator uses a time range and another instrument for time reference, so that it works in the time zone you care about. I have set the default to SPX500USD since it is in EST ( SPX , ES and many futures are on Chicago time and opening range gets confused). You can change the reference instrument in the settings.
You can also change the multipliers and use other values instead of 1.272 and 1.618 for Fib extensions.
TradingView has a limit as to how many objects an indicator can create so if you want to go back further for visual backtesting - use the replay tool - it will be able to draw up to the time you selected within its limits.
Let me know if you need anything else...
Happy Trading!
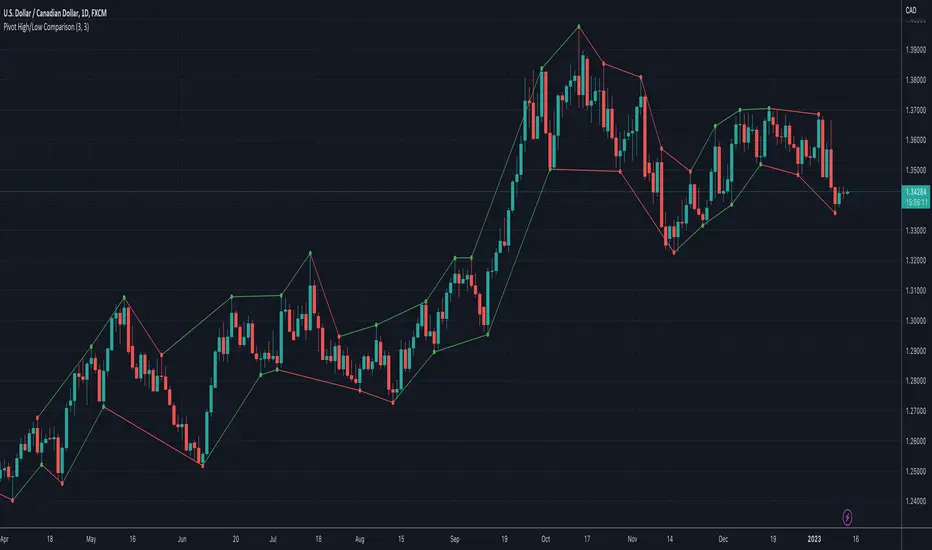
Pivot High/Low ComparisonThis script will show you at a glance the following trends:
Higher Highs (Green line on top)
Lower Highs (Red line on top)
Higher Lows (Green line on bottom)
Lower Lows (Red line on bottom)
It utilizes the Pivot High and Pivot Low functions to determine if the previous pivot was higher or lower than the current pivot .
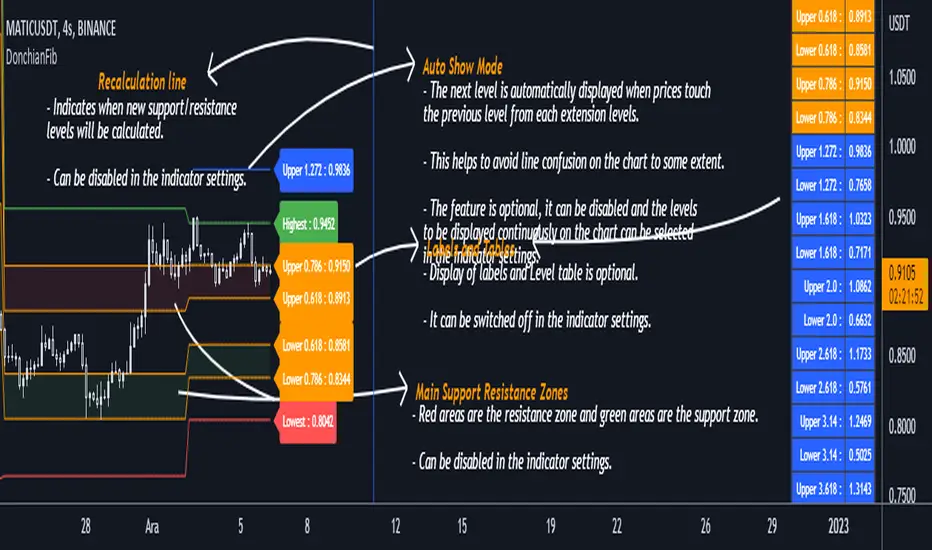
DonchianFib[Akcay]How does it work?
- The indicator detects the highest and lowest price level in the last x periods every time prices advance by x periods.
- From these values, retracement (0.618, 0.786) and expansion levels (1.272, 1.618, 2, 2.618, 3.14, 3.618, 4.236) are obtained.
- Since the symmetrical counterpart of the retracement levels is used, there are two of each of the 0.618 and 0.786 lines, for a total of four.
How can it be used?
- It can be used for step buying.
- It can be used for step selling.
- Can be used to set a profit target.
- Can be used to set a stop target.
- This indicator can be used in the same way as Pivot levels can be used. You can think of this indicator like the Pivot Points Standard indicator, where you set the period more flexibly.
Which indicators can it be combined with?
- I don't think there are any limitations, but I think it is compatible with trend detection indicators, trend detection with DonchianFib, and stepped buy/sell with limit orders.
- If you want to enter a position with mismatch signals, you can wait for the DonchianFib levels to break.
- Its use is limited by your imagination :)
Where does the name come from?
- As the name suggests, Donchian Channels. I was inspired by Donchian Channels when developing the indicator. Donchian channels show the highs and lows of prices over the last x number of periods. DonchianFib does this once for every x periods and uses the fibonacci levels to create upper and intermediate levels.
Note : I don't know if such an indicator has been done before or not. If it has been done, I haven't seen it in tradingview.
Çalışma mantığı nedir ?
- Gösterge, fiyatlar her x periyot kadar ilerlediğinde son x periyot içerisindeki en yüksek ve en düşük fiyat seviyesini tespit eder.
- Bu değerler üzerinden geri çekilme (0.618, 0.786) ve genişleme seviyeleri (1.272, 1.618, 2, 2.618, 3.14, 3.618, 4.236) elde edilir.
- Geri çekilme seviyelerinin simetrik karşılığı kullanıldığından 0.618 ve 0.786 çizgilerinden her birinden iki adet olmak üzere toplamda dört adet bulunur.
Nasıl kullanılabilir ?
- Kademeli alım yapmak için kullanılabilir.
- Kademeli satım yapmak için kullanılabilir.
- Kâr hedefi belirlemek için kullanılabilir.
- Stop hedefi belirlemek için kullanılabilir.
- Pivot seviyelerinden nasıl faydalanılıyorsa bu göstergeden de aynı şekilde faydalanılabilir. Bu göstergeyi, periyodunu kendinizin daha esnek bir şekilde belirlediğiniz Pivot Noktalar Standartı göstergesi gibi düşünebilirsiniz.
Hangi göstergelerle kombine edilebilir ?
- Bunun için herhangi sınırlama yapmak doğru değil ancak trend tespit etmeye çalışan göstergelerle uyumlu olduğunu düşünüyorum. Bu göstergeler ile trend tespiti yapıp DonchianFib ile alım/satım yerleri belirlenebilir ve limit emirleri ile kademeli alım/satım yapılabilir.
- Uyuşmazlık sinyalleri ile pozisyona girilmek isteniliyorsa DonchianFib seviyelerinin kırılması beklenebilir.
- Kullanımı sizin hayal gücünüz ile sınırlıdır :)
Adı nereden geliyor ?
- Adından da anlaşılacağı üzere Donchian Kanallarından. Göstergeyi geliştirirken Donchian Kanallarından ilham aldım. Donchian kanalları fiyatların son x periyot içerisindeki en yüksek ve en düşük seviyelerini grafikte gösteriyor. DonchianFib ise bunu her x periyot için bir defa yapıp, fibonacci seviyelerini de kullanarak üst ve ara seviyeler oluşturuyor.
Not : Daha önce böyle bir göstergenin yapılıp yapılmadığını bilmiyorum. Yapıldı ise ben tradingview'da görmedim.
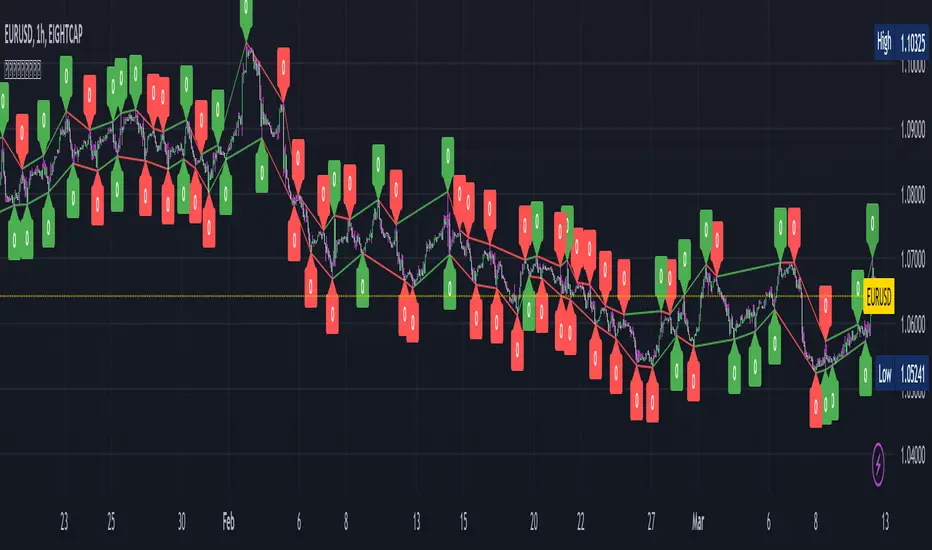
Pivot Points with Slopes - By Necromancer█ OVERVIEW
- This script draws array-based Pivot Points with the calculated slope on the next connecting point.
- The script works left to right, but could be be modified.
- Looks best with Label-Style on Diamonds, without Slope Text drawn.
█ Thank You!
- Many more to come which will utilize these fundamentals!
🅝🅔🅒🅡🅞🅜🅐🅝🅒🅔🅡
Volume Profile, Pivot Anchored by DGTVolume Profile (also known as Price by Volume ) is an charting study that displays trading activity over a specified time period at specific price levels. It is plotted as a horizontal histogram on the finacial isntrumnet's chart that highlights the trader's interest at specific price levels. Specified time period with Pivots Anchored Volume Profile is determined by the Pivot Levels, where the Pivot Points High Low indicator is used and presented with this Custom indicator
Finally, Volume Weighted Colored Bars indicator is presneted with the study
Different perspective of Volume Profile applications;
Anchored to Session, Week, Month etc : Anchored-Volume-Profile
Custom Range, Interactive : Volume-Profile-Custom-Range
Fixed Range with Volume Indicator : Volume-Profile-Fixed-Range
Combined with Support and Resistance Indicator : Price-Action-Support-Resistance and Volume-Profile
Combined with Supply and Demand Zones, Interactive : Supply-Demand-and-Equilibrium-Zones
Disclaimer : Trading success is all about following your trading strategy and the indicators should fit within your trading strategy, and not to be traded upon solely
The script is for informational and educational purposes only. Use of the script does not constitutes professional and/or financial advice. You alone the sole responsibility of evaluating the script output and risks associated with the use of the script. In exchange for using the script, you agree not to hold dgtrd TradingView user liable for any possible claim for damages arising from any decision you make based on use of the script

Fibonacci Pivot PointsI have included the main support and resistance pivot point levels for the Fibonacci Pivot Points. I changed the bar colors to reflect buy and sell points so if a bar is green then that means to buy it and if it is red then sell it
Let me know if you would like to see me do any other indicators!

Pivot Points & Midlines with color selectorAdapted from Pinescript Manual's "Pivot Points Standard". Added extra levels and midlines as well as user inputs for color and a "show labels" on/off switch.
So this will show the Pivot level, the resulting levels R1,R2,R3,S1,S2,S3 and the midpoint lines between these.
User can choose the Higher timeframe period from which to calculate these pivot levels, as per the original script.
I like to add two of these to a chart, one for daily and one for weekly pivot levels.
If you don't need any particular level, just comment out the appropriate lines (one from each of the second last and third last blocks in the script).

BEST Pivots CloudHello traders,
This script is an adaption of an FXCM indicator called Pivots Cloud
Takes in input two timeframes, build the pivots based on them and fill the space between those pivots
Should be non-repainting
Best
Dave
