Pivot Reversal AlertsPivot Reversal Study script, for generating Alerts and visual plotting of Pivot Reversal lines on the charts. Use a Strategy script (like Figs & Dates), for backtesting different settings on various time frames and charts.
Pivothigh

Smoothed Pivot Reversal Alerts [QuantNomad]This is study with alerts for my "Smoothed Pivot Reversal Strategy". Strategy script is open to the public so you can use it freely.
When creating alerts - choose "Once Per Bar Close"
It's a pro indicator, you can have access to it for a small fee. Link to my PRO indicators you can find in my signature.

PRP - Pivot Reversal + PSAR Alerts [QuantNomad]This is study with alerts for my "PRP - Pivot Reversal + PSAR Strategy".
When creating alerts - choose "Once Per Bar Close"
It's a pro indicator, you can have access to it for a small fee. Link to my PRO indicators you can find in my signature.

Fibonacci Pivot PointsI have included the main support and resistance pivot point levels for the Fibonacci Pivot Points. I changed the bar colors to reflect buy and sell points so if a bar is green then that means to buy it and if it is red then sell it
Let me know if you would like to see me do any other indicators!

CPRFibonacciPivots By EquityDuraiThe Central Pivot Range (CPR) is one of the most versatile price-based indicators available to traders. ... At any given time, the range can be support or resistance, it can forecast trending or sideways price behavior, dictate the day's direction, or serve as an integral part of a trend.
Keep in mind that depending on the market’s behavior, the formula for TC may in fact create the level for BC, and vice versa. I always refer to the highest level as TC, and the lowest level as BC, regardless of which formula led to the level’s creation.

TFi Pivot Reversal StudyThe Pivot Reversal Study script uses pivot points to create a support and resistance level; based on this levels the script creates virtual stop-market orders to catch the trend if the price is crossing the pivot lines.
A configurable trailing-stop and stop-loss is being used to exit an open position.
The entry and exit points are visualized in the chart via green arrows and crosses; the position follows the exact behavior of the strategy script.
The study also creates alerts, which follow the exact position of the entry/exit markers. Via the input parameter "Alert Message Type" it is possible to select a predefined alertcondition message; right now the script supports a generic default message and a trading setup for Alertatron.
How to use
The study works with all timeframes; the current chart setting is using a 15min timeframe. The strategy enters about 10 trades per day, depending on the used settings.
I'm also providing a "strategy" version of this study, which can be used to backtest the strategy.
How to access
This strategy is a "Invite Only" script. You can can subscribe or purchase the strategy ; please use the link below or send me a message via Tradingview to obtain access to the strategy and study script.
For enabling the script in your Tradingview chart window, click on "Indicators" and select "Invite-Only Scripts".
Full list of alerts:
'Enter Long' ... Enter long position
'Enter Short' ... Enter short position
'Exit Long PT' ... Exit long position - profit-target reached
'Exit Short PT' ... Exit short position - profit-target reached
'Exit Long SL' ... Exit long position - stop-loss
'Exit Short SL' ... Exit short position - stop-loss
Full list of parameters:
"Pivot Left Bars" ... Number of bars on the left of the pivot point - used for pivot/peak detection
"Pivot Right Bars" ... Number of bars on the right of the pivot point - used for pivot/peak detection
"Entry Offset " ... Entry price offset after crossing pivot line (in %)
"Trailing Activation Level " ... Trailing stop activation level above/below average price (in %)
"Trailing Offset " ... Trailing stop price (in %)
"Stop Loss " ... Absolute stop-loss (in %)
"Alert Message Type" ... Alert message type: generic or Alertatron
"Backtest ..." ... Backtest timeframe; area outside this timeframe will be grayed out
I'm looking forward to any feedback, reviews and change requests!

BEST Pivots CloudHello traders,
This script is an adaption of an FXCM indicator called Pivots Cloud
Takes in input two timeframes, build the pivots based on them and fill the space between those pivots
Should be non-repainting
Best
Dave

The Multi-day Central Pivot RangeThe indicator is a Multi-day CPR.
It shows CPR range as per yesterday's HLC and also CPR range for last n number of trading sessions.
For example: If you mention the value as two in Multi-day CPR (blue color) then it calculates the CPR using HLC of the last two trading sessions.
Also, the daily CPR is designed in such a way to highlight Virgin CPR (purple color) separately from the normal CPR(fuchsia color) .

Pivot Points HIgh LowRemake of the integrated Pivot Points indicator
With higher resolution you should lower the indicator values to get a good result

QuantNomad - Significant Pivot Reversal Strategy AlertsAlerts for "Significant Pivot Reversal Strategy":
As one of the ways to filter out insignificant levels I decided to check that pivot point is not above/below neighbors, but check that it's above/below at least by a certain amount.
I use ATR, so in params, you can set length of ATR and also ATR multiplier. The new level will be calculated only if PP will be above/below neighbors by atr * atr_mult.
It seems this approach might help in some cases.

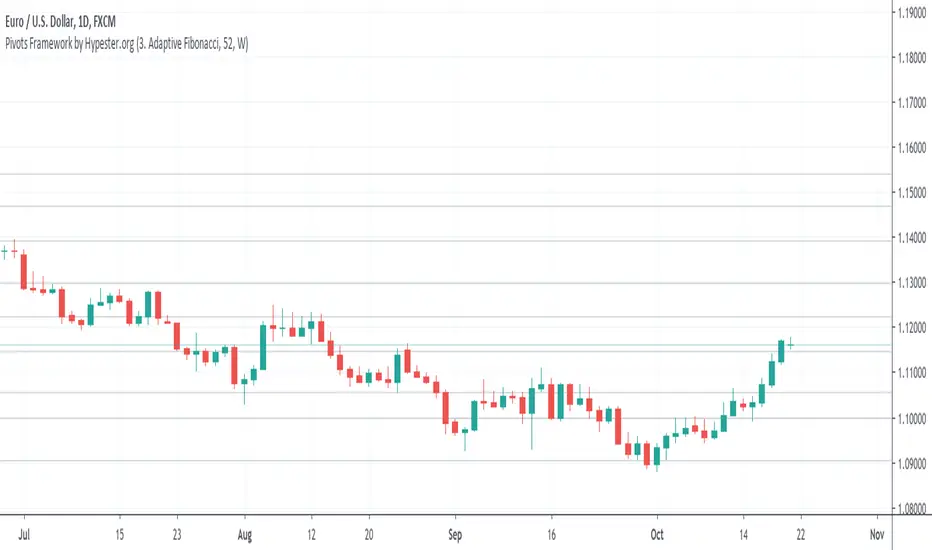
Pivots Framework by HypesterThis is the first release of the basic pivot framework with the three most used ones by our Alpha Community.
You can easily switch between modes, adjust the lookback period, and it works multi-resolution.
Right now, we have:
BB Fibo
Murrey's Channels
Adaptive Fibonacci
The next release will be ATR based pivot formula.
Pivot Point Reversal + RSI AlertsThese are alerts for previously published strategy:
This strategy joins the Pivot Reversal strategy with the RSI indicator.
We check RSI level at the pivot point level and only if RSI condition is satisfied we update levels for stop orders.


Function : Pivots High and Low WARNING: The toil of this script is not mine . In order to avoid disrespect for work, I deleted some extensions only pure pivots , that is, only the information this script needed. I liked the fact that high and low pivots were in one function. I found this command by chance on stackoverflow. I don't know the authors and the nicknames because they are the stackoverflow nicknames. I hope it will help your adaptive periods. Finally, the length of the pivot must be at least 3 to be available.If the author reaches me, I will give his/her Tradingview name as a reference.

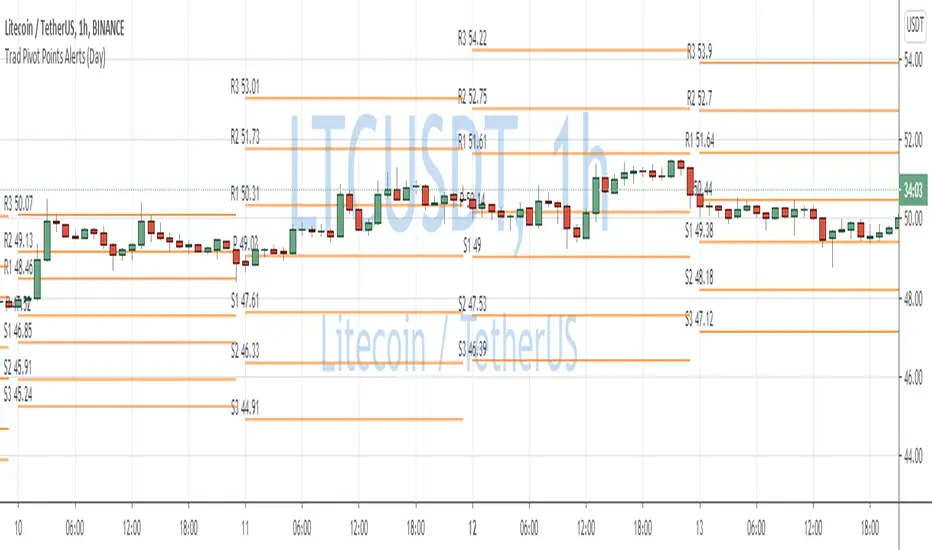
Traditional Pivot Points AlertsCreated a script for alerts on Traditional Pivot Points.
You will be able to create separate alerts for every level or create one for price crossing any level.
Because of some TradingView limitations, alerts won't be fired for the first bar of the session. Will try to solve that in the new versions.
In the script used new v4 plotting features, so will be able to plot levels and labels nicely. Unfortunately, there is a limit on the number of consecutive lines you can plot on the plot (around 50), so lines in the past will disappear.
You can enable/disable in params displaying level itself on the chart.
And remember:
Past performance does not guarantee future results.
Pivot LevelsThis indicator automatically plots 3 important "Pivot Levels" to watch when day trading.
This simple but effective tool plots out important levels from the prior trading day, and updates every day. I noticed that significant levels such as the close, the high, and the low from the prior day often serve as important support/resistance levels in the future.
The previous day high is displayed as the green line, the close is displayed as the white line, and the low is plotted as the red line.
Enjoy!

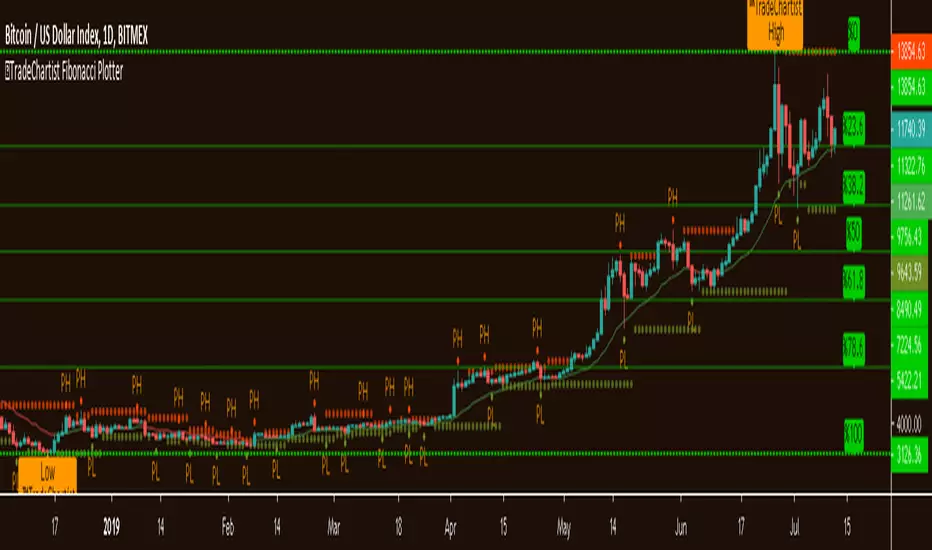
™TradeChartist Fibonacci Plotter™TradeChartist Fibonacci Plotter is a free and easy to use script to plot Fibonacci levels, 20 EMA (20 period Exponential Moving Average) and Pivot Highs/Lows on any time frame chart on any assets like Stocks, Forex, Commodities, Cryptocurrencies etc.
Fibonacci Levels can be plotted using the following options from settings.
1. Lookback type - Candles
Calculates the High and Low price of the user input number of Candles back (100 default) and plots Fibonacci Levels based on the calculated High and Low for the number of candles in the past from the current candle
2. Lookback type - Days
Calculates the High and Low price of the user input number of Days back (100 default) and plots Fibonacci Levels based on the calculated High and Low for the number of days in the past from the day of the current bar. The levels stay intact on any time frame as long as no new Highs or Lows are formed.
3. Manual Price Input
Plots Fibonacci Levels based on the user specified High and Low Price in the settings input screen. The levels stay intact on any time frame irrespective of new Highs or Lows being formed. Using this option and activating higher Fibonacci Levels like 1.272, 1.414 and 1.618 will enable the trader to keep the Levels intact and set alerts based on static higher levels for trade execution when price crosses beyond 100% retracement. On the other two lookback types, higher levels when activated will move dynamically based on new highs or lows being formed and price will never go beyond 100% level.
Example of Manual Price Input for GBP-USD on 1hr chart with higher levels is shown below:
Also the levels can be reversed by checking "Reverse Fibonacci Levels" from settings (Off by Default)
In addition to the Fibonacci plot, 20 period EMA (On by Default) and Pivot Highs/Lows (On by Default) are coded into the script as optional extras as both of these indicators will help make an informed decision in making trade decisions using Fibonacci Levels.
This is a free to use indicator. Give a thumbs up or leave a comment if you like the script
Check my 'Scripts' page to see other published scripts. Get in touch with me if you would like access to my invite-only scripts for a trial before deciding on a paid access for a period of your choice. Monthly, Quarterly, Half-Yearly and 1 Year access available on invite-only scripts along with 1hr Team Viewer intro session.
QuantNomad - Pivot Points AlertsVery simple scripts that will allow you to receive alerts for new Pivot Lows/Highs Points.
A solid arrow points to actual point low/high point, transparent - to the bar, you'll receive alerts for (Shifter by rightBars).
And remember:
Past performance does not guarantee future results.

(JS) Pivot Point RSILet me start by saying I really enjoyed putting this together - and also that it initially wasn't my idea, a friend of mine suggested it to me earlier today and I was intrigued by the concept.
So this is exactly what it sounds like - Pivot Points RSI.
I plan on adding the R4S4 and R5S5 in the future, though it only goes to 3 at the moment.
However I did include halfway points between existing pivots.
This RSI calculates prior closes + highs + lows based on the intraday (or week, or month, depending on chart resolution) indicator values, then takes that info and creates pivots on the RSI to plot potential RSI support and resistance. This is a pretty great concept and I plan on putting it to use in the future myself.
Includes 3 color schemes.

(JS) Multi-Time Frame Pivot Point DetectorSick of flipping through Pivot Point settings to change the time frame?
Or to hide certain ones because it screws up the auto-zoom?
Or are you just wishing there was something out there that was simple and effective?
Well - me too, that's why I made this automatic Pivot Points detector. Right now it only goes to S3/R3 (will expand in the future), but I made this specifically for my day trading template.
So this automatically detects the nearest Pivot Points above and below price - and it does Daily, Weekly, and Monthly, so there should be 6 lines showing at all times.
Speaking of which....
Blue - Daily
Green - Weekly
Red- Monthly
You'll also notice a really thick line will appear time to time - that thick line (on all time frames is the Pivot line, so obviously above it is the resistance lines and below it lies the support lines.
All you have to do is turn it on and you'll be completely aware of your surroundings across multiple time frames all at once, hope you like it!
Pivot Points, by @juanmirocks# Advantages over TV's indicator "Pivot Points Standard"
1. Show pivot lines for all history, which lets you gauge trading strategies throughout time
2. More sensible Default/Auto time frame; e.g. on intradays only and always the market values of yesterday's Day are used
3. The halves between the key levels are also shown, which it's useful for some trading strategies
4. Arguably out-of-the-box nicer interface
Pivot Points as an indicator is a traditional strategy to draw resistance and support levels. It's best suited for intraday trading: the pivot points and resulting key levels are calculated from yesterday's market values (H, L, C). More details in the script's source.
Pivot Points trading is suitable for any market, and best for intraday (e.g. 3 min).

Pivot High Low Pointsby using this script you can find Pivot High-Low Points. This script works like Tradingview pivothigh & pivotlow functions.
If you find my works useful, please consider a donation
BTC: 16XRqyS3Vgh1knAU1tCcruqhUrVm4QWWmR
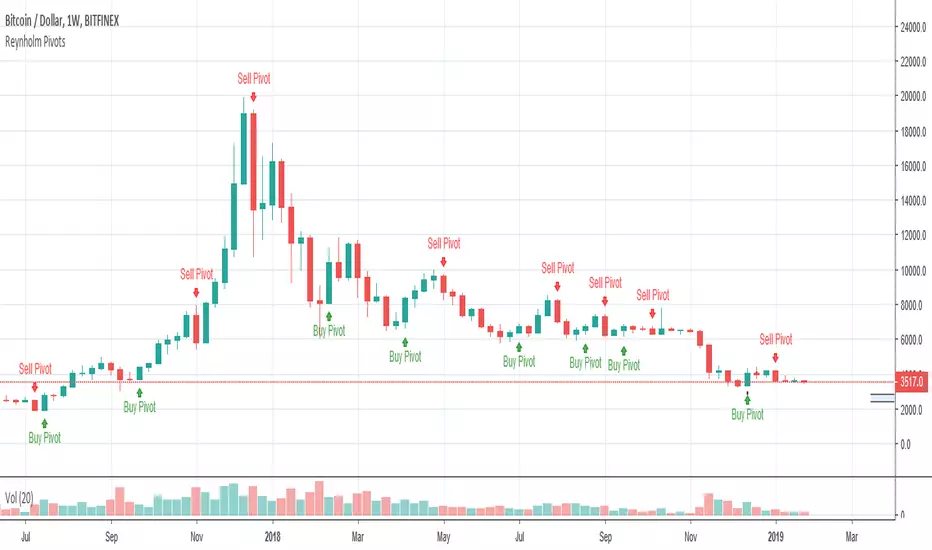
by LonesomeTheBlue

Reynholm PivotsReynholm Pivots are used by Forex, Futures and Stock Traders to flag possible reverse points. These pivots work best on higher times such as the monthly, weekly and daily time frames. I don't recommend using Reynholm Pivots on time frames lower than the daily chart. This pivots are not "buy" or" sell" signals and should not be used for this purpose, but used in conjunction with other technical and or fundamental analysis.