3rd High Low This is simple script to mark when higher high (or lower low) is made on continuously third day.
There likelihood of short term reversal next day. As usual, it is just likelihood and not certainty.
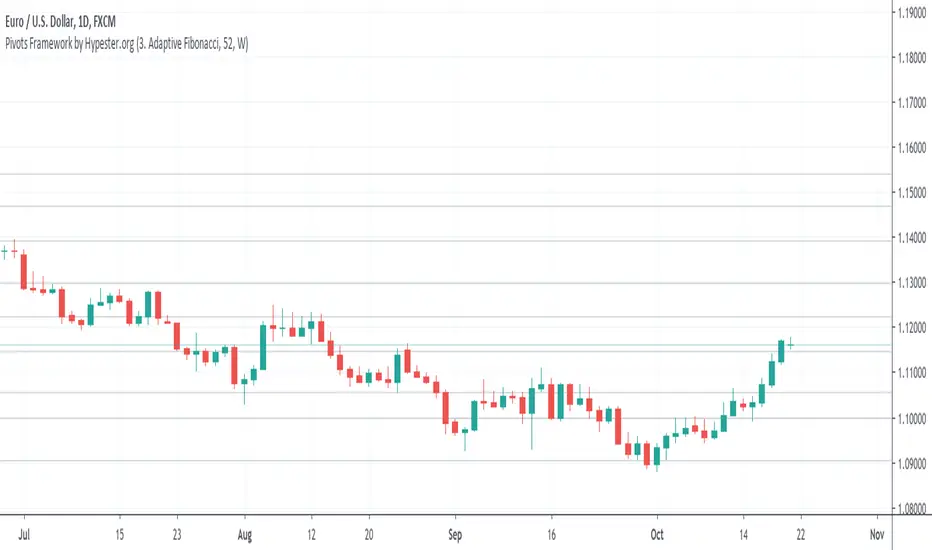
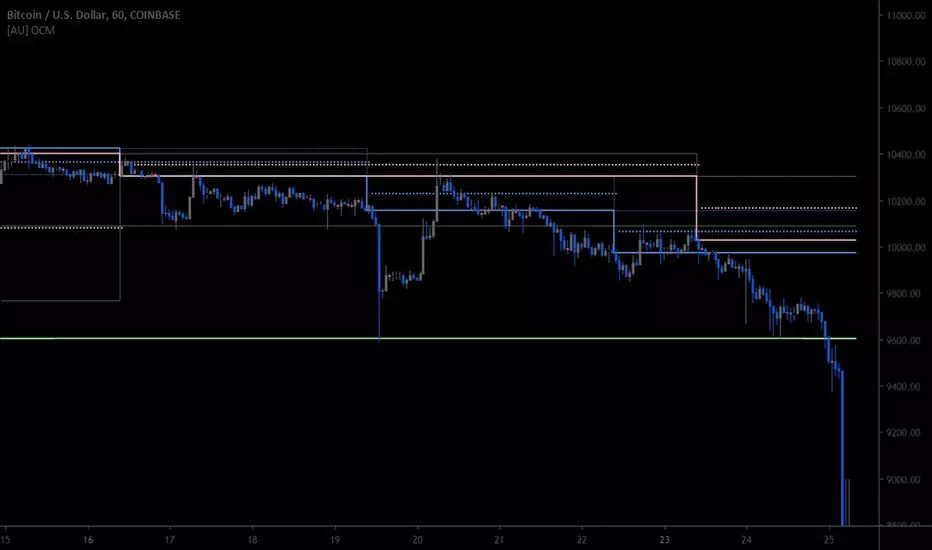
Pivot

Pivots Framework by HypesterThis is the first release of the basic pivot framework with the three most used ones by our Alpha Community.
You can easily switch between modes, adjust the lookback period, and it works multi-resolution.
Right now, we have:
BB Fibo
Murrey's Channels
Adaptive Fibonacci
The next release will be ATR based pivot formula.
Pivot Point Reversal + RSI AlertsThese are alerts for previously published strategy:
This strategy joins the Pivot Reversal strategy with the RSI indicator.
We check RSI level at the pivot point level and only if RSI condition is satisfied we update levels for stop orders.

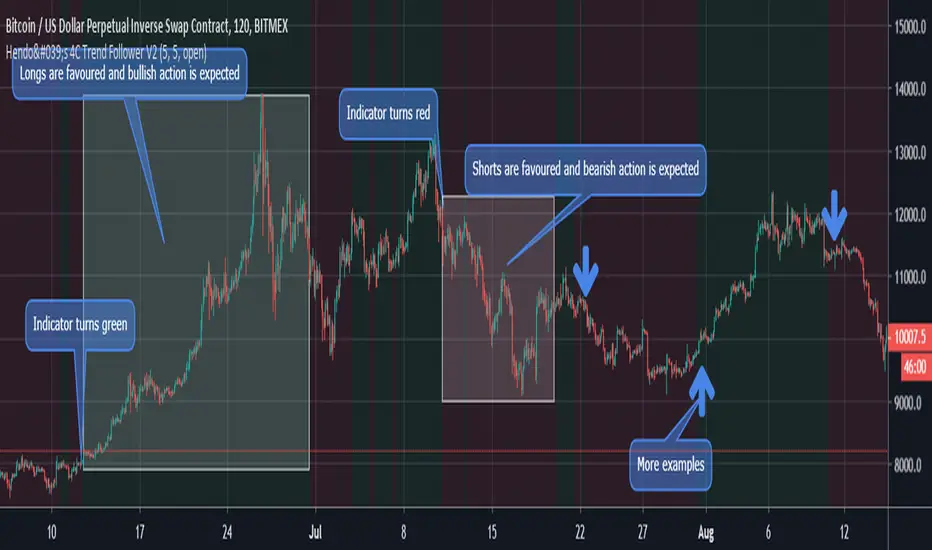
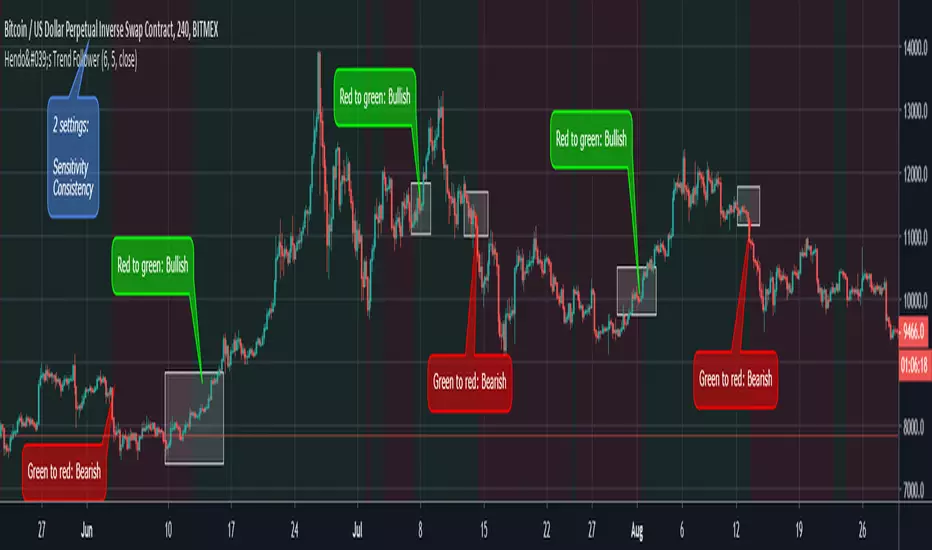
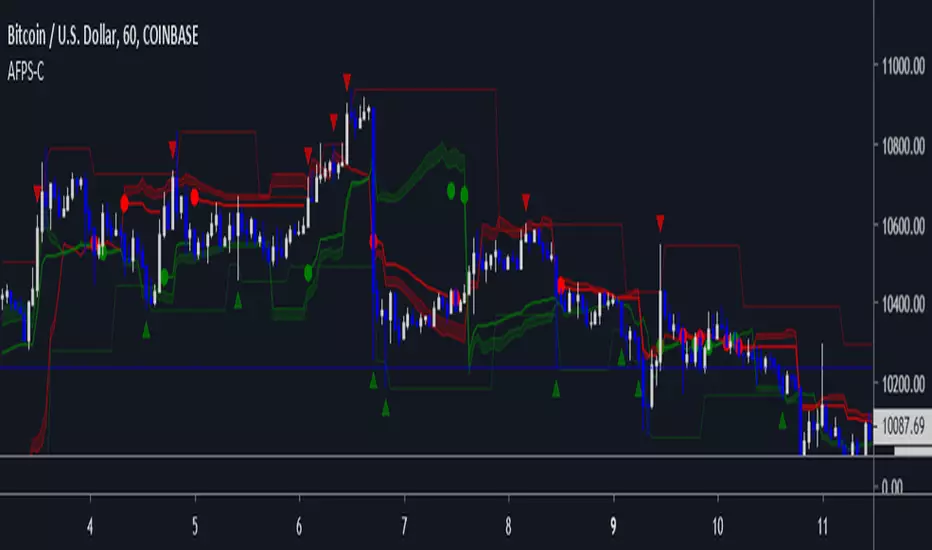
Hendo's 4C Trend Follower V2 (with alerts)An updated version of my previously created "Trend Follower", now comes with 4 different types of alerts, improved conditions and accuracy and the abillity to colorcode as you desire. I strongly suggest manual traders to make sure you disable the visibillity of the alerts, because those clutter your charts quite easily. The usecase is described below:
Used to determine a bias and can be used to find pivots . It colors the background of your charts green when it's biased towards bullishness, red when it's biased towards bearishness. The transitions between Red & Green are also tradeable pivots .
Most of usage is explained quite well in the image found above. It does work on every pair and every time frame. It does not repaint nor does it use data from the future to find a bias.
As any of these indicators:
1. It does not work 100% of the time
2. It works better on higher time frames (less trendshifts)
3. It's extremely consistent in execution, unlike human beings: Hence why it's perfect for determining your bias on price.
Comes with 2 settings:
Sensitivity: 1-20 (5 Default)
Consistency: 1-10 (5 Default)
Feel free to match the settings with the pair you're trading. Higher for BTC , lower for FX for example.
Access is ONLY for members, I'm not selling the sourcecode, nor letting people "help" with development.
More stuff to come!
Pivot Reversal Strategy + RSIPivot Reversal Strategy + RSI
A modified version of the standard PRS with an RSI overbought/oversold filter
Comment/uncomment "Study/Strategy" to easily switch to strategy() mode
As long as it is used in the study() version, the indicator is compatible with the Risk Management Wrapper
Separate Alerts for Buy & Sell signals
Single Alert for both Buy & Sell signals - it can also be used by another indicator as a source
Camerilla PivotsBefore starting special thanks to @QuantNomad for his script "Ultimate Pivot Point Alerts"
Link : -
Please follow and support him for his work.
In this script I'm modifying how time frame factor is imported into the script and removing other types of Pivots and cleaning it further for only CAMs, I've also added the formulas for 5 and 6 numbers, it will help in trading breakout strategies.
Note that this way of importing Time frame produces minor difference in readings/levels from how it is done in QuantNomads script, so before taking your pics you should calculate your levels on separate sheet and compare which ones are working for you and your strategy.
I've been using this CAM setup for almost a year now, so I coded it as per my needs, it is up to users to utilize it to theirs.
Further utility:
1. You can hide/unhide S/R levels 5/6
2. This is MultiTimeframe version, meaning you can change Time-frame of Pivots being displayed on any TF chart.
3. Lines are produced for only level 3 and 4. And you can choose to hide them. Only Pivot line is kept and can not be hidden.
4. You can also choose to hide/unhide level value and only see label if you want.
5. No historical levels are kept to avoid clutter.
I've not included alerts as I don't use them, but if anyone wants it I suggest referring to @QuantNomad script bank. He has published number of excellent scripts in this regard.
There is no restrictions on this script, it can be used and reproduced freely. Its my way of doing little something for community and my first script.
Enjoy.

Pivot Points with Fibonacci YearlyPivot Points with Fibonacci
Yearly only
What is a Pivot Point?
A pivot point is a technical analysis indicator, or calculations, used to determine the overall trend of the market over different time frames. The pivot point itself is simply the average of the high, low and closing prices from the previous trading day. On the subsequent day, trading above the pivot point is thought to indicate ongoing bullish sentiment, while trading below the pivot point indicates bearish sentiment.
The pivot point is the basis for the indicator, but it also includes other support and resistance levels that are projected based on the pivot point calculation. All these levels help traders see where the price could experience support or resistance. Similarly, if the price moves through these levels it lets the trader know the price is trending in that direction.
When the price of an asset is trading above the pivot point , it indicates the day is bullish or positive.
When the price of an asset is trading below the pivot point , it indicates the day is bearish or negative.
The indicator typically includes four additional levels: S1, S2, R1, and R2. These stand for support one and two, and resistance one and two.
Support and resistance one and two may cause reversals, but they may also be used to confirm the trend. For example, if the price is falling and moves below S1, it helps confirm the downtrend and indicate a possible continuation to S2.
This Script includes the Mid Pivot Points , All levels are based on Fibonacci
Pivot Points with Fibonacci QuarterlyPivot Points with Fibonacci
Quarterly only
What is a Pivot Point?
A pivot point is a technical analysis indicator, or calculations, used to determine the overall trend of the market over different time frames. The pivot point itself is simply the average of the high, low and closing prices from the previous trading day. On the subsequent day, trading above the pivot point is thought to indicate ongoing bullish sentiment, while trading below the pivot point indicates bearish sentiment.
The pivot point is the basis for the indicator, but it also includes other support and resistance levels that are projected based on the pivot point calculation. All these levels help traders see where the price could experience support or resistance. Similarly, if the price moves through these levels it lets the trader know the price is trending in that direction.
When the price of an asset is trading above the pivot point , it indicates the day is bullish or positive.
When the price of an asset is trading below the pivot point , it indicates the day is bearish or negative.
The indicator typically includes four additional levels: S1, S2, R1, and R2. These stand for support one and two, and resistance one and two.
Support and resistance one and two may cause reversals, but they may also be used to confirm the trend. For example, if the price is falling and moves below S1, it helps confirm the downtrend and indicate a possible continuation to S2.
This Script includes the Mid Pivot Points , All levels are based on Fibonacci

Pivot Points with Fibonacci MonthlyPivot Points with Fibonacci
Monthly only
What is a Pivot Point?
A pivot point is a technical analysis indicator, or calculations, used to determine the overall trend of the market over different time frames. The pivot point itself is simply the average of the high, low and closing prices from the previous trading day. On the subsequent day, trading above the pivot point is thought to indicate ongoing bullish sentiment, while trading below the pivot point indicates bearish sentiment.
The pivot point is the basis for the indicator, but it also includes other support and resistance levels that are projected based on the pivot point calculation. All these levels help traders see where the price could experience support or resistance. Similarly, if the price moves through these levels it lets the trader know the price is trending in that direction.
When the price of an asset is trading above the pivot point , it indicates the day is bullish or positive.
When the price of an asset is trading below the pivot point , it indicates the day is bearish or negative.
The indicator typically includes four additional levels: S1, S2, R1, and R2. These stand for support one and two, and resistance one and two.
Support and resistance one and two may cause reversals, but they may also be used to confirm the trend. For example, if the price is falling and moves below S1, it helps confirm the downtrend and indicate a possible continuation to S2.
This Script includes the Mid Pivot Points , All levels are based on Fibonacci

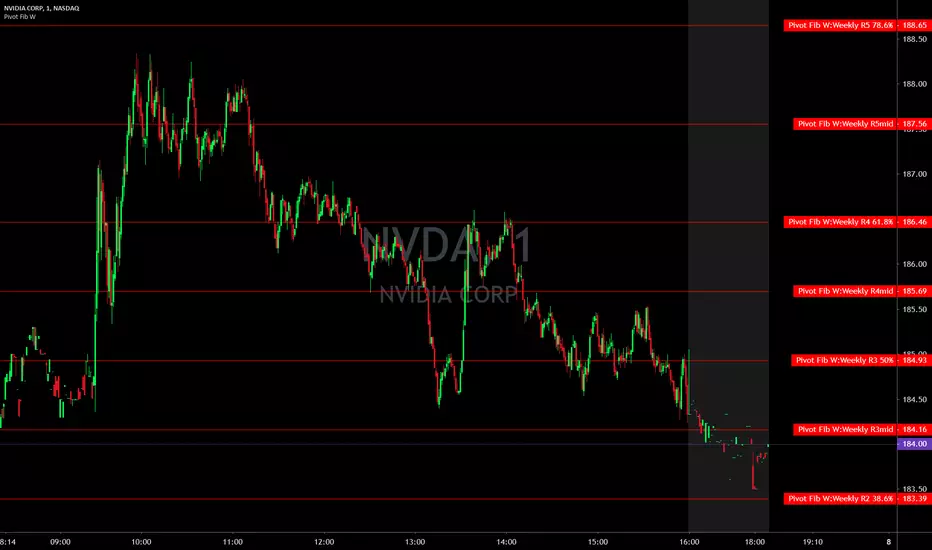
Pivot Points with Fibonacci WeeklyPivot Points with Fibonacci
Weekly only
What is a Pivot Point?
A pivot point is a technical analysis indicator, or calculations, used to determine the overall trend of the market over different time frames. The pivot point itself is simply the average of the high, low and closing prices from the previous trading day. On the subsequent day, trading above the pivot point is thought to indicate ongoing bullish sentiment, while trading below the pivot point indicates bearish sentiment.
The pivot point is the basis for the indicator, but it also includes other support and resistance levels that are projected based on the pivot point calculation. All these levels help traders see where the price could experience support or resistance. Similarly, if the price moves through these levels it lets the trader know the price is trending in that direction.
When the price of an asset is trading above the pivot point , it indicates the day is bullish or positive.
When the price of an asset is trading below the pivot point , it indicates the day is bearish or negative.
The indicator typically includes four additional levels: S1, S2, R1, and R2. These stand for support one and two, and resistance one and two.
Support and resistance one and two may cause reversals, but they may also be used to confirm the trend. For example, if the price is falling and moves below S1, it helps confirm the downtrend and indicate a possible continuation to S2.
This Script includes the Mid Pivot Points , All levels are based on Fibonacci
Pivot Points with Fibonacci DailyPivot Points with Fibonacci
Daily only
What is a Pivot Point?
A pivot point is a technical analysis indicator, or calculations, used to determine the overall trend of the market over different time frames. The pivot point itself is simply the average of the high, low and closing prices from the previous trading day. On the subsequent day, trading above the pivot point is thought to indicate ongoing bullish sentiment, while trading below the pivot point indicates bearish sentiment.
The pivot point is the basis for the indicator, but it also includes other support and resistance levels that are projected based on the pivot point calculation. All these levels help traders see where the price could experience support or resistance. Similarly, if the price moves through these levels it lets the trader know the price is trending in that direction.
When the price of an asset is trading above the pivot point , it indicates the day is bullish or positive.
When the price of an asset is trading below the pivot point , it indicates the day is bearish or negative.
The indicator typically includes four additional levels: S1, S2, R1, and R2. These stand for support one and two, and resistance one and two.
Support and resistance one and two may cause reversals, but they may also be used to confirm the trend. For example, if the price is falling and moves below S1, it helps confirm the downtrend and indicate a possible continuation to S2.
This Script includes the Mid Pivot Points , All levels are based on Fibonacci

Extended Fibonacci PivotEditable Fibonacci Pivots. 0.236, 0.382, 0.618, 0.786, 1.000. Easy to extend further if needed. Can be used with intervals from 1 minute to 1 Day.
A Few Recommended timeframes:
1 minute chart - 15 Minute Pivot Timeframe
3 minute chart - 1 Hour Timeframe or Daily Timeframe
15 Minutes to < 60 Minutes - Daily Timeframe
1 Hour to 4 Hour - Weekly Timeframe
Daily - Monthly Timeframe
Hendo's Trend FollowerA main trend following indicator:
Used to determine a bias and can be used to find pivots. It colors the background of your charts green when it's biased towards bullishness, red when it's biased towards bearishness. The transitions between Red & Green are also tradeable pivots.
Most of usage is explained quite well in the image found above. It does work on every pair and every time frame. It does not repaint nor does it use data from the future to find a bias.
As any of these indicators:
1. It does not work 100% of the time
2. It works better on higher time frames (less trendshifts)
3. It's extremely consistent in execution, unlike human beings: Hence why it's perfect for determining your bias on price.
Comes with 2 settings:
Sensitivity: 1-20
Consistency: 1-5
Feel free to match the settings with the pair you're trading. Higher for BTC, lower for FX for example.
Access is ONLY for members, I'm not selling the sourcecode, nor letting people "help" with development.
More stuff to come!

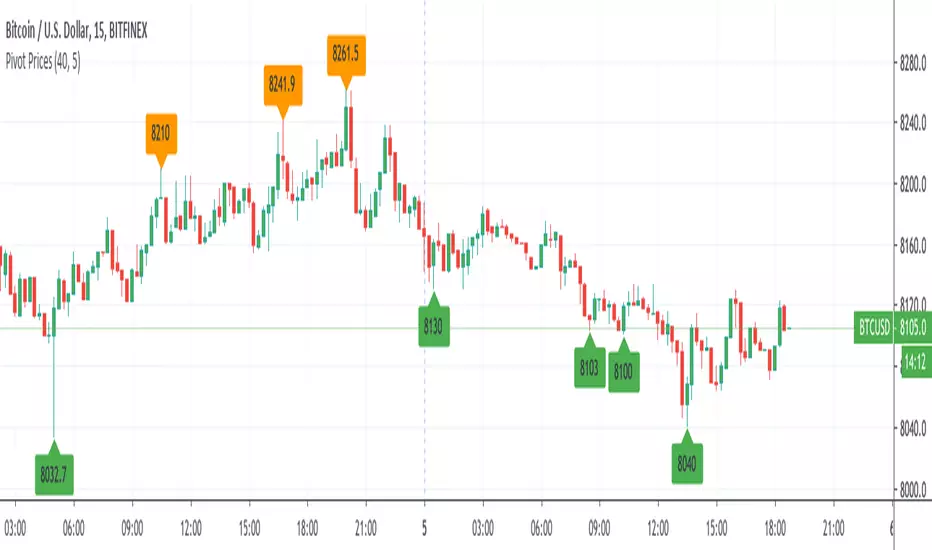
Pivot Prices - ExampleA simple example script showing how to use label.new() to plot pivot prices on the chart.
A full tutorial and commentary is available on the backtest-rookies website.
Pivot Points MTFStandart pivot points which auto switching with higher TF ones.
4h pivots on 5min
1D pivots on 15min
1W pivots on 4 hours
1M pivots on daily
1Y pivots on weekly

[AU] Open Close MidlineSimple open, close, midline indicator for 3D, W, M. Much less complex than Levels.
Aroon Pivots BetaThis script is the beta version of the Aroon Pivots for testing purposes and is not intended to be used in real trading.
========= AROON PIVOTS =========
The purpose of this script is to use the power of the Aroon Lines to determine when trends or portions of a trend have reached a certain level of exhaustion, which in turn can help discover pivot points or reversals. Aroon Lines (the Up and Down lines) are measures of time that compare previous highs and lows, as well as opens and closes, which when compared can give insight on a possible incoming trading move. Aroon is one of the few indications that was designed for this purpose to show possible moves instead of historic data.
========= HOW TO USE =========
It's fairly simple, but small labels are created that show when entry or exit is at its closing peak. Labels can be used to enter as a maximum opportunity in addition to minimal risk, while simultaneously can be used to close an already open position for maximum closing results.
========= ADDITIONAL NOTES =======
- Labels are printed when the criteria is met, however, the labels are not fully realized until candle close.
- Labels are not repainted.
- Labels are specific to their relative timeframe, so its expected that a lower timeframe pivot will not expand into a high timeframe label, especially is the labels are giving opposite pivots.
Version 0.0.1

Pivot Points QuarterlyQuarterly only
What is a Pivot Point?
A pivot point is a technical analysis indicator, or calculations, used to determine the overall trend of the market over different time frames. The pivot point itself is simply the average of the high, low and closing prices from the previous trading day. On the subsequent day, trading above the pivot point is thought to indicate ongoing bullish sentiment, while trading below the pivot point indicates bearish sentiment.
The pivot point is the basis for the indicator, but it also includes other support and resistance levels that are projected based on the pivot point calculation. All these levels help traders see where the price could experience support or resistance. Similarly, if the price moves through these levels it lets the trader know the price is trending in that direction.
When the price of an asset is trading above the pivot point , it indicates the day is bullish or positive.
When the price of an asset is trading below the pivot point , it indicates the day is bearish or negative.
The indicator typically includes four additional levels: S1, S2, R1, and R2. These stand for support one and two, and resistance one and two.
Support and resistance one and two may cause reversals, but they may also be used to confirm the trend. For example, if the price is falling and moves below S1, it helps confirm the downtrend and indicate a possible continuation to S2.
This Script includes the Mid Pivot Points , Open and Close levels

Function : Pivots High and Low WARNING: The toil of this script is not mine . In order to avoid disrespect for work, I deleted some extensions only pure pivots , that is, only the information this script needed. I liked the fact that high and low pivots were in one function. I found this command by chance on stackoverflow. I don't know the authors and the nicknames because they are the stackoverflow nicknames. I hope it will help your adaptive periods. Finally, the length of the pivot must be at least 3 to be available.If the author reaches me, I will give his/her Tradingview name as a reference.

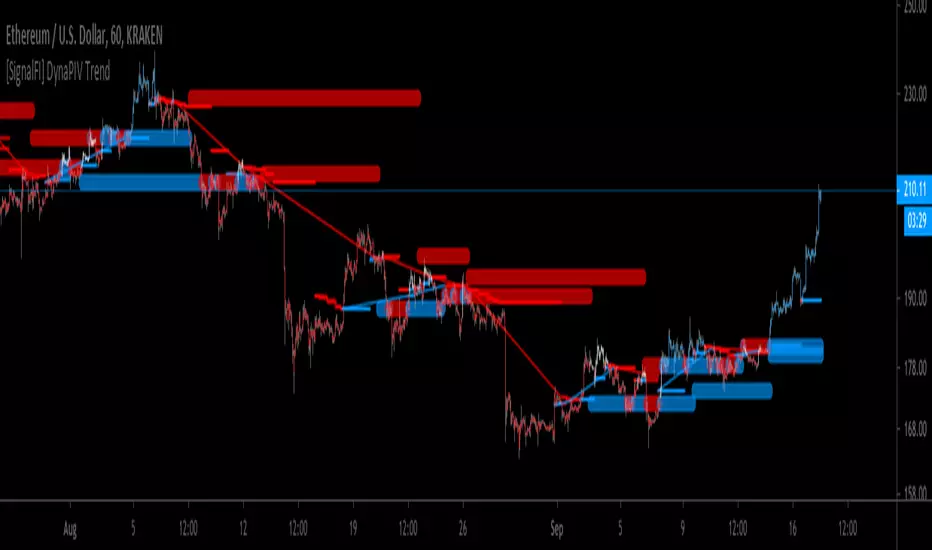
[SignalFI] DynaPIV TrendWelcome!
We're pleased to introduce DynaPIV Trend! This single script provides a array of valuable trend information that can help in short term scalping strategies, and helping define trend strength across support and resistance points.
The heart of DynaPIV is an dynamic, volatility adjusted moving average based on fibonacci ratios. The script creates a visual representation of trend based on the pivots created with this dynamic moving average as has both short and long term support and resistance lines delineated by color and thickness.
In general, the script will color bars according to the trend. By default, our safe mode is enabled which will filter out potential false breakouts, as well identify channeling zones (where bars are white). Disabling Safe Mode will provide more opportunities for scalping, however increases the risk of trend invalidation. By nature the trader is meant to follow the comprehensive visual presented by DynaPIV Trend, inclusive of horizontal and diagonal painted support and resistance lines.
NOTE: The script is useful for timeframes 5M to 2HR. However the recommended is 30M - 1HR. Using the script on higher timeframes will invalidate the dynamic nature of the DynaPIV Trend volatility calculation and thus render the trend invalid.
SignalFI was created to help traders and investors to effectively analyze the market based on the Golden Mean Ratio (Fibonacci numbers), plan a trade and ultimately execute it. To help inform and educate market decisions we developed a set of Trading Indicators which are available on TradingView.
SignalFI indicators are just that, indicators. Our indicators are generally configured to use completely historical data (negating repaint), and we advise all alerts created with SignalFI indicators to be fired upon "close" of the current candle. Our indicators can provide valuable context and visualization support when performing market analysis and executing buy and sell decisions. However. we are not financial experts, and all information presented on this site or our other media outlets are for educational purposes only.
For subscription information, visit www.signalfi.net and follow us on twitter: @signalfi_
ATR Fib Pivot Stop ComboAcknowledgements: Everget for the Chandlier Exit indicator + other indicators for structure reference and MG for the Trailing Pivot stop indicator.
I wanted a Fib-Pivot-Stop indicator, so I duct-taped them together with some Fibs, and this was the result.
Technically you could say this is experimental and unfinished - the indicator is bulky/clunky enough to make it hard enough to use traditional MAs and other indicators that are drawn on chart. If you have success with this indicator trading, I want to know - send me a PM or link me a chart, please.
Auto Trend Lines [Anan]Hello Friends..
This is Auto Trend Lines, A script that draws trendlines from the pivot points in the price chart,,
So helpful and smart !
Play with the options to adjust the precision.
This is my simple edition from " Trendlines - JD "
