IndianPivotBossPIVOTRSIThis is a new avatar of Pivot RSI.
Pivot RSI shows the momentum of the market.
A cross above 50 is a bullish momentum and below 50 is a bearish momentum.
This is a strategy on its own.
However, this is to be used in combination with IndianPivotBossMUPS indicator which is available in the public library.
Pivot
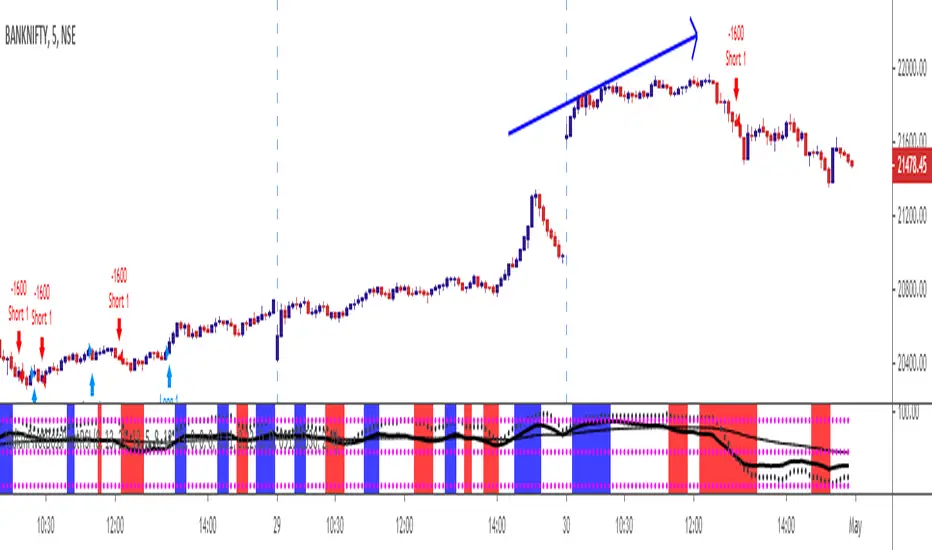
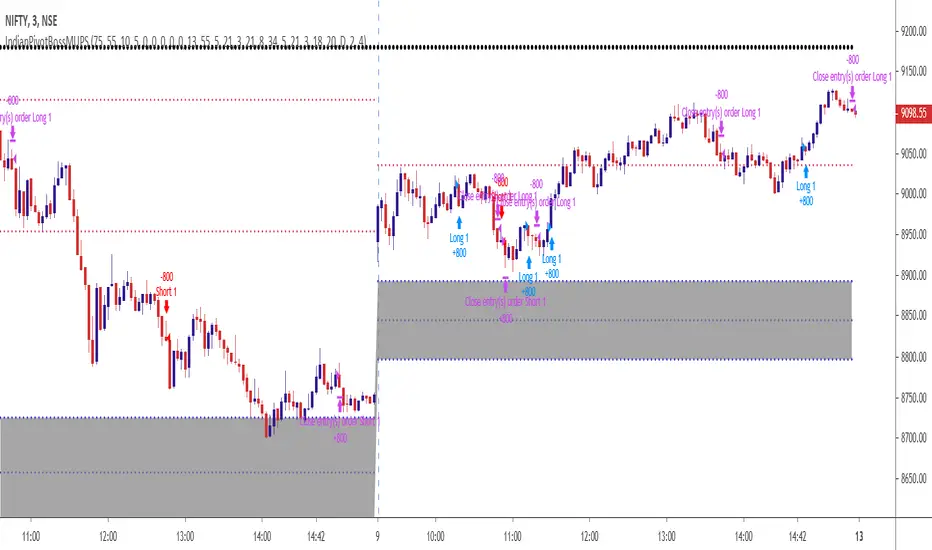
IndianPivotBossMUPSThis is a new avatar of the MUPS (ManojUltimatePivotScalpingStrategy).
This Indicator is to be used with the following Indicators :
1) IndianPivotBossPEMA
2) IndianPivotBossPIVOTRSI
3) IndianPivotBossDPWMACD
4) IndianPivotBossPIVOTSHIFT
BcondA = crossover(close,dtime_up) or low > dtime_up
BcondB = crossover(low,imap) or crossover(low,dpivotema) or crossover(low,imapw) or crossover(low,imapm)
//BcondC = crossover(low,ddtime_pivot)
BcondD = crossover(low,wtime_pivot)
BcondE = crossover(low,mtime_pivot)
BcondF = crossover(low,idtime_pivot)
BcondG = imacd > 0 or imacdw > 0 or imacdm > 0
BcondH = (rsipe > 50 and rsipe > rsippe) or (rsipew > 50 and rsipew > rsippew) or (rsipem > 50 and rsipem > rsippem)
BcondI = crossover(imacd,0) and close > maFast
//BcondI = ( dtime_pwd < ema(dtime_pwd,8) and crossover(low,dtime_r1))
EcondS = (imacd < 0 or crossunder(imacd,0) or close < maSlow) and rsipe < 50 and rsippe < 50 //crossunder(high,dtime_pivot) or crossunder(high,dpivotema) or crossunder(close,wtime_pivot) or crossunder(high,idtime_pivot) or crossunder(rsipe,rsippe) or crossunder(rsipe,50) or crossunder(high,dtime_r1)
Objective :
To enter into a trade when the direction, trend and momentum is confirmed.
Rules :
The following are the broad conditions for taking a long position. Reverse is for Short.
Direction - Defined by price crossing either daily cpr / weekly pivot / monthly pivot / intraday 125 min pivot
Trend - Defined by IndianPivotBossPIVOTSHIFT and IndiaPivotBossDPWMACD. The latter is a variant of the former. The former gives advance indication of a trend, while the latter confirms moments later.
Momentum - Defined by IndianPivotBossPIVOTRSI.
The strategy takes long when direction is established by the price crossing pivots and trend is established with pivot shift indicator sloping upwards which is further confirmed by DPWMACD, which is a variant of pivot shift indicator, crossing midline and sloping upwards and Momentum is established by Pivot RSI indicator when it crosses 50 and is above its own EMA.
Exits are usually at close. In case if the combination fizzles out, the strategy shows exit signal if any of the 3 ie, direction / trend / momentum fizzles out.
It is suggested to close down the positions at day end as sometimes the strategy continues the position overnight if deemed fit.
Other Rules when you take a long trade based on the signal.
1) Ensure the price is above PEMA and PEMA is upward sloping.
2) Ensure the Pivot shift indicator is upward sloping; Ensure the DPWMACD is also upward sloping.
3) Ensure the Daily Pivot RSI is above 50 and is above its own EMA.
This is not a holy grail. Hence have a proper position sizing which is your ultimate defense.
IMPORTANT : WHEN YOU USE THIS INDICATOR ALONG WITH 1,2,3,4 MENTIONED IN THE TOP PORTION OF THIS POST, PLS ENSURE THAT THE STRATEGY CHOSEN IS MUPS AS ALL THOSE MENTIONED ABOVE ARE ALSO STRATEGIES ON ITS OWN. MUPS COMBINES ALL THESE.
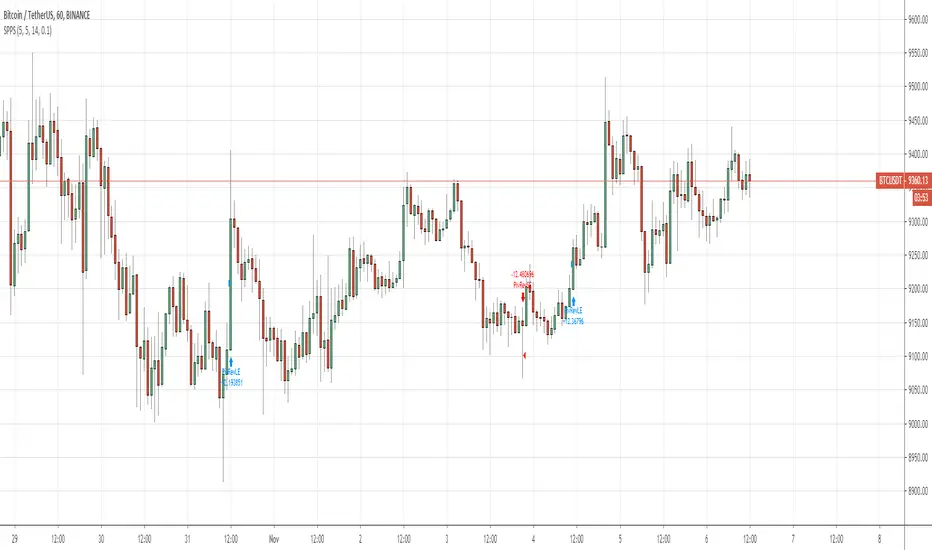
Pivot of Pivot Reversal Strategy [QuantNomad]Continue looking for more signifcant pivot points.
This script is based on my "Significant Pivot Reversal Strategy".
In this strategy I use concept of pivot of pivot points.
So for PoP I require that pivot highs point should have 2 lower pivot highs points around them and pivot low 2 higher pivot lows points.
Transparent lines represent usual pivot levels ints.
Not transparent lines represent pivot of pivot levels.
Link to original script:

QuantNomad - Significant Pivot Reversal StrategyI'm working on improving the Pivot Points Reversal Strategy.
As one of the ways to filter out insignificant levels I decided to check that pivot point is not above/below neighbors, but check that it's above/below at least by a certain amount.
I use ATR, so in params, you can set length of ATR and also ATR multiplier. The new level will be calculated only if PP will be above/below neighbors by atr * atr_mult.
It seems this approach might help in some cases.
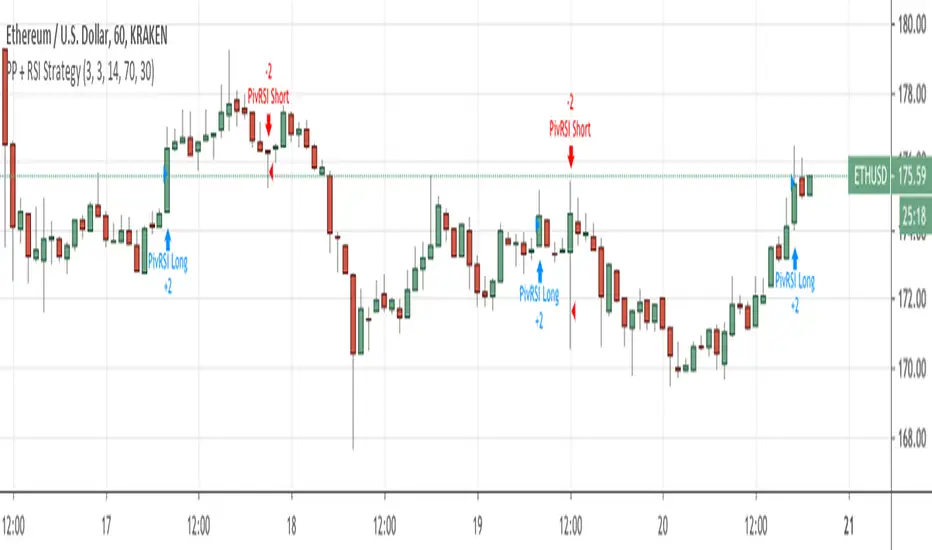
Here I have PivotPoint + RSI strategy:
Pivot Reversal Strategy - FIGS & DATES 2.0Simple Pivot Reversal Strategy with some adding settings.
Date Range: To test over specific market conditions.
Initial Capitol: $10K - This is a more realistic representation of funds used this strategy (for me anyway). The default of $100K can give different results (usually better) than when using a smaller balance.
Order Size: 100% Equity - These trend following strategies typically used this way, going all in each direction.
Commission: .075% - It's always disheartening to think you've found a ridiculously good setting, and then realize you forgot to add the commission.
All of these settings can be changed, but it's easier for me (and more fool proof) to have them set as default.

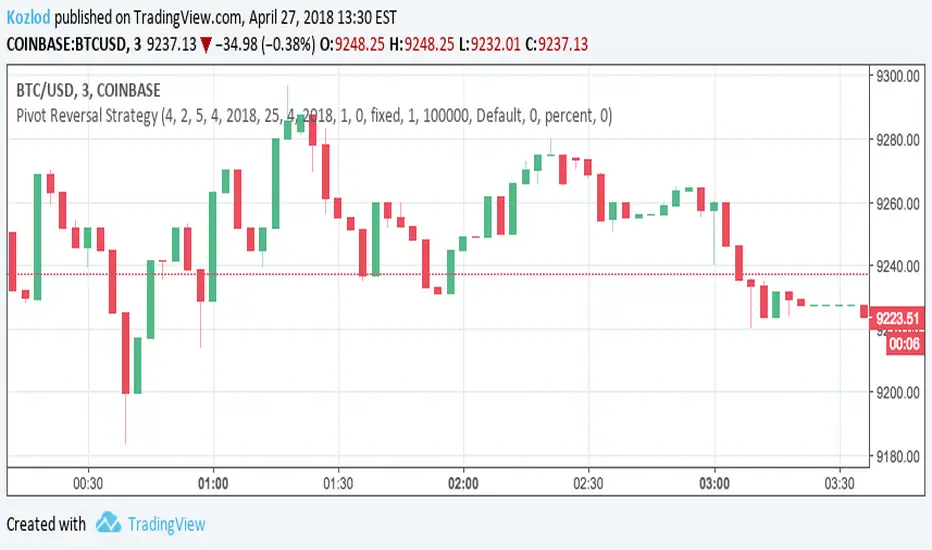
Pivot Point Reversal + RSI StrategyThis strategy joins the Pivot Reversal strategy with the RSI indicator.
We check RSI level at the pivot point level and only if RSI condition is satisfied we update levels for stop orders.
The strategy works pretty good for crypto, 30m, 1h, 2h timeframes.
IDrawCharts 6HR Pivot StratThis is a pretty basic script, designed to work on the 6HR XBTUSD chart. Nothing special, but it does a decent job of catching mid-term (1-2 week) trends. It is not optimized to be profitable on other timeframes by itself, but can be used as a confluence indicator.

QuantNomad - Pivot Reversal Strategy - XBTUSD - 1hPivot reversal strategy almost always works pretty good for crypto.
Here is setup with 4 left, 4 right bars for pivot points for XBTUSD 1h chart.
It shows a pretty nice performance of 350% with only 10% dd, Sharpe is 1.16.
If you're interested in using this strategy in my scripts you can find alerts for it and a version with added backtesting range.
And remember:
Past performance does not guarantee future results.

Scalping Grid at Pivot Point FibonacciThis strategy sets a grid of stop orders once price touch one Fibonacci weekly pivots.
This works very well for scalping as the price touch a pivot level.
Take care when you work with grids because drawdown could be very high.
Study with alarms is available at request.
Please use comment section for any feedback.
Next improvement (only to whom is interested to this script and follows me): study with alerts on multiple tickers all at one. Leave a comment if you want to have access to study.
********************************** IMPORTANT*******************************
I have developed an expert advisor for metatrader4 (MT4) and for jforex platform: results of expert advisor form 2015-01-01 to 2018-11-25 are very good with low drawdown and good profit.
********************************************************************************

Failure Swing Strategy (stop hunting) V1 (Made on XBT/USD 4h Bitmex)
This strategy is a first attempt to countertrade the false break of a key support/resistance.
If a candle breaks the level, but it comes back before close, it will trigger an order.
The Stop Loss is in %, the Take Profit is near the EMA.
There is a "volatility filter" to block orders when the price is near the EMA and a coefficient to adjust a little the Stop Loss and Take Profit according to the chart condition.

pivot point strategy(lirshah)The pivot point levels are composed of a pivot point, two higher resistance levels known as R1 and R2, and two lower pivot point supports known as S1 and S2.
Each resistance level is considered a pivot point.
this strategy gives signals based on valid pivot points( reactionary price level) and it has a good results on the variety of pairs in different markets.


Rahul's PRSThis is a test script to run pivot reversal indicator on a chart and also make it put orders based in the indicated results
Pivot Reversal Strategy with backtest date rangeThis is standard Pivot Reversal Strategy with backtest date range added.
In parameters you can select from/to date for backtesting range.

My Custom indicator & Strategy for trading BTC in 5min UTHello,
If your goal is to make some BTC, this script might be for you.
I tested it on the ETH/BTC Binance chart.
About the indicator :
In short, it will help you for several things :
Avoid losing BTC when the trend goes bearish.
Earn BTC during any bullish trend.
Earn BTC when the market is in trading range by bouncing off trend lines, while anticipating a new potential trend.
I based my algorithm on several technical tools such as volume, RSI, pivot, for a total of 6 boolean conditions mixed together with AND and OR gates, resulting in those entry points (shapes)
About the Strategy :
I only used long entries and exits. No shorting.
The commission rate is set to 0.05% (binance)
The backtesting results in only 40€ of net profit for a 1000€ inital capital, it may seem litle BUT during the testing period (18 days, 40 trades) the coin (ETH) dropped in BTC value ( -25% ). You make 4% while a simple Holder would lose -25%, which is 29% difference.
Since I worked hard on this script, I'll grant access to only those willing to make a small donation, that'd really help me reach my goal of making a living with trading. I will also give you any info you want and give you everything need to set up alerts. Thank you very much.

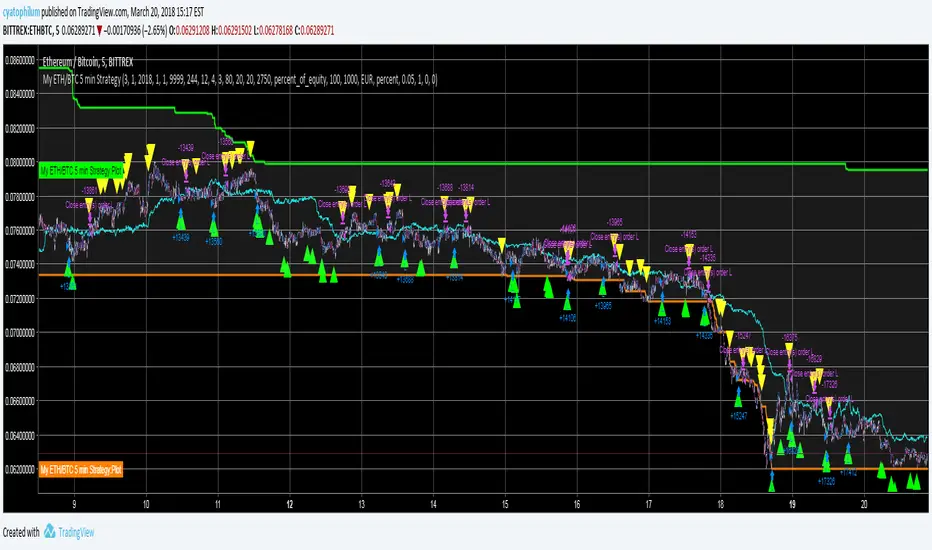
My ETH/BTC 5 min StrategyHello, beginner in trading here. Use this at your own risk.
Commission : 0.05%
Time Unit : 5 min
Backtest range : 15 days (looking like that is the maximum in 5 min UT)
Initial capital : 1000€
How it works :
Long entries and exits. That's all, no pyramiding, no shorting.
It takes the first buy signal (green triangle) and the first sell signal (yellow triangle)
The idea is to scalp while in range using stochastic, and to get out / in when a big trend appears (that is what the tunnel is for).
See the code for details.
I think those are pretty good result when we look at hueg negative buy and hold returns of this month of March. What do you think?
HMA_PPT StrategyHMA_X & Pivot Profit Taker combo
LOL!
change the settings to suit your favorite pair/TF before cry yourself to sleep.
doesnt repaint? ----> YOU TELL ME :-D
