VPG – MTF PrevClose Dashboard (Horizontal 6TF, Bottom Right, VPG – MTF PrevClose Dashboard is a lightweight, real-time visual indicator that displays the current price position across six key timeframes — Weekly (W), Daily (D), 4H, 1H, 30m, and 15m.
It compares the current market price to the previous candle close and shows whether the price is:
🟢 RALLY → higher than the previous close
🔵 BASE → roughly equal (sideways / consolidation)
🔴 DROP → lower than the previous close
Designed as a clean, horizontal dashboard fixed at the bottom-right corner of your chart, it provides instant multi-timeframe insight without cluttering your workspace.
⚙️ Key Features
🔹 Real-time monitoring of six key timeframes (W, D, 4H, 1H, 30m, 15m)
🔹 Clear and intuitive color scheme: Green = RALLY, Blue = BASE, Red = DROP
🔹 Fixed bottom-right placement for consistent visibility
🔹 Horizontal layout for compact, at-a-glance analysis
🔹 Adjustable tolerance to define how “equal” prices are classified as BASE
🔹 No alerts or labels — clean, fast, and resource-light
📊 Best For
Multi-timeframe traders who need quick directional context
Scalpers, intraday, and swing traders doing top-down analysis
Dashboard lovers who want a minimalist, data-driven overview
Confirming short-term price moves against higher-timeframe trends
💡 How to Use
Add VPG – MTF PrevClose Dashboard to any chart (Forex, Crypto, Stocks, Gold, Indices, etc.).
Adjust the tolerance parameter if you want a wider or stricter “BASE” range.
Watch the table in the bottom-right corner — it updates live with every price move.
🧠 About the Author
Nizar M — Developer of VPG indicators focused on clarity, momentum visualization, and fast market interpretation for real-time decision-making.
Pine yardımcı programları

Luminous Glide Momentum Indicator [wjdtks255]This indicator, named "Customized SuperSmoother MA Oscillator," applies a smoothing filter to price data using a SuperSmoother technique to reduce noise and enhance signal clarity. It calculates two moving averages on the smoothed data—a fast and a slow—whose difference forms the oscillator line. A signal line is derived by smoothing the oscillator with another moving average. The histogram visualizes the divergence between the oscillator and signal lines, indicating momentum strength and direction.
How it works
SuperSmoother Filter: Reduces price noise to provide smoother and more reliable signals than raw data.
Fast and Slow Moving Averages: The fast MA reacts quicker to price changes, while the slow MA indicates longer trends.
Oscillator: The difference between the fast and slow MAs signals shifts in momentum.
Signal Line: A smoothed version of the oscillator used to generate crossovers.
Histogram: Displays the distance between the oscillator and signal line, with color changes indicating bullish or bearish momentum.
Trading Strategy
Buy Signal: When the oscillator crosses above the signal line, it suggests increasing upward momentum, signaling a potential buy opportunity.
Sell Signal: When the oscillator crosses below the signal line, it suggests increasing downward momentum, signaling a potential sell opportunity.
Histogram Size and Color: Larger green bars indicate stronger bullish momentum; larger red bars indicate stronger bearish momentum.
Usage Tips
Combine this oscillator with other indicators or price action analysis to confirm trading signals.
Adjust smoothing and moving average lengths according to your trading timeframe and the asset volatility.
Use proper risk management to filter out potential false signals common in oscillators.

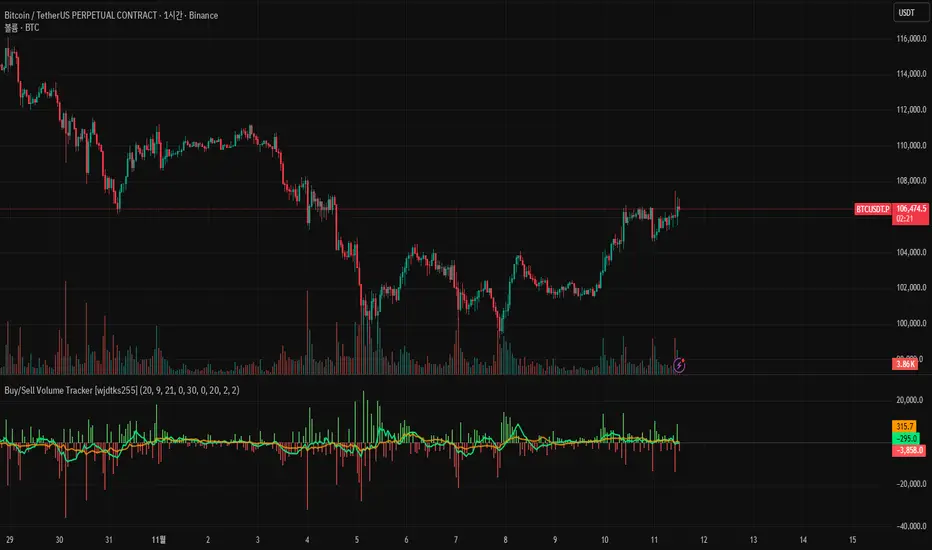
Buy/Sell Volume Tracker [wjdtks255]Indicator Description
Function: Separates buy and sell volume based on candle direction (close ≥ open) and displays the buy−sell difference (hist_val) as a histogram.
Visuals: Buy/sell bars are distinguished by user-selectable colors and opacity; two moving averages (MA1 and MA2) are shown to smooth the flow.
Meaning: A positive histogram indicates buy dominance; a negative histogram indicates sell dominance.
Limitation: The current separation is estimated from candle direction and may differ from execution-side (tick/trade-side) based data.
Trading Rules (Summary)
Conservative trend-following long
Entry: Enter long when hist_val turns above 0 and MA1 crosses MA2 from below.
Stop-loss: Exit if hist_val falls back below 0 or MA1 drops below MA2.
Take-profit: Use a risk:reward of 1:1.5 or set targets based on ATR.
Short-term rebound long
Entry: Enter a short-term long when a large negative histogram region begins to narrow and shows a recovery sign.
Stop-loss: Exit if hist_val drops below the previous low or bearish candles continue.
Take-profit: Prefer quick partial profit-taking.
Short (sell) strategy
Entry: Enter short when hist_val falls below 0 and MA1 crosses MA2 from above.
Stop-loss / Take-profit: Apply the inverse rules of the long strategy.
Filters and risk management
Volume filter: Only accept signals when volume exceeds a fraction of average volume to reduce noise.
Entry strength: Require |hist_val| to exceed a historical average threshold (e.g., avg(|hist_val|, N) × factor) to strengthen signals.
Position sizing: Size positions so that account risk per trade is within limits (e.g., 1–2% of account equity).
Timeframe: Use short timeframes for scalping and 1h+ for swing trading.
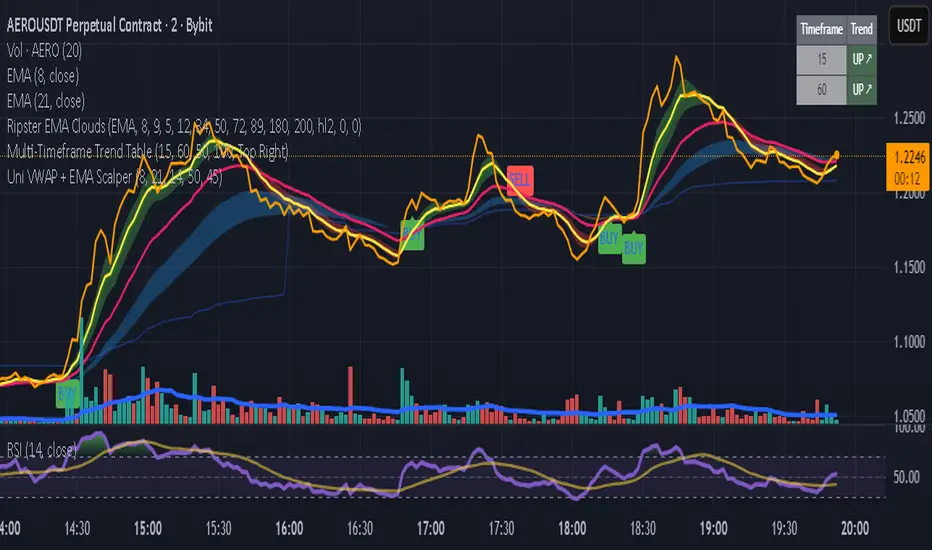
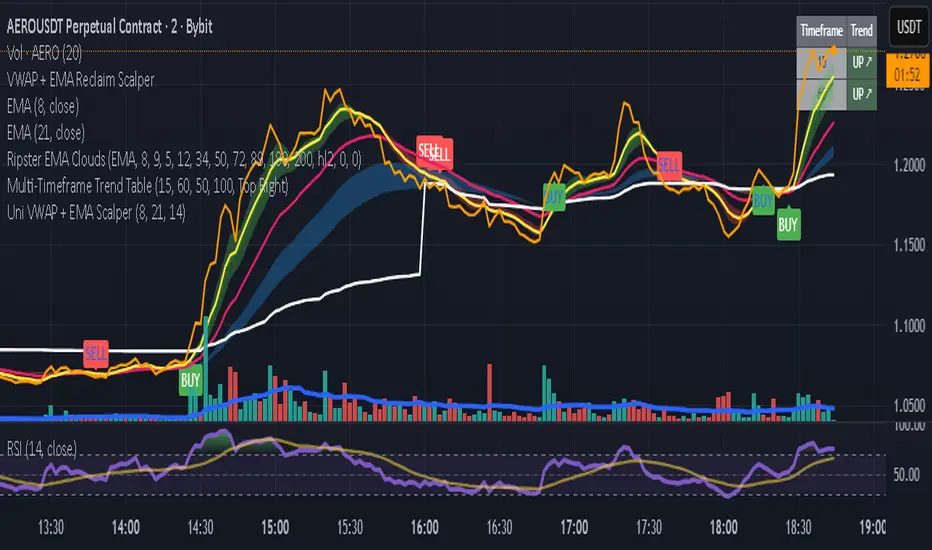
Uni VWAP + EMA ScalperWe learn more through the mistakes we make than the victories we enjoy. This is a work in progress to align visual and audible guidance for scalping and swing trades.
Customized Double Bollinger Bands [wjdtks255]This indicator combines two Bollinger Bands to visualize both short-term and extreme volatility zones on the same chart.
While a standard Bollinger Band shows how far price deviates from its mean,
this customized version displays two standard deviation ranges, allowing traders to distinguish between mild and extreme volatility conditions.
Band 1 (StdDev 0.5) captures short-term fluctuations near the price average,
while Band 2 (StdDev 3.0) highlights overbought or oversold conditions at market extremes.
When the distance between the two bands widens, volatility is increasing;
when it narrows, the market is stabilizing or preparing for a breakout.
ㆍPrice breaking above Band 2 → Potential overbought or strong bullish trend
ㆍPrice falling below Band 2 → Possible oversold or bearish continuation
ㆍBands tightening → Volatility compression, potential reversal zone
This indicator is designed primarily for volatility visualization rather than directional prediction.
For higher accuracy, use it alongside RSI, MACD, or trend-based indicators.
Developed by wjdtks255

Uni VWAP + EMA ScalperFor backtesting by small group. It's intended to synch and provide visual and audible alerts.
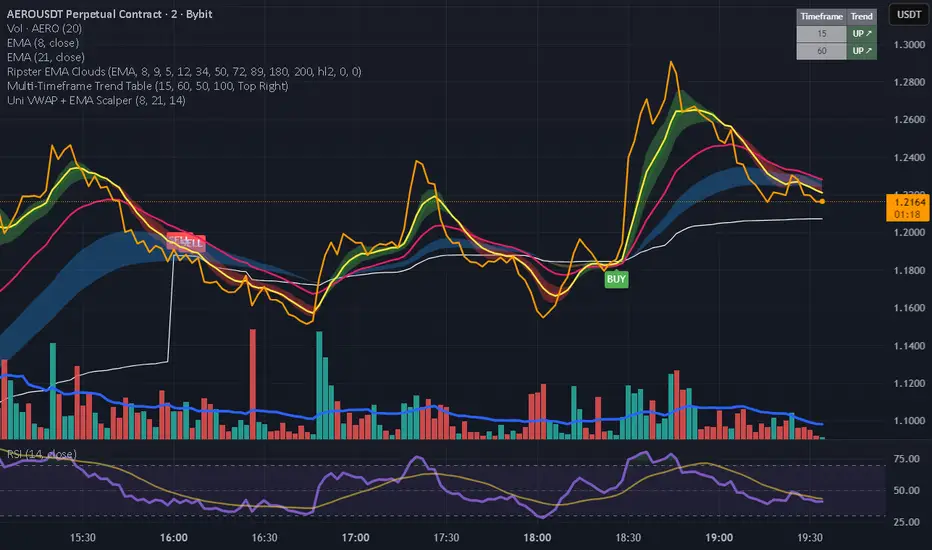
Uni VWAP + EMA ScalperSimple VWAP + EMA crossover test script for personal use and signal experiments.
Prototype tool combining VWAP and EMA crossovers for testing trade timing. Not optimized for live trading.
Daily ATR SL/TP Labels on ChartATR-Based Stop Loss & Take Profit Calculator
This script calculates 20% of the Average True Range (ATR) to determine optimal Stop Loss and Take Profit levels. Designed to assist traders in setting precise risk parameters when placing Buy/Sell orders based on daily market volatility.
Key Features:
Computes 20% of ATR value for proportional risk management
Provides dynamic SL/TP levels aligned to current market conditions
Optimised for Daily timeframe analysis to capture full trading day range
Recommended Usage:
Apply on Daily (1D) timeframe for most accurate results, as this captures the complete intraday price movement and provides reliable volatility measurements for position sizing and risk management decisions.


GCE 3:55 LEVELSlevels to top and bottom tick
These levels top and bottom tick a lot of the times, use your own confluences to make them work

Time Range HighlighterThis indicator highlights up to two custom time ranges on your chart with fully adjustable settings:
🔧 Features:
Define two separate time sessions
Set custom start and end times (in any time zone)
Choose unique highlight colors and opacity for each session
Toggle each range on or off independently
Timezone input allows syncing sessions to any global market hours (e.g., UTC, Asia/Tehran, New York)
🕒 Example Use Cases:
Highlight market opening hours (e.g. NYSE: 0930–1600)
Track your personal trading hours or peak volatility sessions
Visualize specific algorithm time filters
📌 Usage:
Enter your desired timezone string (e.g., "Asia/Tehran" or "Etc/UTC")
Customize session times like "0930-1200" and "1500-1700"
Adjust colors and visibility to fit your strategy
Ideal for traders who rely on time-based setups or session overlays.

Pro: Big Candle Pip Range (Upper Label)Highlights unusually large candles by calculating pip ranges dynamically based on recent volatility. Shows exact pip count above the candle, color-coded by direction (green bullish, red bearish). Features adaptive thresholds, optional histogram, and works on any instrument or timeframe. Ideal for scalpers and intraday traders spotting high-volatility candles quickly.

💎 ELMAS FORMASYONU 2.0 💎 The new version of the Indikaterdem Diamond Formation is beta 2.0. It is a trend-based software. When a stock enters a trend, diamond crystals form, and diamonds form periodically. There are two sensitivity settings: Smoothing and Average. Changing any other settings is not recommended.

Quantura - Session High/LowIntroduction
“Quantura – Session High/Low” is a professional-grade session mapping indicator that automatically identifies and visualizes the highs, lows, and ranges of key global trading sessions — London, New York, and Asia. It helps traders understand when and where liquidity tends to accumulate, allowing for better market structure analysis and session-based strategy alignment.
Originality & Value
This indicator unifies the three most influential global sessions into a single, adaptive visualization tool. Unlike typical session indicators, it dynamically updates live session highs and lows in real time while marking session boundaries and transitions. Its multi-session management system allows for immediate recognition of overlapping liquidity zones — a crucial feature for institutional and intraday traders.
The value and originality come from:
Real-time tracking of session highs, lows, and developing ranges.
Simultaneous visualization of multiple global sessions.
Optional vertical range lines for clearer visual segmentation.
Customizable session times, colors, and time zone offset for global accuracy.
Automatically extending and updating lines as each session progresses.
Functionality & Core Logic
Detects the start and end of each trading session (London, New York, Asia) using built-in time logic and user-defined UTC offsets.
Initializes session-specific high and low variables at the start of each new session.
Continuously updates session high/low levels as new candles form.
Draws color-coded horizontal lines for each session’s high and low.
Optionally adds vertical dotted lines to visually connect session range extremes.
Locks each session’s range once it ends, preserving historical structure for review.
Parameters & Customization
New York Session: Enable/disable, customize time (default 15:30–21:30), and set color.
London Session: Enable/disable, customize time (default 09:00–16:30), and set color.
Asia Session: Enable/disable, customize time (default 02:30–08:00), and set color.
Vertical Line: Toggle dotted vertical lines connecting session high and low levels.
UTC Offset: Adjust session timing to align with your chart’s local time zone.
Visualization & Display
Each session is color-coded for quick identification (default: blue for London, red for New York, green for Asia).
Horizontal lines track evolving session highs and lows in real time.
Once a session closes, the lines remain fixed to mark historical range boundaries.
Vertical dotted lines (optional) visually connect the session’s high and low for clarity.
Supports full overlay display without interfering with other technical indicators.
Use Cases
Identify liquidity zones and range extremes formed during active trading sessions.
Observe session overlaps (London–New York) to anticipate volatility spikes.
Combine with volume or market structure tools for session-based confluence.
Track how price interacts with prior session highs/lows to detect potential reversals.
Analyze session-specific performance patterns for algorithmic or discretionary systems.
Limitations & Recommendations
The indicator is designed for intraday analysis and may not provide meaningful output on daily or higher timeframes.
Adjust session times and UTC offset based on your broker’s or exchange’s timezone.
Does not provide trading signals — it visualizes session structure only.
Combine with liquidity and volatility indicators for full contextual understanding.
Markets & Timeframes
Compatible with all asset classes — including crypto, forex, indices, and commodities — and optimized for intraday timeframes (1m–4h). Particularly useful for traders analyzing session overlaps and volatility transitions.
Author & Access
Developed 100% by Quantura. Published as a Open-source script indicator. Access is free.
Compliance Note
This description fully complies with TradingView’s Script Publishing Rules and House Rules . It provides a detailed explanation of functionality, parameters, and realistic use cases without making any performance or predictive claims.

Inside Day FinderWhat is an Inside Day?
An inside day happens when:
Today’s high is lower than yesterday’s high, and
Today’s low is higher than yesterday’s low.
So, today’s candle is inside the previous day’s range — showing consolidation or indecision in the market.

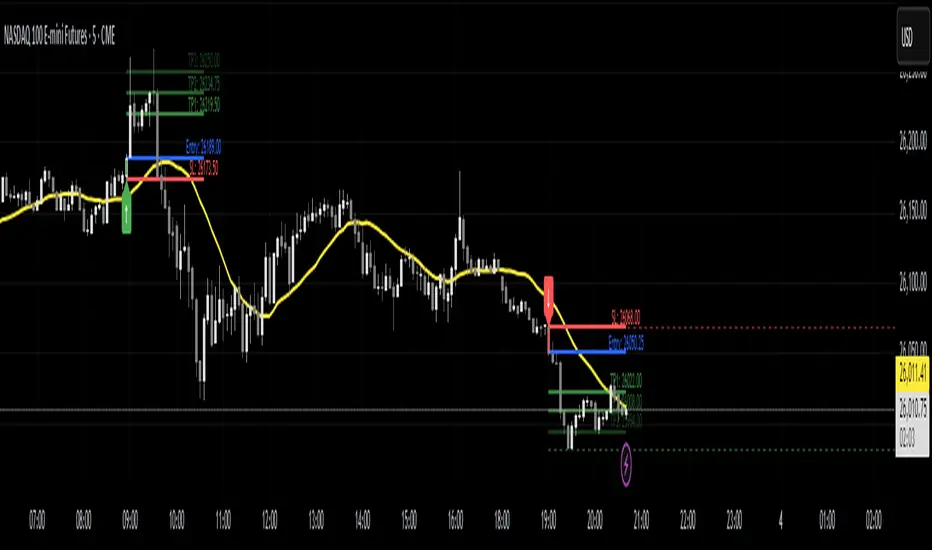
POSITION SIZER v8.0 🎯 PROFESSIONAL RISK MANAGEMENT TOOL
Automatically calculates the optimal position size for trading with SuperTrend.
Compatible with Forex, Stocks, Futures, and Cryptocurrencies.
✅ KEY FEATURES:
💰 Automatic SuperTrend — Detects market direction (LONG/SHORT)
📊 Precise Calculations — Shows position size, SL, TP and potential profit
🚨 Visual Alerts — Warns if you use excessive leverage
🔄 Multi-Market — Works on any instrument
⚡ Optimized — No errors, no crashes
🎓 HOW TO USE:
1 — Configure your Total Capital and Risk % (0.5-1% recommended)
2 — The indicator automatically detects your market type
3 — Panel shows exactly what to trade (size, entry, SL, TP)
4 — You execute manually on your broker
⚠️ IMPORTANT:
• This indicator does NOT place orders automatically
• It is a PLANNING tool
• ALWAYS test on demo account first
📋 VERSION 8.0 — IMPROVEMENTS:
✅ Corrected calculations (accurate P&L)
✅ Improved speed (no freezing)
✅ Automatic symbol change detection
✅ Smart alerts (🚨 emoji for high risk)
✅ Precise tick rounding
💡 RECOMMENDED SETTINGS:
Forex: Risk 0.5-1%, Method: Structural Min
Acciones: Risk 1-2%, Method: ATR
Futures: Risk 0.5-1%, Method: Structural Min
Crypto: Risk 1-2%, Method: ATR
If you have questions, leave a comment. I respond regularly.
⭐ If this indicator helps your trading, boost it and share it.

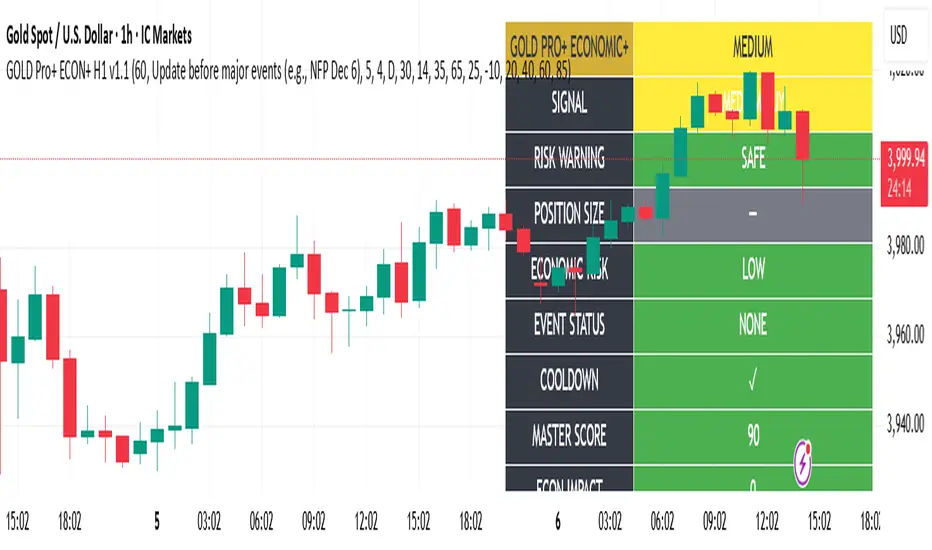
Gold Master Pro Plus ECONOMIC ENHANCED (H1 London v1.1)Overview
This indicator provides gold trading signals with integrated economic calendar awareness, specifically optimized for H1 timeframe and London session trading.
Methodology
The script analyzes multiple technical factors while monitoring economic event risks:
Technical Analysis Components:
RSI for momentum detection with configurable overbought/oversold levels
EMA crossovers (9, 21, 50 periods) for trend direction
MACD for momentum confirmation
ADX for trend strength measurement
Volume analysis for confirmation of price movements
Support/resistance detection using pivot points
Economic Calendar Integration:
Time-based detection of major economic releases (NFP, CPI, FOMC meetings)
Volatility assessment during event periods
USD stability monitoring through currency pair correlations
Automatic cooldown periods after high-impact events
Risk Management Features:
Multi-timeframe confirmation using daily trends
Session-aware scoring (London/NY overlap focus)
Quality-tiered signal classification
Position size recommendations based on signal strength and risk conditions
How to Use
Initial Setup:
Apply to XAUUSD on H1 timeframe
Configure economic settings in the inputs:
Enable economic event filter
Set ET offset (typically 5 hours for winter, 4 for summer)
Select relevant economic events to monitor
Signal Interpretation:
PLATINUM: All conditions aligned (active session, strong volume, low economic risk, trend confirmation)
HIGH: Most factors aligned with moderate risk
MEDIUM: Some factors aligned with acceptable risk
BLOCKED: High economic risk, cooldown period, or manual block active
Dashboard Metrics:
Economic risk level indicates current market safety
Event status shows timing of economic releases
Position size recommends appropriate trade sizing
Master score combines all technical and economic factors
Configuration Options
Economic Settings:
Economic impact threshold (30-80)
ET offset adjustment for timezone accuracy
Cooldown period configuration (2-24 bars)
Technical Settings:
RSI parameters (length, overbought/oversold levels)
Signal thresholds for different quality tiers
Session timing bonuses/penalties
Risk Management:
Multi-timeframe confirmation enable/disable
Higher timeframe selection (D, W, 4H, 12H)
MTF weight percentage (10-50%)
Important Notes
Economic event timing is approximate and should be verified with official economic calendars
Past performance does not guarantee future results
Trading involves substantial risk of loss
This tool is for educational purposes and should not be considered financial advice
The indicator is designed to assist in identifying potential trading opportunities while managing economic event risks through automated protection mechanisms.
Enterprise Digital Clock Pro# Enterprise Digital Clock Pro - User Documentation
## Overview
Enterprise Digital Clock Pro is a professional-grade trading indicator designed to provide real-time global market session monitoring directly on your chart. This comprehensive tool helps traders stay synchronized with international market hours, track multiple trading sessions simultaneously, and receive timely alerts for market transitions.
## Purpose & Benefits
### Why Use This Indicator?
- **Global Market Awareness**: Monitor up to 8 major financial markets simultaneously
- **Real-Time Updates**: Live clock with second-by-second precision
- **Session Management**: Know exactly when markets open, close, or enter pre/post-market sessions
- **Time Zone Flexibility**: Automatically handles time zone conversions
- **Professional Visualization**: Enterprise-grade display with multiple theme options
- **Trading Efficiency**: Never miss important market openings or closings with alert notifications
### Who Should Use This Indicator?
- International traders managing positions across multiple markets
- Day traders focusing on specific session overlaps
- Institutional traders requiring professional market monitoring
- Anyone trading across different time zones
- Traders seeking better timing for entry and exit points
## Features
### Core Functionality
1. **Real-Time Digital Clock**: Displays current time in your selected timezone with live updates
2. **Multi-Market Dashboard**: Track 8 major global markets simultaneously
3. **Market Status Indicators**: Visual indicators showing:
- LIVE (Market Open)
- CLOSED (Market Closed)
- PRE (Pre-Market)
- POST (After-Hours)
- WKND (Weekend)
4. **Time Until Change**: Shows remaining time until market opens or closes
5. **Alert System**: 5-minute warnings before market transitions
6. **Professional Themes**: Multiple pre-configured color schemes
## Configuration Guide
### 🎨 Theme Settings
#### Theme Preset
Choose from professionally designed themes:
- **Dark Professional**: Modern dark theme with high contrast (Default)
- **Light Corporate**: Clean, bright theme for well-lit environments
- **Bloomberg Terminal**: Classic financial terminal appearance
- **Trading Floor**: Professional trading desk aesthetic
- **Custom**: Create your own color scheme
### ⏰ Clock Settings
#### Local Timezone
Select your preferred timezone from extensive global options. The indicator supports all major financial centers including:
- Americas (New York, Chicago, Los Angeles, Toronto, São Paulo, etc.)
- Europe (London, Frankfurt, Paris, Madrid, Bucharest, etc.)
- Asia-Pacific (Tokyo, Shanghai, Hong Kong, Singapore, Sydney, etc.)
**Default**: Europe/Bucharest
#### Dashboard Position
Choose where the clock appears on your chart:
- Top Right (Default)
- Top Left
- Bottom Right
- Bottom Left
- Top Center
- Bottom Center
#### Clock Text Size
Adjust the main clock display size:
- Small
- Normal
- Large (Default)
#### Market Text Size
Control the size of market information text:
- Small
- Normal (Default)
- Large
### ✨ Visual Enhancements
#### Enable Gradient Effects
Adds subtle gradient transitions to enhance visual appeal
- **Default**: Enabled
#### Enable Shadow Effects
Creates depth with shadow effects for better readability
- **Default**: Enabled
#### Enable Animated Status Indicators
Provides dynamic visual feedback for market status changes
- **Default**: Enabled
#### Corner Radius
Adjust the roundness of dashboard corners (0-5)
- **Default**: 2
#### Border Style
Select the dashboard border appearance:
- None
- Subtle (Default)
- Professional
- Bold
### 🎨 Custom Colors
*Only active when "Custom" theme is selected*
- **Header Background**: Background color for the clock header
- **Header Text**: Text color for the clock display
- **Body Background**: Background color for market information
- **Body Text**: Text color for market listings
- **Accent Color**: Highlight color for important elements
- **Market Open**: Color indicating open markets
- **Market Closed**: Color indicating closed markets
- **Warning/Pre-Market**: Color for warnings and pre-market sessions
### 🌏 Market Display
Toggle visibility for each market:
- **Show Tokyo Market** (Default: On)
- **Show Shanghai Market** (Default: On)
- **Show Hong Kong Market** (Default: On)
- **Show Sydney Market** (Default: On)
- **Show London Market** (Default: On)
- **Show Frankfurt Market** (Default: On)
- **Show Bucharest Market** (Default: On)
- **Show NY Market** (Default: On)
- **Show Time Until Open/Close** (Default: On)
### Market Session Settings
Configure trading hours for each market in 24-hour format (HHMM-HHMM):
#### 🇯🇵 Tokyo Session
- **Trading Hours**: Set Tokyo Stock Exchange hours
- **Default (Winter)**: 0200-0800 (Bucharest time)
#### 🇨🇳 Shanghai Session
- **Trading Hours**: Set Shanghai Stock Exchange hours
- **Default (Winter)**: 0330-0900 (Bucharest time)
#### 🇭🇰 Hong Kong Session
- **Trading Hours**: Set Hong Kong Stock Exchange hours
- **Default (Winter)**: 0330-1000 (Bucharest time)
#### 🇦🇺 Sydney Session
- **Trading Hours**: Set Australian Securities Exchange hours
- **Default (Winter)**: 0100-0700 (Bucharest time)
#### 🇩🇪 Frankfurt Session
- **Trading Hours**: Set Frankfurt Stock Exchange hours
- **Default**: 0900-1830 (Bucharest time)
#### 🇷🇴 Bucharest Session
- **Trading Hours**: Set Bucharest Stock Exchange hours
- **Default**: 0930-1600 (Bucharest time)
#### 🇬🇧 London Session
- **Trading Hours**: Set London Stock Exchange hours
- **Default**: 1000-1830 (Bucharest time)
#### 🇺🇸 New York Session
- **Trading Hours**: Set NYSE/NASDAQ hours
- **Default**: 1630-2300 (Bucharest time)
## Usage Instructions
### Initial Setup
1. Add the indicator to your chart
2. Select your local timezone in Clock Settings
3. Choose your preferred theme or customize colors
4. Select which markets you want to monitor
5. Adjust display position and text sizes to your preference
6. Configure session times if different from defaults
### Reading the Display
The dashboard shows:
- **Top Row**: Current time in your selected timezone
- **Date Row**: Current date and timezone information
- **Market Rows**: Each selected market displays:
- Country flag
- Market name
- Status indicator (LIVE/CLOSED/PRE/POST/WKND)
- Current local time in that market
- Time until next status change (optional)
- **Footer**: Summary of active markets
### Status Indicators Explained
- **● LIVE**: Market is currently open for trading
- **○ CLOSED**: Market is closed
- **◐ PRE**: Pre-market session (1 hour before open)
- **◑ POST**: After-hours session (1 hour after close)
- **◉ WKND**: Weekend (market closed)
### Alert System
The indicator automatically generates alerts:
- 5-minute warning before market opening
- 5-minute warning before market closing
- Alerts appear once per bar to avoid spam
## Best Practices
### For Day Traders
- Focus on markets relevant to your trading pairs
- Use the "Time Until Change" feature to prepare for volatility
- Set alerts for session overlaps (highest liquidity periods)
### For Swing Traders
- Monitor major market opens for gap opportunities
- Track after-hours activity in relevant markets
- Use weekend status to plan Monday strategies
### For International Traders
- Keep all markets visible for complete global overview
- Adjust session times for daylight saving changes
- Use Custom theme to match your trading platform
## Troubleshooting
### Common Issues & Solutions
**Clock not updating:**
- Ensure your chart is on a live/real-time data feed
- Refresh your chart or switch timeframes
**Incorrect market status:**
- Verify session times are correctly configured
- Check if daylight saving time affects your settings
- Ensure weekend detection is working properly
**Display issues:**
- Try different position settings if overlapping with price action
- Adjust text sizes for better visibility
- Switch themes for better contrast
**Time zone confusion:**
- All session times should be entered in your local timezone
- The indicator automatically handles conversions
- Verify your selected timezone matches your actual location
## Tips for Optimal Use
1. **Session Overlap Trading**: The most volatile and liquid periods occur when major sessions overlap
2. **Pre-Market Preparation**: Use PRE status to prepare for market opens
3. **Weekend Planning**: Review weekly performance when all markets show WKND
4. **Mobile Trading**: Choose larger text sizes for mobile device visibility
5. **Multi-Monitor Setup**: Position dashboard on secondary monitors using corner options
## Performance Notes
- The indicator updates in real-time without requiring chart refreshes
- Minimal resource usage ensures smooth chart performance
- Compatible with all timeframes and chart types
- Works seamlessly with other indicators
## Conclusion
Enterprise Digital Clock Pro transforms your trading chart into a professional command center for global market monitoring. Whether you're trading forex during London-New York overlap, catching the Asian session, or monitoring international equities, this indicator ensures you're always synchronized with global markets.
Stay informed, trade professionally, and never miss important market transitions with Enterprise Digital Clock Pro.

Dynamic FVG & Trap Zones📘 Dynamic FVG & Trap Zones (DFTZ)
A Hybrid Model Combining Imbalance Mapping, Volume Behavior, and Trap Detection
Concept Overview
“Dynamic FVG & Trap Zones” is built to visualize real-time Fair Value Gaps (FVGs) and identify liquidity trap events inside those gaps using adaptive volume filters and wick-based logic.
Traditional FVG indicators merely mark imbalance zones between consecutive candles, but this model goes further — it measures how volume reaction and price penetration inside those zones reveal potential f alse moves or trap formations by smart money.
⚙️ How It Works
1. FVG Detection
• A Bullish FVG is detected when low > high , showing a price void left by aggressive buying.
• A Bearish FVG forms when high < low , implying a selling imbalance.
• These zones are automatically drawn as semi-transparent boxes that extend forward for 10 bars and decay once they exceed the configurable lookback window.
2. Volume Normalization & Grading
• Every bar’s volume is compared against a dynamic SMA( volLookback ) average to calculate a Volume Grade = current vol / avg vol.
• Only bars exceeding the Min Volume Grade threshold are eligible to generate valid FVG zones, ensuring that low-participation moves are ignored.
• The Trap Volume Threshold sets how quiet the reaction bar must be (relative to average volume) to qualify as a trap event.
3. Trap Detection Logic
• Each active FVG zone monitors incoming candles.
• A potential trap is triggered when price re-enters the zone (body or wick depending on settings) but fails to expand with confirming volume.
• If the event occurs inside a Bullish FVG, it marks a Bear Trap (green zone turned red).
If it happens inside a Bearish FVG, it flags a Bull Trap (red zone turned green).
• This reversal in zone color visually conveys trapped liquidity and potential directional fade.
4. Exclusivity and Cooldown Control
• To avoid signal clustering, you can choose exclusivity modes:
Allow Both, Bear over Bull, or Bull over Bear.
• A built-in per-signal cooldown timer prevents back-to-back plots of the same type, enhancing signal clarity during rapid price action.
5. Adaptive Visualization
• Wick-based vs body-based trap detection (toggleable).
• Optional cooldown filtering on shapes ensures the chart only displays validated events.
• Old FVG boxes are pruned automatically beyond the chosen lookback horizon.
🧠 Why It’s Different
Unlike static FVG detectors or simple liquidity sweep tools, DFTZ blends:
• Volume context (Smart Volume Grade filtering)
• Behavioral trap detection within imbalance zones
• Dynamic cooldown mechanics that control over-signaling
• Forward-propagating zones that self-expire gracefully
This synergy makes it a compact yet powerful tool for visualizing imbalances + liquidity traps in one framework — ideal for discretionary traders combining SMC concepts with volume analytics.
📈 How to Use
• Primary Context: Use on 15 min to 1 h charts to spot active FVG zones forming after impulsive moves.
• Trap Signal Interpretation:
• 🔴 “Trap” below bar → Bullish reversal (Bear Trap).
• 🟢 “Trap” above bar → Bearish reversal (Bull Trap).
• Combine With: Market structure breaks, VWAP, or delta volume tools to confirm true reversal intent.
• Alerts: All major events (FVG creation & trap confirmation) trigger ready-to-use alerts for automation or back-testing.
🧩 Customization
Setting Function
Max FVG Lookback Controls how long old zones remain active.
Volume SMA Period Defines the baseline for volume grading.
Min Volume Grade & Trap Volume Threshold Tune the sensitivity of trap confirmation.
Wick-Based Trap Detection Enable to capture wick rejections inside zones.
Signal Cooldown Prevents rapid multiple plots on successive bars.
⚠️ Disclaimer
This tool is designed for educational and analytical purposes only. It does not constitute financial advice or guarantee trading performance. Always conduct your own analysis and risk management before entering a position.

Rolling VWAP Indicator🧭 Rolling VWAP Indicator
Overview
The Rolling VWAP Signals indicator offers a clean, real-time view of price behavior relative to its volume-weighted fair value.
It extends the traditional VWAP concept by introducing a Rolling VWAP that continuously adapts over a dynamic window of recent bars, allowing traders to visualize evolving equilibrium zones without being limited to daily or session resets.
Additionally, it includes a Multi-Timeframe (MTF) Trend Bias Filter — designed not to recalculate VWAP across timeframes, but to confirm directional alignment with higher-timeframe momentum. This ensures that short-term signals are traded only when the broader bias agrees, reducing false reversals and improving signal quality.
VWAP vs Rolling VWAP
The Volume-Weighted Average Price (VWAP) is one of the most widely used institutional benchmarks.
It represents the average traded price weighted by volume — effectively the market’s “fair value.”
However, standard VWAP resets each day or session, losing continuity across time and ignoring cumulative order flow beyond that session.
The Rolling VWAP used here continuously recalculates over a moving window of the most recent bars:
• It adapts naturally to 24×7 markets such as crypto and indices.
• It reflects the current consensus of price and volume rather than starting from zero each morning.
• It acts as a dynamic fair-value magnet, showing when price deviates too far from equilibrium.
In short:
• Standard VWAP → resets daily, suited for intraday benchmarks.
• Rolling VWAP → continuous measure of short-term market balance and sentiment.
How It Works
1. Rolling VWAP Calculation
Uses the last N bars (auto-adjusted by timeframe: e.g., 288 for 5-min, 96 for 15-min, 24 for 1-hour) to compute the continuously weighted mean price:
RVWAP = \frac{\sum(Price \times Volume)}{\sum(Volume)}
2. VWAP Bands
Three deviation envelopes are plotted above and below RVWAP at user-defined percentages — visual zones of overbought/oversold or expansion/compression.
3. Signal Logic
• Buy Signal: price closes above the Rolling VWAP after being below (bullish reclaim).
• Sell Signal: price closes below the Rolling VWAP after being above (bearish rejection).
• Cooldown Period: blocks repeated signals within a set bar interval to avoid whipsaws.
4. MTF Trend Bias
• Pulls higher-timeframe trend direction (e.g., from 1-hour while trading 5-min).
• Signals are confirmed only when short-term cross aligns with higher-timeframe bias.
• This filter does not modify or recalculate the VWAP — it purely acts as a directional validator.
5. Session Filter
Restrict signal generation to defined trading hours and timezone (e.g., 09:30–13:00 NY). Its for US market positional traders.
6. Dashboard Panel
Displays system states: data sufficiency, session activity, VWAP bias, cooldown status, and Buy/Sell signal triggers.
Why It’s Useful
• Provides a real-time adaptive fair-value anchor instead of static daily VWAP.
• Highlights both trend continuation and mean-reversion zones.
• Integrates MTF bias confirmation to trade only in line with higher-timeframe flow.
• Eliminates clutter — no oscillators or complex models, just price vs volume behavior.
How to Use
1. Apply on any timeframe (5M–4H).
2. Observe Buy (green) and Sell (red) signals relative to the blue Rolling VWAP line.
3. Enable MTF Trend Bias to confirm signals with higher-timeframe direction.
4. Use deviation bands for identifying overextended conditions or pullback opportunities.
5. Monitor the dashboard for live system feedback.
Customization
• Auto or manual Rolling VWAP window.
• Adjustable band multipliers.
• MTF bias confirmation toggle.
• Session and timezone settings.
• Dashboard size and placement.
Conceptual Takeaway
The Rolling VWAP Simple Signals indicator combines the strength of volume-weighted mean reversion with higher-timeframe directional filtering, producing clear, context-aware entries and exits.
It answers two critical trader questions:
“Where is the real, volume-based fair value right now?”
“Does my signal align with the larger trend?”
⚠️ Disclaimer
This indicator is designed s olely for educational and analytical purposes . It does not constitute financial advice, investment recommendation, or trading signal service. Trading involves substantial risk and may not be suitable for all investors. Always perform your own analysis and use proper risk management before taking any trade. The author assumes no liability for financial losses resulting from the use or interpretation of this tool.

Power Bar [MMT]Identify and trade powerful market thrusts with precision. Power Bar detects high-momentum bullish and bearish candles that break recent support or resistance, combine proximity to a key moving average, and offer automated multi-TP trade management.
Features
Power Bar Detection : Spots large-bodied candles (relative to ATR) with minimal opposing wicks, originating near the 20 SMA, and breaking key support/resistance zones.
Fully Configurable : Adjust ATR length/multiplier, wick size ratio, SMA proximity, display style (most recent/historical) and more.
SMA Overlay : Optionally plot configurable SMA for context with proximity checks.
Support/Resistance Lines : Detect and visualize dynamic S/R based on recent swing highs/lows, with customizable lookback, style, color, and tolerance.
Trade Managemen t: Automated lines and labels for entry, stop loss, and up to three profit targets (ATR or risk multiples). Choose display mode and extend historical trades.
Visual Alerts : Color-coded bar highlights, up/down arrow label overlays, customizable colors for bullish/bearish power bars.
Use Cases
Rapidly spot and respond to strong market moves, often signaling trend initiation or continuation.
Integrate with multi-timeframe setups, momentum strategies, and discretionary trading.
Set up actionable alerts when a power bar triggers in real time.
Inputs
ATR length and multiplier
Wick ratio and SMA proximity
Support/resistance lookback, tolerance, style, color
Trade management toggle and TP calculation modes
Historical/max recent bars/trades limit controls
Alerts
Alert conditions for bullish, bearish, and any power bar event, supporting automated trading workflows.
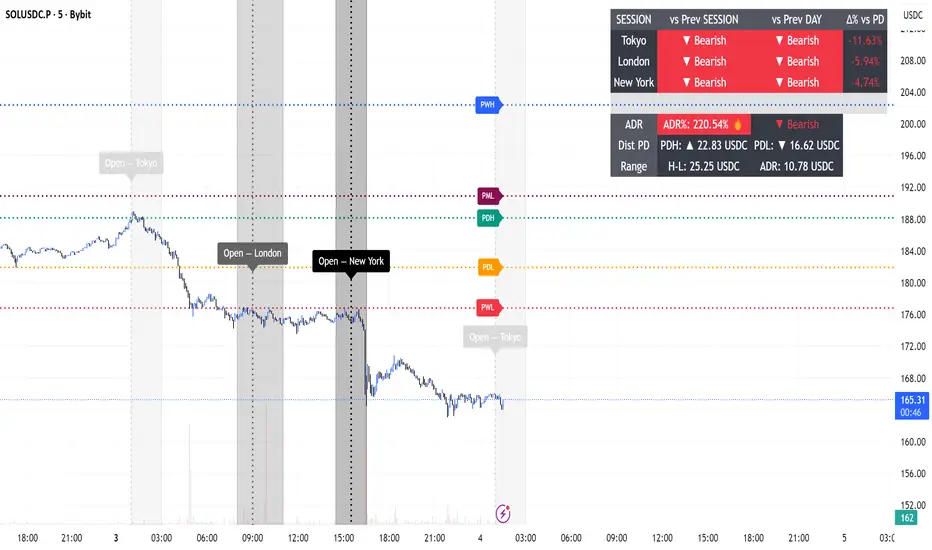
Session Engine — Market Opens, Killzones & Levels — SMC/ICTSession Engine — Market Opens, Killzones & Institutional Levels (Tokyo • London • New York) — SMC/ICT — TradingATH (PueblaATH)
Precision. Sessions. Structure.
Session Engine maps the institutional heartbeat of the day across Tokyo , London , and New York . It draws timezone-accurate Market Open Lines , clean Killzones (incl. London–NY overlap), and a rock-solid, timeframe-safe suite of Previous High/Low Levels (PDH/PDL/PWH/PWL/PMH/PML). On top, a compact Session Comparison Table with an integrated ADR panel shows extension, momentum context, and distance to key levels — at a glance.
Designed for SMC/ICT Traders who demand clarity and reliability, this tool stays stable when you change timeframe, reload, or zoom.
Map the day like a Pro : timezone-true Opens, configurable Killzones, TF-safe PDH/PDL/PWH/PWL/PMH/PML , and a sleek ADR panel beneath a Session Comparison Table . Built for precision SMC/ICT Execution . Zero flicker, full control.
Why Traders Love It
Timezone-Accurate Session Engine — Tokyo, London, New York opens and the London–NY overlap, all resolved to bar-time for precise plotting on any symbol.
Killzones you can trust — choose full-column height or price-bounded height with custom top/bottom tick offsets and label placement.
Bulletproof Previous Levels — PDH, PDL, PWH, PWL, PMH, PML are cached and only refresh on true D/W/M boundaries, eliminating the classic “levels disappear on TF change” problem.
Actionable Context — a compact Session Comparison Table (vs previous session & vs previous day) plus an ADR panel with extension thresholds, distance to PDH/PDL, and current H-L range.
Serious Customization — dotted/solid lines, widths, label size & alignment, auto label backgrounds, block transparency, weekend & timeframe filters, and more.
Performance-Minded — persistent objects are updated in place (not spam-created) to keep your chart crisp and responsive.
What You’ll See
Market Opens — Vertical opens for TOK/LDN/NY with dotted/solid styling, width control, infinite or bounded height, and optional labels.
Killzones + Overlap — Transparent time boxes for session windows (and London–NY overlap). Optional labels, adjustable transparency, and height mode.
Institutional Levels — PDH / PDL / PWH / PWL / PMH / PML with length modes: Infinite, N bars, or End of day. Optional labels with typographic control.
Session Comparison Table — For each session: bias vs previous session and previous day, with optional Δ% column.
ADR Panel — 24h rolling ADR% consumption with two attention thresholds, distance to PDH/PDL (price units), and current H-L range.
How It Works
Session Timing uses explicit IANA timezones (Asia/Tokyo, Europe/London, America/New_York) then anchors to bar_time for pixel-perfect placement.
Killzones are persistent boxes that reset only on daily change, preventing redundant object creation.
Previous Levels are requested once per true period roll (D/W/M) and stored locally; this cache keeps lines stable when switching TFs or reloading charts.
Level Line Length is enforced per-object (Infinite, N bars, End of day) with dynamic x2 handling — no redraw flicker.
ADR uses a timeframe-agnostic 24h rolling window for H/L/range; ADR length is defined in “days” and mapped to bars for any timeframe.
How to Use
Set Session Times (defaults are standard). Adjust the London–NY overlap if your venue differs.
Style your Opens & Killzones — line width, dotted/solid, infinite or bounded height, label font size/align/background.
Choose Level Behavior — Infinite, N bars, or End of day for PD/ PW / PM lines; toggle labels as needed.
Read the Table and ADR — quick bias vs previous session/day, Δ% if you enable it; ADR panel highlights extension with blink thresholds and shows live distance to PDH/PDL.
Inputs
Schedules — Open times + killzone windows for TOK/LDN/NY, and London–NY overlap.
Style — Line width, dotted/solid, label sizes & alignment, auto backgrounds.
Heights — Infinite or tick-bounded line height; full-column or tick-bounded killzones.
Levels — Show/hide PDH/PDL/PWH/PWL/PMH/PML; length mode; label options.
Table & ADR — Font size, arrows, Δ% column, ADR length (days), blink thresholds, show/hide rows.
Filters — Hide visuals on specified timeframe ranges; optional weekend suppression.
Best Practices
Use “End of day” for tidy level lines that still convey right-hand context.
Set ADR thresholds to your instrument’s personality (e.g., 80/120 for FX, 100/150 for crypto).
On exotic trading sessions, verify the IANA timezone alignment and tweak inputs accordingly.
If you stack many tools, consider disabling unused sessions/rows to stay within object limits.
What Makes It Original
A cohesive Session Engine architecture that unifies timezone-true Opens, configurable Killzones/Overlap, and TF-safe previous levels — tailored for SMC/ICT execution.
Robust caching that eliminates TF-switch flicker and preserves dependent calculations (distance to PDH/PDL, ADR%) without gaps.
A unified ADR panel directly under the session table with real-time extension signaling and distance-to-PDH/PDL — pragmatic, trade-ready context you won’t find in generic session scripts.
Deep length & typography controls so visuals are informative and elegant.
Notes & Disclaimer (Originality & Rights)
Original Work Notice — Please read — This script/indicator is an original work created exclusively by TradingATH ( PueblaATH ). It is not derived from, copied from, or authored by any other person or entity. Any resemblance to other scripts is coincidental and limited to the use of public and widely known trading concepts.
Usage & Publication — Redistribution, cloning, or republishing this script (in whole or in part) without the explicit written permission of TradingATH ( PueblaATH ) is prohibited. By using this tool, you acknowledge the author’s exclusive authorship and associated rights.
No Financial Advice — This tool is for educational/informational purposes only and does not constitute financial advice. Markets carry risk; manage your risk and make your own decisions.
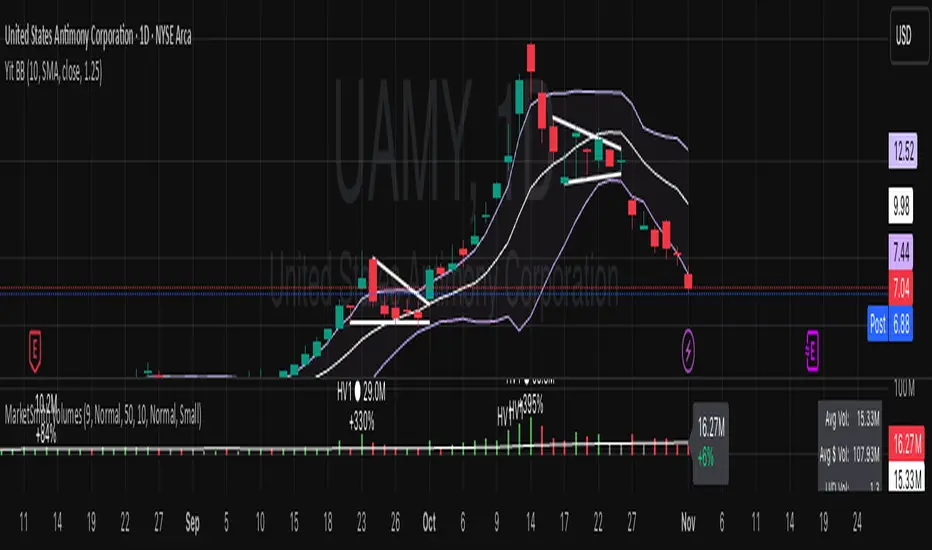
Yit BBIn this script the deviation is 1.25 the normal standard issue Bollinger band indicator uses 2. for my type of trading I don't have time price action to wait for a 2 STDRD DEV. this is a more aggressive type of indicator.
The MA is the 10 day.