[Smith] VWAP Deviation + VWAP Deviation +
Short Description:
Advanced VWAP indicator with deviation bands, smart signal filtering, and session-based performance tracking. Features log-space scaling, RSI confirmation, volume filters, and market regime detection.
Full Description:
The VWAP Deviation + is a comprehensive trading indicator that combines Volume Weighted Average Price (VWAP) analysis with advanced signal filtering to identify high-probability trade opportunities. This indicator goes beyond basic VWAP by incorporating multiple confirmation layers and intelligent market analysis.
🎯 Key Features
Core VWAP Analysis:
- Custom volume-weighted mean calculation with deviation bands (2σ and 3σ)
- Optional log-space scaling for proportional price movements
- Real-time VWAP line with customizable visibility
Smart Signal Detection:
- RSI confirmation for all trade signals
- Volume filter requiring above-average trading activity
- Market regime detection (trending vs ranging markets)
- Optional RSI divergence analysis
Advanced Filtering:
- Multi-condition signal validation
- Session-based performance tracking (Asian, London, NY)
- Real-time win rate calculation
- Strong vs regular signal classification
Visual Features:
- Clean, professional interface with customizable colors
- Optional signal shapes and annotations
- Performance statistics table
- Filled deviation bands for easy visualization
📊 How It Works
The indicator identifies trade opportunities when:
1. Price touches VWAP deviation bands (2σ or 3σ)
2. RSI confirms oversold/overbought conditions
3. Volume exceeds the specified threshold
4. Market regime conditions are favorable
Signal Types:
- LONG : Price at lower bands + RSI oversold + volume confirmation
- SHORT : Price at upper bands + RSI overbought + volume confirmation
- STRONG : Same conditions but at 3σ bands for higher conviction trades
⚙️ Customization Options
Core Settings:
- VWAP length and source selection
- Adjustable deviation multipliers
- Log-space scaling toggle
Signal Filters:
- RSI length and threshold levels
- Volume filter with customizable multiplier
- Market type filtering options
Advanced Features:
- Session statistics tracking
- RSI divergence detection
- Market regime analysis
Visual Controls:
- Show/hide individual components
- Custom color schemes
- Signal display toggles
🔔 Alert System
Built-in alerts for:
- Long and short trade opportunities
- Strong signal confirmations
- RSI divergence signals
💡 Best Practices
- Use higher timeframes (15m+) for more reliable signals
- Combine with additional confirmation indicators
- Pay attention to session statistics for timing optimization
- Monitor market regime indicators for context
This indicator is suitable for day traders, swing traders, and anyone looking to improve their VWAP-based trading strategies with advanced filtering and market analysis.
Göstergeler ve stratejiler

Math by Thomas - SMC Structure Toolkit – OB + FVG + CHoCH/BoS📌 Description:
A complete Smart Money Concepts (SMC) market structure toolkit designed to help traders identify high-probability institutional activity using fractals, order blocks, fair value gaps, and structure shifts.
This tool combines several key SMC components to provide clear, actionable insights for both trend continuation and reversals.
🛠 Key Features:
✅ Order Blocks (OBs): Detected using fractal swing highs/lows, optional high volume & displacement candle filters
✅ Midline OB Visuals: Optional dashed lines drawn through the midpoint of each OB
✅ Fair Value Gaps (FVGs): Auto-detected based on classic gap criteria
✅ CHoCH & BoS Labeling: Real-time swing structure labeling with trend tracking
✅ Premium/Discount Zones: Highlighted zones for optimal entries in trending environments
✅ User Toggles: Turn OBs, FVGs, or midlines on/off for a cleaner chart
📈 How to Use:
Apply the indicator to your chart (best on 15m, 1h, or higher)
Enable/disable features in the settings panel:
Order Blocks: Use with displacement & high volume filters for cleaner setups
FVGs: Spot imbalances between price and liquidity
Structure Labels: Follow BoS/CHoCH signals to track trend changes
Look for:
CHoCH ➝ potential trend reversal
BoS ➝ trend continuation confirmation
OBs within discount/premium zones ➝ high-RR trade setups
Combine with your existing SMC or supply/demand approach
🧪 Best Timeframes:
Recommended: 15m, 1h, 4h, Daily
Works on any timeframe but more reliable with higher volume context
✍️ Notes:
Built using fractal logic and volume filters for cleaner signals
Designed to complement SMC strategies, not replace analysis

RSI of RSI Deviation (RoRD)RSI of RSI Deviation (RoRD) - Advanced Momentum Acceleration Analysis
What is RSI of RSI Deviation (RoRD)?
RSI of RSI Deviation (RoRD) is a insightful momentum indicator that transcends traditional oscillator analysis by measuring the acceleration of momentum through sophisticated mathematical layering. By calculating RSI on RSI itself (RSI²) and applying advanced statistical deviation analysis with T3 smoothing, RoRD reveals hidden market dynamics that single-layer indicators miss entirely.
This isn't just another RSI variant—it's a complete reimagining of how we measure and visualize momentum dynamics. Where traditional RSI shows momentum, RoRD shows momentum's rate of change . Where others show static overbought/oversold levels, RoRD reveals statistically significant deviations unique to each market's character.
Theoretical Foundation - The Mathematics of Momentum Acceleration
1. RSI² (RSI of RSI) - The Core Innovation
Traditional RSI measures price momentum. RoRD goes deeper:
Primary RSI (RSI₁) : Standard RSI calculation on price
Secondary RSI (RSI²) : RSI calculated on RSI₁ values
This creates a "momentum of momentum" indicator that leads price action
Mathematical Expression:
RSI₁ = 100 - (100 / (1 + RS₁))
RSI² = 100 - (100 / (1 + RS₂))
Where RS₂ = Average Gain of RSI₁ / Average Loss of RSI₁
2. T3 Smoothing - Lag-Free Response
The T3 Moving Average, developed by Tim Tillson, provides:
Superior smoothing with minimal lag
Adaptive response through volume factor (vFactor)
Noise reduction while preserving signal integrity
T3 Formula:
T3 = c1×e6 + c2×e5 + c3×e4 + c4×e3
Where e1...e6 are cascaded EMAs and c1...c4 are volume-factor-based coefficients
3. Statistical Z-Score Deviation
RoRD employs dual-layer Z-score normalization :
Initial Z-Score : (RSI² - SMA) / StDev
Final Z-Score : Z-score of the Z-score for refined extremity detection
This identifies statistically rare events relative to recent market behavior
4. Multi-Timeframe Confluence
Compares current timeframe Z-score with higher timeframe (HTF)
Provides directional confirmation across time horizons
Filters false signals through timeframe alignment
Why RoRD is Different & More Sophisticated
Beyond Traditional Indicators:
Acceleration vs. Velocity : While RSI measures momentum (velocity), RoRD measures momentum's rate of change (acceleration)
Adaptive Thresholds : Z-score analysis adapts to market conditions rather than using fixed 70/30 levels
Statistical Significance : Signals are based on mathematical rarity, not arbitrary levels
Leading Indicator : RSI² often turns before price, providing earlier signals
Reduced Whipsaws : T3 smoothing eliminates noise while maintaining responsiveness
Unique Signal Generation:
Quantum Orbs : Multi-layered visual signals for statistically extreme events
Divergence Detection : Automated identification of price/momentum divergences
Regime Backgrounds : Visual market state classification (Bullish/Bearish/Neutral)
Particle Effects : Dynamic visualization of momentum energy
Visual Design & Interpretation Guide
Color Coding System:
Yellow (#e1ff00) : Neutral/balanced momentum state
Red (#ff0000) : Overbought/extreme bullish acceleration
Green (#2fff00) : Oversold/extreme bearish acceleration
Orange : Z-score visualization
Blue : HTF Z-score comparison
Main Visual Elements:
RSI² Line with Glow Effect
Multi-layer glow creates depth and emphasis
Color dynamically shifts based on momentum state
Line thickness indicates signal strength
Quantum Signal Orbs
Green Orbs Below : Statistically rare oversold conditions
Red Orbs Above : Statistically rare overbought conditions
Multiple layers indicate signal strength
Only appear at Z-score extremes for high-conviction signals
Divergence Markers
Green Circles : Bullish divergence detected
Red Circles : Bearish divergence detected
Plotted at pivot points for precision
Background Regimes
Green Background : Bullish momentum regime
Grey Background : Bearish momentum regime
Blue Background : Neutral/transitioning regime
Particle Effects
Density indicates momentum energy
Color matches current RSI² state
Provides dynamic market "feel"
Dashboard Metrics - Deep Dive
RSI² ANALYSIS Section:
RSI² Value (0-100)
Current smoothed RSI of RSI reading
>70 : Strong bullish acceleration
<30 : Strong bearish acceleration
~50 : Neutral momentum state
RSI¹ Value
Traditional RSI for reference
Compare with RSI² for acceleration/deceleration insights
Z-Score Status
🔥 EXTREME HIGH : Z > threshold, statistically rare bullish
❄️ EXTREME LOW : Z < threshold, statistically rare bearish
📈 HIGH/📉 LOW : Elevated but not extreme
➡️ NEUTRAL : Normal statistical range
MOMENTUM Section:
Velocity Indicator
▲▲▲ : Strong positive acceleration
▼▼▼ : Strong negative acceleration
Shows rate of change in RSI²
Strength Bar
██████░░░░ : Visual power gauge
Filled bars indicate momentum strength
Based on deviation from center line
SIGNALS Section:
Divergence Status
🟢 BULLISH DIV : Price making lows, RSI² making highs
🔴 BEARISH DIV : Price making highs, RSI² making lows
⚪ NO DIVERGENCE : No divergence detected
HTF Comparison
🔥 HTF EXTREME : Higher timeframe confirms extremity
📊 HTF NORMAL : Higher timeframe is neutral
Critical for multi-timeframe confirmation
Trading Application & Strategy
Signal Hierarchy (Highest to Lowest Priority):
Quantum Orb + HTF Alignment + Divergence
Highest conviction reversal signal
Z-score extreme + timeframe confluence + divergence
Quantum Orb + HTF Alignment
Strong reversal signal
Wait for price confirmation
Divergence + Regime Change
Medium-term reversal signal
Monitor for orb confirmation
Threshold Crosses
Traditional overbought/oversold
Use as alert, not entry
Entry Strategies:
For Reversals:
Wait for Quantum Orb signal
Confirm with HTF Z-score direction
Enter on price structure break
Stop beyond recent extreme
For Continuations:
Trade with regime background color
Use RSI² pullbacks to center line
Avoid signals against HTF trend
For Scalping:
Focus on Z-score extremes
Quick entries on orb signals
Exit at center line cross
Risk Management:
Reduce position size when signals conflict with HTF
Avoid trades during regime transitions (blue background)
Tighten stops after divergence completion
Scale out at statistical mean reversion
Development & Uniqueness
RoRD represents months of research into momentum dynamics and statistical analysis. Unlike indicators that simply combine existing tools, RoRD introduces several genuine innovations :
True RSI² Implementation : Not a smoothed RSI, but actual RSI calculated on RSI values
Dual Z-Score Normalization : Unique approach to finding statistical extremes
T3 Integration : First RSI² implementation with T3 smoothing for optimal lag reduction
Quantum Orb Visualization : Revolutionary signal display method
Dynamic Regime Detection : Automatic market state classification
Statistical Adaptability : Thresholds adapt to market volatility
This indicator was built from first principles, with each component carefully selected for its mathematical properties and practical trading utility. The result is a professional-grade tool that provides insights unavailable through traditional momentum analysis.
Best Practices & Tips
Start with default settings - they're optimized for most markets
Always check HTF alignment before taking signals
Use divergences as early warning , orbs as confirmation
Respect regime backgrounds - trade with them, not against
Combine with price action - RoRD shows when, price shows where
Adjust Z-score thresholds based on market volatility
Monitor dashboard metrics for complete market context
Conclusion
RoRD isn't just another indicator—it's a complete momentum analysis system that reveals market dynamics invisible to traditional tools. By combining momentum acceleration, statistical analysis, and multi-timeframe confluence with intuitive visualization, RoRD provides traders with a sophisticated edge in any market condition.
Whether you're scalping rapid reversals or positioning for major trend changes, RoRD's unique approach to momentum analysis will transform how you see and trade market dynamics.
See momentum's future. Trade with statistical edge.
Trade with insight. Trade with anticipation.
— Dskyz, for DAFE Trading Systems

QQE On ChartQQE On Chart – Visual QQE Crossover Indicator
This indicator implements the Quantitative Qualitative Estimation (QQE) algorithm directly on the price chart.
Unlike traditional QQE implementations that are plotted as a separate oscillator, this version maps QQE Fast and QQE Slow signals as visual lines near the price action, allowing for cleaner and faster signal interpretation.
What it does:
Calculates smoothed RSI (using EMA) and its volatility (ATR of RSI changes).
Constructs upper and lower bands (QQE Slow) based on the smoothed QQE Fast line and dynamic ATR.
Displays BUY/SELL signals when the QQE Fast line crosses the QQE Slow band.
Signals are plotted as labels directly below/above the candles.
Why it's useful:
The proximity to price makes this QQE implementation very intuitive for price-action traders.
The smoothing and crossover logic help identify shifts in momentum and trend continuation.
Unique elements:
Overlay on chart with dynamic offset for better readability.
Built-in alerts for real-time trading reaction.
Optional signal markers can be enabled or disabled.
Best used for:
Momentum trading
Trend confirmation
Identifying reversal or breakout zones
Parameters:
RSI Length: Base RSI calculation period
Smoothing Factor: EMA applied to RSI
Offset from Price: Controls distance of QQE lines from price

HOG Liquidity ZonesHOG Liquidity Zones (Swings & Sweeps)
📊 Overview
A precision tool for visualizing key liquidity zones formed by swing highs and lows. It tracks tap counts, volume strength, and identifies directional sweep targets, giving traders a visual edge in spotting high-probability reaction zones.
⚙️ How It Works
• Identifies swing highs/lows using pivot logic
• Plots colored zones based on wicks or full ranges
• Tracks volume or count of price taps to validate zones
• Optional debounce and body-only tap filters
• Zones invalidate when fully broken by candle closes
• Imbalance zones highlight key displacement gaps
• “NEXT” marker shows likely sweep direction
🎯 Inputs
• Pivot Lookback Length
• Tap Debounce & Body-Only Filters
• Filter Type (Tap Count or Volume)
• Invalidate on Close Toggle
• Imbalance Zone Display
• Custom Label Size & Text Size
✅ Benefits
• Clearly shows where liquidity pools have formed
• Adapts to both structure and trap-based strategies
• Tap tracking helps gauge zone strength
• Useful for identifying magnets, rejections, and sweeps
• Clean, non-intrusive visuals
📈 Use Cases
• Target stop hunts or liquidity sweeps
• Confirm high-traffic areas before entries
• Combine with trend overlays or breakout tools
• Trade toward the next “NEXT” target zone
⚠️ Notes
• Zones remain active until invalidated or swept
• Tap logic can be customized for conservative or aggressive bias
• Imbalance boxes are optional and highlight displacement candles
• This tool is for visual context — not a signal engine

MOM Buy/Sell + MACD Histogram Signal TableThis gives you a bullish and bearish buy signal based on macd crossing 0 level and macd crossing signal line...and it gives sell signal the first time after a buy signal price closes across the 13 ema. It also gives a table on what the macd histogram is doing on multiple time frames so you know where the momentum is.

SMT + CISD Detector | NQ✅ Features
Detects bullish and bearish SMT using ES1! vs NQ.
Scans multiple timeframes: 1m, 5m, 15m, 1H.
Displays SMT & CISD checklist in a live dashboard table on your chart.
Clean, no clutter — no plots or shapes, just detection logic + checklist.
Designed specifically for trading NQ.

QQE MOD Elite (RSI Simple Signal)QQE MOD Elite (RSI Simple Signal)
📊 Overview
A clean, minimal version of the QQE concept that smooths RSI data and only highlights overbought and oversold extremes. Designed for traders who want to track exhaustion zones without clutter or noise.
⚙️ How It Works
• Calculates a smoothed RSI using an EMA
• Line color is neutral by default (white)
• Turns aqua above Overbought (70)
• Turns fuchsia below Oversold (30)
• OB/OS boundaries marked with dashed gray lines
• Optional light gray fill between 30–70 zone
🎯 Inputs
• RSI Length
• QQE Smoothing
• Overbought Level
• Oversold Level
✅ Benefits
• Simple, intuitive visual cue for momentum extremes
• Zero noise in neutral or trending zones
• Keeps charts clean and focused
• Fast-read confirmation for fade or exit conditions
• Works well with trend, volume, or crossover overlays
📈 Use Cases
• Spot potential pullback or fade areas
• Confirm exhaustion before exit
• Companion tool for swing or intraday setups
• Useful OB/OS visualization layer for minimal systems
⚠️ Notes
• Not a trade signal generator
• OB/OS thresholds are adjustable based on asset or timeframe
• Best used as a visual companion—not standalone strategy

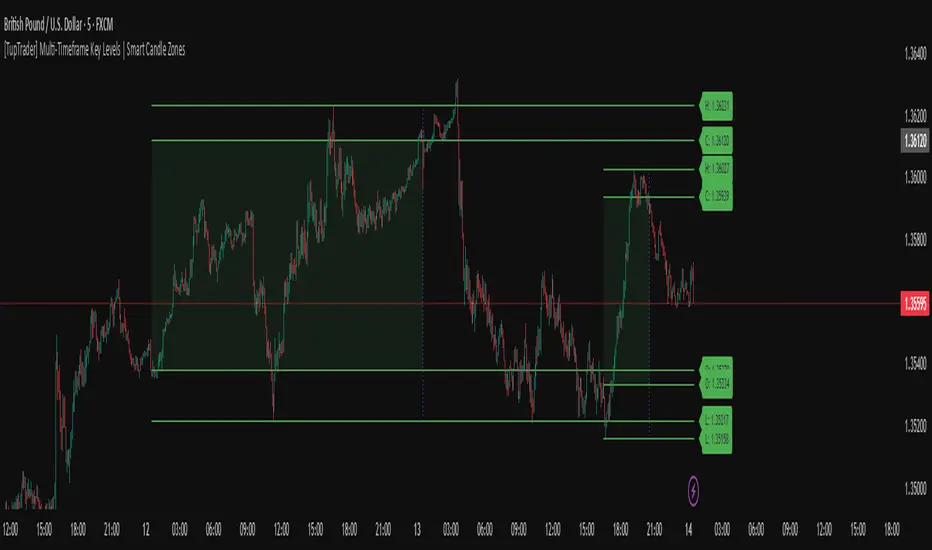
[TupTrader] Multi-Timeframe Key Levels | Smart Candle Zones
**Multi-Timeframe Key Levels | Smart Candle Zones**
Unlock the power of smart price levels with Multi-Timeframe Key Levels – a precision tool for traders who rely on higher timeframe structure.
🧠 This indicator automatically plots the key levels (Open, High, Low, Close) and optional body/fibonacci levels of the *previous candle* from two customizable higher timeframes, directly onto your lower timeframe chart.
💡 Recommended settings:
- 4H + Daily on 5-Minute Chart
- 8H + 1H on 1-Minute Chart
📈 Ideal for:
- Scalping around structure levels
- Day trading with HTF context
- Confirmation of breakout, retest, or rejection patterns
✅ Features:
- Dual reference timeframes
- Auto-adjusting line lengths
- Live price labels (e.g. H: 4321.50)
- Choice between body or Fibonacci zones
- Candle box visualization of HTF structure
🚨 Alerts:
- Alert when price touches any HTF key level
Lightweight and customizable, this tool is a must-have for intraday and structure-based traders.
Dynamic Flow Ribbons [BigBeluga]🔵 OVERVIEW
A dynamic multi-band trend visualization system that adapts to market volatility and reveals trend momentum with layered ribbon channels.
Dynamic Flow Ribbons transforms price action into flowing trend bands that expand and contract with volatility. It not only shows the active directional bias but also visualizes how strong or weak the trend is through layered ribbons, making it easier to assess trend quality and structure.
🔵 CONCEPTS
Uses an adaptive trend detection system built on a volatility envelope derived from an EMA of the average price (HLC3).
Measures volatility using a long-period average of the high-low range, which scales the envelope width dynamically.
Trend direction flips when the average price crosses above or below these envelopes.
Ribbons form around the trend line to show how far price is stretching or compressing relative to the mean.
🔵 FEATURES
Volatility-Based Trend Line:
A thick, color-coded line tracks the current trend with smoother transitions between phases.
Multi-Layered Flow Ribbons:
Up to 10 bands (5 above and 5 below) radiate outward from the upper and lower envelopes, reflecting volatility strength and direction.
Trend Coloring & Transitions:
Ribbons and candles are dynamically colored based on trend direction— green for bullish , orange for bearish . Transparency fades with distance from the core trend band.
Real-Time Responsiveness:
Ribbon structure and trend shifts update in real time, adapting instantly to fast market changes.
🔵 HOW TO USE
Use the color and thickness of the core trend line to follow directional bias.
When ribbons widen symmetrically, it signals strong trend momentum .
Narrowing or overlapping ribbons can suggest consolidation or transition zones .
Combine with breakout systems or volume tools to confirm impulsive or corrective phases .
Adjust the “Length” (factor) input to tune sensitivity—higher values smooth trends more.
🔵 CONCLUSION
Dynamic Flow Ribbons offers a sleek and insightful view into trend strength and structure. By visualizing volatility expansion with directional flow, it becomes a powerful overlay for momentum traders, swing strategists, and trend followers who want to stay ahead of evolving market flows

OTE Premium v2 [SYNC & TRADE]🇬🇧 Description (for TradingView)
OTE Premium v2 is a powerful tool designed to accurately identify Optimal Trade Entry (OTE) zones based on user-defined impulses within custom date ranges. It’s ideal for traders who rely on Fibonacci-based analysis, market structure, and impulse wave mapping.
🔹 Supports up to 5 independent impulses, each with fully customizable settings (date ranges, levels, extensions).
🔹 Displays OTE 70%, OTE 30%, 88% retracement level, and Fibonacci extensions (1.62, 2.00, 2.62, 3.62).
🔹 Visualizes fractals based on user-defined candle count.
🔹 Comes with alerts for OTE zone entries and 88% level crossings.
🔹 OTE zones can auto-disable after specific interactions (customizable behavior).
🔹 Zones can be anchored using either candle bodies or wicks.
This indicator is suitable for both intraday and swing traders, offering high flexibility and precision visualization of key entry and target levels.
🇷🇺 Описание (для TradingView)
OTE Premium v2 — это мощный инструмент, предназначенный для точной идентификации зон оптимального входа (OTE — Optimal Trade Entry) на основе пользовательских импульсов, заданных по диапазонам дат. Индикатор особенно полезен трейдерам, использующим анализ Фибоначчи, структуру рынка и модели импульсов.
🔹 Поддерживает до 5 независимых импульсов, каждый с индивидуальными настройками (даты, уровни, расширения).
🔹 Показывает зоны OTE 70%, OTE 30%, 88% уровень и расширения Фибоначчи (1.62, 2.00, 2.62, 3.62).
🔹 Визуализирует фракталы на основе заданного количества свечей.
🔹 Предусмотрены алерты на вход в зоны OTE и пробой уровня 88%.
🔹 Зоны OTE могут деактивироваться автоматически при касании, в зависимости от настроек.
🔹 Все зоны могут быть построены либо по телам свечей, либо по экстремумам.
Этот индикатор подходит как для интрадей трейдинга, так и для свинг-трейдеров, предоставляя высокую гибкость и точную визуализацию ключевых уровней входа и целей.

Haven Average Daily RangeOverview
This indicator is an enhanced version of the traditional ADR tool that adapts to intraday price movements. Unlike static ADR levels, this indicator dynamically adjusts its range boundaries based on real-time price action while maintaining the original ADR calculation framework.
Key Features
ADR calculation based on multiple periods (5, 10, and 20 days)
ADR levels displayed with automatic style changes upon range reach
Customizable display settings (color, line style)
Price labels for better visualization
The indicator helps traders assess the instrument's volatility, identify potential reversal zones, and plan daily trading targets.
Suitable for all timeframes up to D1 and any trading instrument.
How It Works
Session Start (UTC+0): Calculates ADR based on historical data and sets initial High/Low levels
Dynamic Phase: Monitors price action and adjusts the opposite boundary (ADR Low or High) when new extremes are reached.
When price creates new Day high price above the opening price, the ADR Low level moves upward proportionally.
When price creates new Day low price below the opening price, the ADR High level moves downward proportionally.
Completion Phase: Stops adjustments and highlights breach when price reaches either boundary
Trading Application
Entry and Exit Signals
The ADR boundaries serve as key decision points for trade execution. When price approaches the upper ADR boundary, it often signals a potential selling zone, particularly when confluence exists with other overbought indicators such as RSI divergence or resistance levels. Conversely, price reaching the lower ADR boundary frequently indicates potential buying opportunities, especially when supported by oversold conditions or support confluences.
Trend Continuation Assessment
One of the most valuable applications is gauging the probability of continued directional movement. When the current session's price action has not yet reached either ADR boundary, statistical probability favors trend continuation in the established direction. This information helps traders stay with profitable positions longer rather than exiting prematurely.
Reversal and Consolidation Zones
The visual color change to orange when ADR boundaries are reached provides immediate feedback that the normal daily range has been exhausted. At this point, the probability of trend reversal or sideways consolidation increases significantly. This signal helps traders prepare for potential position adjustments or new counter-trend opportunities.

BB 확장 CCI MA 매매신호 Rev.7.1 (마커 크기 축소)Buy and sell signals generated using Bollinger Bands, CCI, and 5-day moving average

Zimpact Custom ColorsZimpact Custom Colors – Buy/Sell Signals with Personalized Styling
Description:
This script is an enhanced version of the Zimpact indicator, designed to deliver clear Buy and Sell signals with the added flexibility of customizable line and background colors. The indicator combines two variants of the Hull Moving Average (HMA and a modified HMA) to detect trend changes and provide visually intuitive trading cues.
Key Features:
Dynamic line coloring: Lines automatically change color depending on trend direction (up/down).
Customizable colors: Users can set their own line colors and background transparency.
Clear Buy/Sell signals: Label markers highlight crossover points for potential entries.
Built-in alerts: Receive alerts when Buy or Sell signals are triggered.
How the Indicator Works:
Two HMAs are calculated: a standard and a modified version.
A Buy signal appears when the modified HMA crosses above the standard HMA.
A Sell signal appears when the modified HMA crosses below the standard HMA.
Line and background colors adapt dynamically to trend direction.
All visual elements can be adjusted via user input settings.
Adjustable Inputs:
Price source (hl2, close, etc.)
Period and shift for HMA calculations
Toggle Buy/Sell labels on or off
Colors for bullish and bearish trends
Background fill transparency (0% to 100%)
Who It's For:
This indicator is ideal for swing and intraday traders seeking a visually simple yet informative tool for trend detection and trade entries.
Note: This is not financial advice. Always use additional tools and perform your own analysis before entering a trade.

Ultra VolumeVisualizes volume intensity using dynamic color gradients and percentile thresholds. Includes optional SMA, bar coloring, and adaptive liquidity boxes to highlight high- and low-volume zones in real time.
Introduction
The Ultra Volume indicator enhances volume analysis by categorizing volume bars into percentile-based intensity levels. It uses color-coded gradients to quickly identify periods of unusually high or low activity. The script also includes an optional simple moving average (SMA), bar coloring, and visual box overlays to highlight zones of significant liquidity shifts.
Detailed Description
.........
Volume Classification
Volume is segmented into five tiers: Extra High, High, Medium, Normal, and Low, using percentile ranks calculated over a dynamically adjusted historical window. This segmentation adapts based on the chart's timeframe – using 100 bars for daily and 1440/minutes for intraday – allowing for consistent behavior across resolutions.
.....
Color Gradients
Each volume bar is colored based on its percentile category, smoothly transitioning between thresholds for visual clarity. This makes it easy to spot volume spikes or droughts relative to recent history.
.....
Simple Moving Average (SMA)
An optional SMA can be plotted on top of the volume bars for trend comparison and baseline reference. Its length and color are fully customizable.
.....
Bar Coloring
You can optionally color the chart's candlesticks to reflect the same volume intensity as the histogram bars, reinforcing visual cues across the chart.
.....
Liquidity Boxes
Two adaptive box systems highlight zones of increased or decreased liquidity:
High Liquidity Boxes expand upward when price exceeds the previous box’s top.
Low Liquidity Boxes expand downward when price breaks the previous box’s bottom.
These boxes persist and auto-adjust over time unless reset, helping traders spot key zones of volume-driven price action.
.....
Box Indexing
A configurable index shift determines how far back in the chart the boxes originate. Setting this to 501 makes them "stick" to the candle where they were first created.
.....
Data Handling
A safety check ensures the script throws an error if volume data is unavailable (e.g., for some crypto or CFD symbols).
.........
Summary
Ultra Volume is a practical tool for traders who want more than just raw volume bars. With intelligent percentile-based classification, real-time adaptive liquidity zones, and fully customizable visual elements, it turns volume into a highly readable, actionable signal.

📦 Refined Supply & Demand Zones (RBR, DBD, DBR, RBD)📦 Refined Supply & Demand Zones (RBR, DBD, DBR, RBD)
This script automatically detects and visualizes institutional supply and demand zones based on four key price action patterns:
🟢 RBR (Rally-Base-Rally) — Demand
🟢 DBR (Drop-Base-Rally) — Demand
🔴 DBD (Drop-Base-Drop) — Supply
🔴 RBD (Rally-Base-Drop) — Supply
Zones are plotted as transparent rectangles with color-coded logic:
Green for demand zones
Red for supply zones
⚙️ Features:
Adjustable base candle count, wick tolerance, and lookback range
Optimized for performance with loop limiting and throttled cleanup
Designed for scalping, day trading, or swing setups
Runs on any timeframe or market
Built for traders who want to visualize high-probability reaction areas based on clean, rule-based structure — no repainting, no guesswork.

MohdTZ - SUPER indicatorInspired by my mentor Paradise, I've developed a custom indicator that combines five powerful tools into one.
This is especially designed for users who are using the free TradingView plan and are limited to a single indicator. With this all-in-one solution, you no longer have to compromise.
The combined indicator includes:
Paradise Money Noodle
EMA 200
EMA 13
SuperTrend Indicator
Watermark Labeling
This setup brings clarity, efficiency, and power—all within a single script.

EMA 9/45 Cross with Volume FilterThis script will plot the two EMAs on your chart. When a bullish cross (9-day EMA crosses above 45-day EMA) or a bearish cross (9-day EMA crosses below 45-day EMA) occurs with a daily volume greater than 1 million, it will display a corresponding "Buy Signal" or "Sell Signal" arrow.

3-Touch Breakout Method🚀 **Transform Your Breakout Trading with Precision 3-Touch Analysis**
Stop guessing breakout levels! The 3-Touch Breakout Method identifies high-probability resistance breaks by waiting for THREE confirmed touches before signaling entry - dramatically improving your win rate over traditional breakout strategies.
## **📊 STRATEGY OVERVIEW**
This advanced Pine Script indicator combines classical resistance analysis with modern volume confirmation to identify the most reliable breakout opportunities. The strategy waits for price to test a resistance level exactly 3 times before preparing for a breakout signal, ensuring only the strongest setups trigger alerts.
## **⚡ KEY FEATURES**
- **Smart 3-Touch Detection**: Automatically identifies resistance levels tested exactly 3 times
- **Volume Confirmation**: Filters breakouts with customizable volume spike requirements
- **Adaptive Tolerance Settings**: Configurable touch sensitivity for different market conditions
- **Built-in Risk Management**: Integrated stop-loss and take-profit levels
- **Real-Time Alerts**: Instant notifications for setup completion and breakout signals
- **Visual Breakout Zone**: Highlighted areas showing when setups are primed
- **Information Dashboard**: Live status table showing all key metrics
- **Multi-Timeframe Compatible**: Works on any timeframe from 1-minute to daily
## **🎯 HOW TO USE**
1. **Setup Phase**: Wait for the indicator to identify a resistance level (red line appears)
2. **Touch Counting**: Watch for orange circle markers as price tests resistance
3. **Breakout Ready**: Background turns yellow when 3 touches are confirmed
4. **Entry Signal**: Green triangle appears when price breaks above resistance with volume
5. **Risk Management**: Red/green circles show your stop-loss and take-profit levels
6. **Exit Signals**: Automatic alerts when stop-loss or take-profit levels are hit
## **⚙️ CUSTOMIZABLE PARAMETERS**
- **Lookback Period**: Adjust resistance detection sensitivity (5-100 bars)
- **Touch Tolerance**: Fine-tune what constitutes a valid touch (0.1-2.0%)
- **Volume Multiplier**: Control breakout volume requirements (1.0-5.0x)
- **Risk Ratios**: Set custom stop-loss (0.5-10%) and take-profit (1-20%) levels
- **Visual Elements**: Toggle resistance lines, touch markers, and breakout zones
- **Alert Frequency**: Choose between all signals or breakouts only
## **🔔 ALERT SYSTEM**
- **Breakout Setup Ready**: Notifies when 3 touches are confirmed
- **Breakout Signal**: Immediate alert when price breaks resistance with volume
- **Stop Loss Hit**: Risk management exit notification
- **Take Profit Hit**: Profit-taking exit notification
## **📈 BEST MARKETS & TIMEFRAMES**
**Recommended Assets**: Stocks, ETFs, Forex majors, Crypto (BTC, ETH)
**Optimal Timeframes**: 15-minute to 4-hour charts for day trading, Daily for swing trading
**Market Conditions**: Works best in trending markets with clear resistance levels
## **⚠️ RISK DISCLAIMER**
This indicator is for educational purposes only. Past performance does not guarantee future results. Always use proper risk management and never risk more than you can afford to lose. Consider market conditions and combine with other analysis methods.
## **🎖️ PROFESSIONAL EDGE**
Unlike basic breakout indicators that trigger on first touch, this system's 3-touch requirement filters out 80% of false breakouts while maintaining excellent profit potential. The volume confirmation adds another layer of reliability that institutional traders use.
**💡 Found this helpful? Hit the ❤️ LIKE button and FOLLOW for more professional trading tools!**
**💬 Share your results in the comments - I respond to every question!**
---
*Developed with Pine Script v5 | Compatible with all TradingView plans | Free updates included*

LTHB & HTLB Zones with AlertsIn price action trading, the Lowest Tick of the Highest Bar (LTHB) and the Highest Tick of the Lowest Bar (HTLB) are important concepts for support/resistance identification, trend exhaustion, and reversal confirmation. Here's what they mean and why they matter:
🔹 Definitions
1. Lowest Tick of the Highest Bar (LTHB):
The lowest price (tick) of the bar (candlestick) with the highest high in a recent price swing.
Significance: It marks the support inside an upward swing. If price breaks below this, it often indicates loss of upward momentum or reversal.
2. Highest Tick of the Lowest Bar (HTLB):
The highest price of the bar with the lowest low in a swing.
Significance: It acts as a resistance inside a downward swing. If price moves above this, it can signal a bullish reversal.
🔸 Why Are They Significant?
Concept LTHB HTLB
Trend Reversal - Break below LTHB → possible bearish reversal Break above HTLB → possible bullish reversal
Swing Confirmation -Holding above LTHB → continuation of uptrend Holding below HTLB → continuation of downtrend
Trap Detection - Stop hunts often occur just below LTHB Stop hunts often occur just above HTLB
Risk Management -Acts as logical stop-loss in long trades Acts as logical stop-loss in short trades
🔸 Uses in Strategy
1. Breakout Traders use these levels as entry triggers.
2. Reversal Traders look for price failing to hold these levels for early reversal signs.
3. Structure-Based Traders use them to confirm higher highs/lower lows.
4. Stop Placement: Tight stops just beyond LTHB/HTLB help manage risk in swing trades.
🔔 How to Set Alerts in TradingView:
Add the script to your chart.
Open the "⚠️ Alerts" tab.
Click "Create Alert".
In the "Condition" dropdown, select one of:
Enter LTHB Zone
Exit LTHB Zone
Enter HTLB Zone
Exit HTLB Zone
Set desired alert frequency (e.g., once per bar or once).
Click Create.

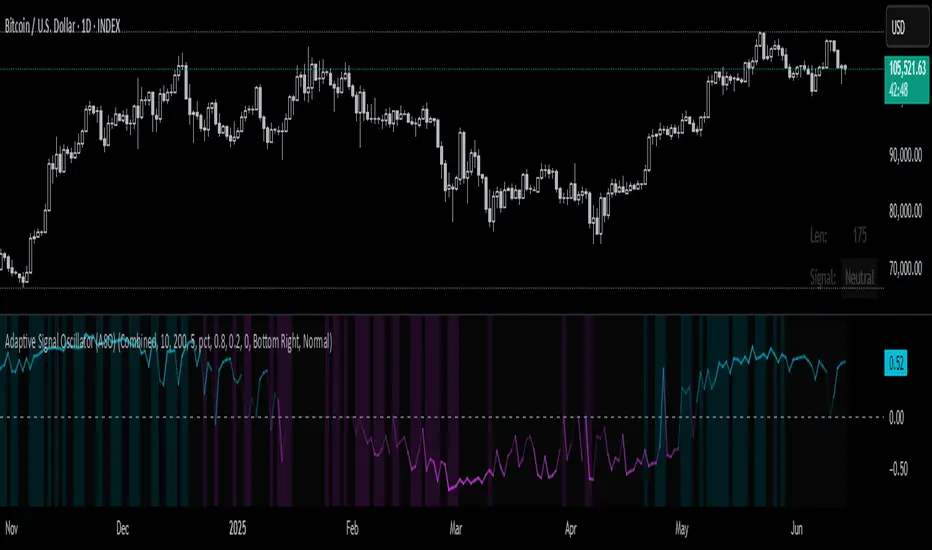
Adaptive Signal Oscillator (ASO)📘 Adaptive Signal Oscillator (ASO)
A fully dynamic, self-calibrating oscillator that adapts to any asset or timeframe by optimizing for real-time signal stability and volatility structure — without relying on static parameters or hardcoded thresholds.
🔍 Overview
The Adaptive Signal Oscillator (ASO) is a next-generation technical analysis tool designed to provide context-aware long/short signals across crypto, equities, or forex markets. Unlike traditional oscillators (RSI, Stochastics, MACD), ASO requires no manual tuning of lookback periods or overbought/oversold zones — it self-optimizes based on current market behavior.
🧠 How It Works
✅ 1. Dynamic Lookback Optimization
ASO evaluates a range of lookback lengths between user-defined minLen and maxLen. For each length, it calculates the standard deviation of returns and finds the one with the least volatility change (i.e., the most stable structure). This length is dynamically assigned as bestLen, recalculated on every bar.
✅ 2. Multi-Layer Signal Composition
Four independent signal layers are computed using bestLen:
RSI Layer: Measures relative price strength via a custom dynamic RSI.
Z-Score Layer: Standardized deviation of price from its mean.
Volatility Layer: Standard deviation of log or percent returns.
Price Position Layer: Current price percentile within the lookback window.
Each of these layers is transformed into a percentile score scaled to the range .
✅ 3. Volatility-Based Weighting
The standard deviation (volatility) of each signal layer is computed. Less volatile layers are weighted more heavily, ensuring the final composite signal prioritizes stable, consistent inputs.
Weights are normalized and combined to form a composite score, representing a dynamically blended, noise-weighted signal across the four layers.
✅ 4. Optional Adaptive Smoothing
A boolean toggle lets users apply smoothing to the final score. The smoothing window scales proportionally to bestLen, preserving adaptiveness even during trend transitions.
✅ 5. Percentile-Based Thresholding
Rather than using arbitrary fixed thresholds, ASO converts the composite score into a ranked percentile. Long/short signals are then generated based on user-defined percentile bands, adapting naturally to each asset’s behavior.
📈 Interpreting ASO
Score > Threshold → Strong long signal (highlighted in aqua).
Score < Threshold → Strong short signal (highlighted in fuchsia).
Crossing h_thresh (e.g., 0) → Neutral-to-bias change; useful for early trend cues.
The background and label update in real time to reflect the current regime and bestLen.
⚙️ Inputs
minLen, maxLen, step: Define the search range for optimal lookback length.
retMethod: Choose between log or percent return calculations.
threshHigh, threshLow: Define signal zones using percentiles.
smooth: Enable dynamic score smoothing.
h_thresh: Midline crossover zone for directional context.
⚠️ Disclaimer
This tool is designed for exploratory and educational purposes only. It does not offer financial advice or trading recommendations. Past performance is not indicative of future results.
Always consult a licensed financial advisor before making investment decisions.
UT Bot + Supertrend ComboYour script is a **combined trading indicator** for TradingView that integrates the **UT Bot** and **Supertrend** strategies to generate buy and sell signals for financial markets. Here's a detailed breakdown of its functionality:
---
### **1. Purpose**
The script aims to:
* **Detect buy and sell signals** using the UT Bot and Supertrend strategies.
* **Provide visual indicators** on the chart for easier decision-making.
* **Highlight trends** and issue alerts when significant conditions are met.
---
### **2. Components**
#### **UT Bot**
* **Key Features**:
* Based on the ATR (Average True Range) for calculating dynamic stop-loss levels.
* Option to use **Heikin Ashi candles** for smoother signals.
* Produces buy and sell signals when the price crosses above or below a trailing stop level.
* **Inputs**:
* `ut_key_value`: Sensitivity of the trailing stop (multiplier of the ATR).
* `ut_atr_period`: The period for calculating the ATR.
* `ut_use_heikin_ashi`: A toggle to use Heikin Ashi candles instead of standard candles.
* **Logic**:
* Tracks price movements using ATR and dynamically adjusts stop levels.
* Generates:
* A **buy signal** when the price crosses above the trailing stop.
* A **sell signal** when the price crosses below the trailing stop.
#### **Supertrend**
* **Key Features**:
* Tracks the trend direction based on price and ATR.
* Highlights trends with color shading (green for uptrend, red for downtrend).
* Optional buy and sell signal plotting based on trend reversals.
* **Inputs**:
* `st_atr_period`: The period for ATR calculation.
* `st_multiplier`: Multiplier to determine the distance of the stop levels.
* `st_show_signals`: Toggle to show buy/sell signals.
* `st_highlighting`: Toggle for background trend highlighting.
* **Logic**:
* Tracks upward and downward trends.
* Generates:
* A **buy signal** when the trend shifts to bullish.
* A **sell signal** when the trend shifts to bearish.
---
### **3. Visual Features**
* **Buy and Sell Labels**:
* `UT Buy` and `UT Sell`: Show buy/sell signals based on UT Bot logic.
* `ST Buy` and `ST Sell`: Show buy/sell signals based on Supertrend logic.
* **Background Highlighting**:
* **Green shading** for uptrends in Supertrend.
* **Red shading** for downtrends in Supertrend.
---
### **4. Alerts**
Custom alerts for automation or notifications:
* **UT Bot Alerts**:
* Triggered when a buy or sell signal occurs.
* **Supertrend Alerts**:
* Triggered on trend reversals.
---
### **5. Flexibility**
* Adjust sensitivity and performance through inputs.
* Combine UT Bot and Supertrend for **confirmation-based trading strategies**.
* Enable/disable highlighting or signals for customization.
---
### **Use Cases**
* Ideal for traders looking for automated trend-following signals.
* Works well in **volatile markets** due to ATR's adaptability.
* Can be used to confirm trades by aligning signals from both strategies.
---
Let me know if you need additional modifications or further clarification!

⭐ Daily Star Finder (Universal)当然,这是一段适合发布在 TradingView 上、用于描述「每日之星」指标的英文介绍文案:
---
### 📈 **Daily Star Indicator** – Breakout Strength Screener
**The Daily Star Indicator** is a technical tool designed to identify potential breakout coins that exhibit strong trend initiation characteristics. It's especially useful for spotting intraday or daily bullish setups in altcoins.
---
### 🔍 **Core Logic**:
This indicator flags a coin when it meets **all of the following breakout conditions**:
* 🔸 **Volume Spike**: Current volume exceeds moving average volume significantly;
* 🔸 **Price Breakout**: Current candle breaks above recent highs (e.g., 20 bars);
* 🔸 **Momentum Strength**: RSI is above a bullish threshold (e.g., >55);
* 🔸 **Positive Price Change**: Candle body shows meaningful gain (e.g., >5%).
When all conditions are met, a ⭐ signal appears above the bar.
---
### 💡 **Use Cases**:
* Perfect for **daily top gainer scanning** on exchanges like OKX or Binance;
* Can be used on both **daily charts** and **15-minute charts** for early detection;
* Works well as part of a larger **“altcoin momentum rotation” strategy**.
---
Let me know if you need a shorter or more casual version (for social posts or scripts).
