Strategy UtilitiesThis library comprises valuable functions for implementing strategies on TradingView, articulated in a professional writing style.
The initial version features a monthly Profit & Loss table with percentage variations, utilizing a modified version of the script by @QuantNomad.
Library "strategy_utilities"
monthly_table(results_prec, results_dark)
monthly_table prints the Monthly Returns table, modified from QuantNomad. Please put calc_on_every_tick = true to plot it.
Parameters:
results_prec (int) : for the precision for decimals
results_dark (bool) : true or false to print the table in dark mode
Returns: nothing (void), but prints the monthly equity table
Sample Usage
import TheSocialCryptoClub/strategy_utilities/1 as su
results_prec = input(2, title = "Precision", group="Results Table")
results_dark = input.bool(defval=true, title="Dark Mode", group="Results Table")
su.monthly_table(results_prec, results_dark)
Göstergeler ve stratejiler
Uptrend Downtrend Loopback Candle Identification LibThis library is for identifying uptrends and downtrends using a loopback candle analysis method. Which contains two functions:
uptrendLoopbackCandleIdentification() and downtrendLoopbackCandleIdentification() . These functions check if the current candle is part of an uptrend or downtrend, respectively, based on the specified lookback period.
The uptrendLoopbackCandleIdentification() takes two arguments: index , which is the index of the current bar, and lookbackPeriod , which is the number of previous candles to check for an uptrend. The function returns false if the index is less than the lookback period. Otherwise, it initializes a boolean variable isHigherHigh as true and loops through the previous candles. If any of the previous candles have a higher high than the current candle, isHigherHigh is set to false , and the loop breaks. Finally, the function returns the value of isHigherHigh .
The downtrendLoopbackCandleIdentification() takes the same arguments and returns false if the index is less than the lookback period. The function initializes a boolean variable isHigherLow as true and loops through the previous candles. If any of the previous candles have a higher low than the current candle, isHigherLow is set to false , and the loop breaks. The function returns the value of isHigherLow .

BankNifty_CSMLibrary "BankNifty_CSM"
TODO: add library description here
getLtp_N_Chang(openPrice, closePrice, highPrice, hl2Price, lowPrice, hlc3Price, bankNiftyClose)
Parameters:
openPrice (float)
closePrice (float)
highPrice (float)
hl2Price (float)
lowPrice (float)
hlc3Price (float)
bankNiftyClose (float)

ka66: lib/MovingAveragesLibrary "MovingAverages"
Exotic or Interesting Moving Averages Collection. Just the one right now!
alphaConfigurableEma(src, alpha, nSmooth)
Calculates a variation of the EMA by specifying a custom alpha value.
Parameters:
src (float) : a float series to get the EMA for, e.g. close, hlc3, etc.
alpha (float) : a value between 0 (ideally greater, to get any MA!) and 1. Closer
to one makes it more responsive, and choppier.
nSmooth (int) : Just applies the same alpha and EMA to the last Alpha-EMA output.
A value between 0 and 10 (just keeping a a reasonable bound). The idea is
you can first use a reasonably high alpha, then smooth it out. Default 0,
no further smoothing.
Returns: MA series.
bands(src, multiplier)
Calculates fixed bands around a series, can be any series, though the intent
here is for MA series.
Parameters:
src (float) : a float series.
multiplier (float) : a value greater than or equal to 0 (ideally greater, to get any MA!),
determines the width of the bands. Start with small float values, or it may go
beyond the scale, e.g. 0.005.
Returns: a 2-tuple of (upBand, downBand)
Spider_PlotIntroduction:
Spider charts, also known as radar charts or web charts, are a powerful data visualization tool that can display multiple variables in a circular format. They are particularly useful when you want to compare different data sets or evaluate the performance of a single data set across multiple dimensions. In this blog post, we will dive into the world of spider charts, explore their benefits, and demonstrate how you can create your own spider chart using the Spider_Plot library.
Why Spider Charts are Cool:
Spider charts have a unique visual appeal that sets them apart from other chart types. They allow you to display complex data in a compact, easy-to-understand format, making them perfect for situations where you need to convey a lot of information in a limited space. Some of the key benefits of spider charts include:
Multi-dimensional analysis: Spider charts can display multiple variables at once, making them ideal for analyzing relationships between different data sets or examining a single data set across multiple dimensions.
Easy comparison: By displaying data in a circular format, spider charts make it simple to compare different data points, identify trends, and spot potential issues.
Versatility: Spider charts can be used for a wide range of applications, from business and finance to sports and health. They are particularly useful for situations where you need to analyze performance or make comparisons between different entities.
Creating Your Own Spider Chart with the Spider_Plot Library:
The Spider_Plot library is a user-friendly, easy-to-use tool that allows you to create stunning spider charts with minimal effort. To get started, you'll need to import the Spider_Plot library:
import peacefulLizard50262/Spider_Plot/1
With the library imported, you can now create your own spider chart. The first step is to normalize your data. Normalizing ensures that all data points fall within the 0 to 1 range, which is important for creating a visually balanced spider chart.
The Spider_Plot library provides the data_normalize function to help you normalize your data. This function accepts several parameters, including the normalization style ("All Time", "Range", or "Custom"), length of the range, outlier level, lookback period for standard deviation, and minimum and maximum values for the "Custom" normalization style.
Once you have normalized your data, you can create an array of your data points using the array.from function. This array will be used as input for the draw_spider_plot function, which is responsible for drawing the spider plot on your chart.
The draw_spider_plot function accepts an array of float values (the normalized data points), an array of background colors for each sector, a color for the axes, and a scaling factor.
Example Usage:
Here's an example script that demonstrates how to create a spider chart using the Spider_Plot library:
oc = data_normalize(ta.ema(math.abs(open - close), 20), "Range", 20)
// Create an array of your data points
data = array.from(tr, rsi, stoch, dev, tr, oc, tr)
// Define colors for each sector
colors = array.from(color.new(color.red, 90), color.new(color.blue, 90), color.new(color.green, 90), color.new(color.orange, 90), color.new(color.purple, 90), color.new(color.purple, 90), color.new(color.purple, 90))
// Draw the spider plot on your chart
draw_spider_plot(data, colors, color.gray, 100)
In this example, we have first normalized six different data points (rsi, source, stoch, dev, tr, and oc) using the data_normalize function. Next, we create an array of these normalized data points and define an array of colors for each sector of the spider chart. Finally, we call the draw_spider_plot function to draw the spider chart on our chart.
Conclusion:
Spider charts are a versatile and visually appealing tool for analyzing and comparing multi-dimensional data. With the Spider_Plot library, you can easily create your own spider charts and unlock valuable insights from your data. Just remember to normalize your data and create an array of data points before calling the draw_spider_plot function. Happy charting!
Library "Spider_Plot"
data_normalize(data, style, length, outlier_level, dev_lookback, min, max)
data_normalize(data, string style, int length, float outlier_level, simple int dev_lookback, float min, float max)
Parameters:
data (float) : float , A float value to normalize.
style (string) : string , The normalization style: "All Time", "Range", or "Custom".
length (int) : int , The length of the range for "Range" normalization style.
outlier_level (float) : float , The outlier level to exclude from calculations.
dev_lookback (simple int) : int , The lookback period for calculating the standard deviation.
min (float) : float , The minimum value for the "Custom" normalization style.
max (float) : float , The maximum value for the "Custom" normalization style.
Returns: array , The normalized float value.
draw_spider_plot(values, bg_colors, axes_color, scale)
draw_spider_plot(array values, array bg_colors, color axes_color, float scale)
Parameters:
values (float ) : array , An array of float values to plot in the spider plot.
bg_colors (color ) : array , An array of background colors for each sector in the spider plot.
axes_color (color) : color , The color of the axes in the spider plot. Default: color.gray
scale (float) : float , A scaling factor for the spider plot. Default: 10
Returns: void , Draws the spider plot on the chart.

ReversalChartPatternLibraryLibrary "ReversalChartPatternLibrary"
User Defined Types and Methods for reversal chart patterns - Double Top, Double Bottom, Triple Top, Triple Bottom, Cup and Handle, Inverted Cup and Handle, Head and Shoulders, Inverse Head and Shoulders
method delete(this)
Deletes the drawing components of ReversalChartPatternDrawing object
Namespace types: ReversalChartPatternDrawing
Parameters:
this (ReversalChartPatternDrawing) : ReversalChartPatternDrawing object
Returns: current ReversalChartPatternDrawing object
method delete(this)
Deletes the drawing components of ReversalChartPattern object. In turn calls the delete of ReversalChartPatternDrawing
Namespace types: ReversalChartPattern
Parameters:
this (ReversalChartPattern) : ReversalChartPattern object
Returns: current ReversalChartPattern object
method lpush(this, obj, limit, deleteOld)
Array push with limited number of items in the array. Old items are deleted when new one comes and exceeds the limit
Namespace types: ReversalChartPattern
Parameters:
this (ReversalChartPattern ) : array object
obj (ReversalChartPattern) : ReversalChartPattern object which need to be pushed to the array
limit (int) : max items on the array. Default is 10
deleteOld (bool) : If set to true, also deletes the drawing objects. If not, the drawing objects are kept but the pattern object is removed from array. Default is false.
Returns: current ReversalChartPattern object
method draw(this)
Draws the components of ReversalChartPatternDrawing
Namespace types: ReversalChartPatternDrawing
Parameters:
this (ReversalChartPatternDrawing) : ReversalChartPatternDrawing object
Returns: current ReversalChartPatternDrawing object
method draw(this)
Draws the components of ReversalChartPatternDrawing within the ReversalChartPattern object.
Namespace types: ReversalChartPattern
Parameters:
this (ReversalChartPattern) : ReversalChartPattern object
Returns: current ReversalChartPattern object
method scan(zigzag, patterns, errorPercent, shoulderStart, shoulderEnd)
Scans zigzag for ReversalChartPattern occurences
Namespace types: zg.Zigzag
Parameters:
zigzag (Zigzag type from HeWhoMustNotBeNamed/ZigzagTypes/2) : ZigzagTypes.Zigzag object having array of zigzag pivots and other information on each pivots
patterns (ReversalChartPattern ) : Existing patterns array. Used for validating duplicates
errorPercent (float) : Error threshold for considering ratios. Default is 13
shoulderStart (float) : Starting range of shoulder ratio. Used for identifying shoulders, handles and necklines
shoulderEnd (float) : Ending range of shoulder ratio. Used for identifying shoulders, handles and necklines
Returns: int pattern type
method createPattern(zigzag, patternType, patternColor, riskAdjustment)
Create Pattern from ZigzagTypes.Zigzag object
Namespace types: zg.Zigzag
Parameters:
zigzag (Zigzag type from HeWhoMustNotBeNamed/ZigzagTypes/2) : ZigzagTypes.Zigzag object having array of zigzag pivots and other information on each pivots
patternType (int) : Type of pattern being created. 1 - Double Tap, 2 - Triple Tap, 3 - Cup and Handle, 4 - Head and Shoulders
patternColor (color) : Color in which the patterns are drawn
riskAdjustment (float) : Used for calculating stops
Returns: ReversalChartPattern object created
method getName(this)
get pattern name of ReversalChartPattern object
Namespace types: ReversalChartPattern
Parameters:
this (ReversalChartPattern) : ReversalChartPattern object
Returns: string name of the pattern
method getDescription(this)
get consolidated description of ReversalChartPattern object
Namespace types: ReversalChartPattern
Parameters:
this (ReversalChartPattern) : ReversalChartPattern object
Returns: string consolidated description
method init(this)
initializes the ReversalChartPattern object and creates sub object types
Namespace types: ReversalChartPattern
Parameters:
this (ReversalChartPattern) : ReversalChartPattern object
Returns: ReversalChartPattern current object
ReversalChartPatternDrawing
Type which holds the drawing objects for Reversal Chart Pattern Types
Fields:
patternLines (Line type from HeWhoMustNotBeNamed/DrawingTypes/1) : array of Line objects representing pattern
entry (Line type from HeWhoMustNotBeNamed/DrawingTypes/1) : Entry price Line
target (Line type from HeWhoMustNotBeNamed/DrawingTypes/1) : Target price Line
patternLabel (Label type from HeWhoMustNotBeNamed/DrawingTypes/1)
ReversalChartPattern
Reversal Chart Pattern master type which holds the pattern components, drawings and trade details
Fields:
pivots (Pivot type from HeWhoMustNotBeNamed/ZigzagTypes/2) : Array of Zigzag Pivots forming the pattern
patternType (series int) : Defines the main type of pattern 1 - Double Tap, 1 - Triple Tap, 3 - Cup and Handle, 4 - Head and Shoulders
patternColor (series color) : Color in which the pattern will be drawn on chart
riskAdjustment (series float) : Percentage adjustment of risk. Used for setting stops
drawing (ReversalChartPatternDrawing) : ReversalChartPatternDrawing object which holds the drawing components
trade (Trade type from HeWhoMustNotBeNamed/TradeTracker/1) : TradeTracker.Trade object holding trade components
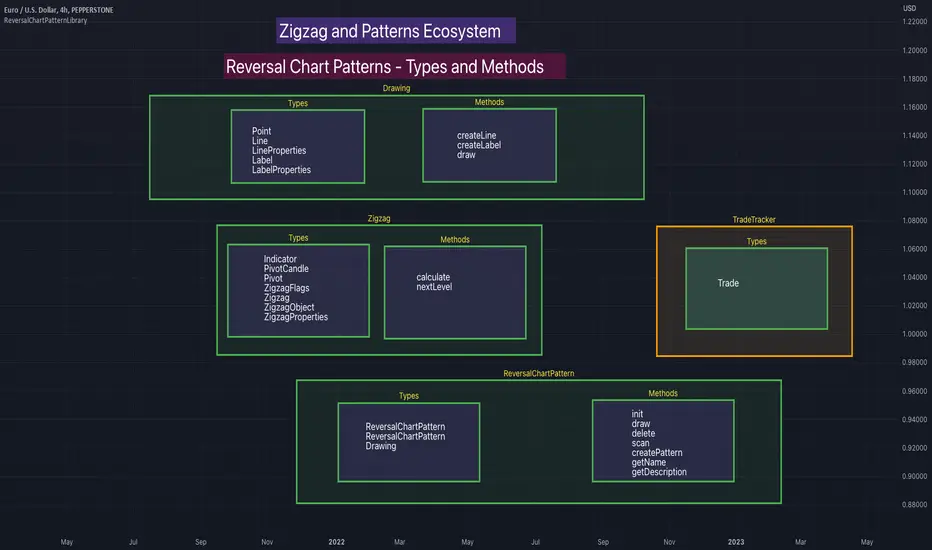
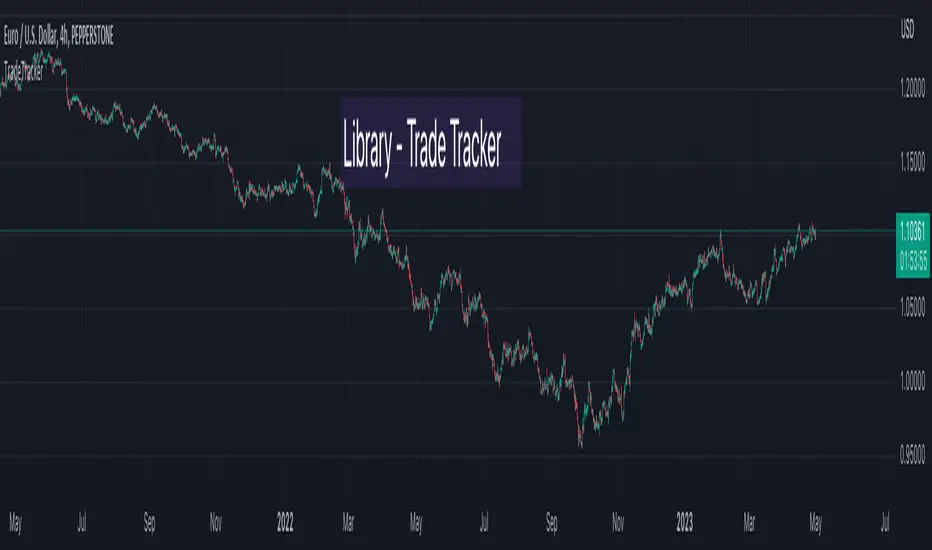
TradeTrackerLibrary "TradeTracker"
Simple Library for tracking trades
method track(this)
tracks trade when called on every bar
Namespace types: Trade
Parameters:
this (Trade) : Trade object
Returns: current Trade object
Trade
Has the constituents to track trades generated by any method.
Fields:
id (series int)
direction (series int) : Trade direction. Positive values for long and negative values for short trades
initialEntry (series float) : Initial entry price. This value will not change even if the entry is changed in the lifecycle of the trade
entry (series float) : Updated entry price. Allows variations to initial calculated entry. Useful in cases of trailing entry.
initialStop (series float) : Initial stop. Similar to initial entry, this is the first calculated stop for the lifecycle of trade.
stop (series float) : Trailing Stop. If there is no trailing, the value will be same as that of initial trade
targets (float ) : array of target values.
startBar (series int) : bar index of starting bar. Set by default when object is created. No need to alter this after that.
endBar (series int) : bar index of last bar in trade. Set by tracker on each execution
startTime (series int) : time of the start bar. Set by default when object is created. No need to alter this after that.
endTime (series int) : time of the ending bar. Updated by tracking method.
status (series int) : Integer parameter to track the status of the trade
retest (series bool) : Boolean parameter to notify if there was retest of the entry price
MathEasingFunctionsLibrary "MathEasingFunctions"
A collection of Easing functions.
Easing functions are commonly used for smoothing actions over time, They are used to smooth out the sharp edges
of a function and make it more pleasing to the eye, like for example the motion of a object through time.
Easing functions can be used in a variety of applications, including animation, video games, and scientific
simulations. They are a powerful tool for creating realistic visual effects and can help to make your work more
engaging and enjoyable to the eye.
---
Includes functions for ease in, ease out, and, ease in and out, for the following constructs:
sine, quadratic, cubic, quartic, quintic, exponential, elastic, circle, back, bounce.
---
Reference:
easings.net
learn.microsoft.com
ease_in_sine_unbound(v)
Sinusoidal function, the position over elapsed time (unbound).
Parameters:
v (float) : `float` Elapsed time.
Returns: Ratio of change.
ease_in_sine(v)
Sinusoidal function, the position over elapsed time (bound).
Parameters:
v (float) : `float` Elapsed time.
Returns: Ratio of change.
ease_out_sine_unbound(v)
Sinusoidal function, the position over elapsed time (unbound).
Parameters:
v (float) : `float` Elapsed time.
Returns: Ratio of change.
ease_out_sine(v)
Sinusoidal function, the position over elapsed time (bound).
Parameters:
v (float) : `float` Elapsed time.
Returns: Ratio of change.
ease_in_out_sine_unbound(v)
Sinusoidal function, the position over elapsed time (unbound).
Parameters:
v (float) : `float` Elapsed time.
Returns: Ratio of change.
ease_in_out_sine(v)
Sinusoidal function, the position over elapsed time (bound).
Parameters:
v (float) : `float` Elapsed time.
Returns: Ratio of change.
ease_in_quad_unbound(v)
Quadratic function, the position equals the square of elapsed time (unbound).
Parameters:
v (float) : `float` Elapsed time.
Returns: Ratio of change.
ease_in_quad(v)
Quadratic function, the position equals the square of elapsed time (bound).
Parameters:
v (float) : `float` Elapsed time.
Returns: Ratio of change.
ease_out_quad_unbound(v)
Quadratic function, the position equals the square of elapsed time (unbound).
Parameters:
v (float) : `float` Elapsed time.
Returns: Ratio of change.
ease_out_quad(v)
Quadratic function, the position equals the square of elapsed time (bound).
Parameters:
v (float) : `float` Elapsed time.
Returns: Ratio of change.
ease_in_out_quad_unbound(v)
Quadratic function, the position equals the square of elapsed time (unbound).
Parameters:
v (float) : `float` Elapsed time.
Returns: Ratio of change.
ease_in_out_quad(v)
Quadratic function, the position equals the square of elapsed time (bound).
Parameters:
v (float) : `float` Elapsed time.
Returns: Ratio of change.
ease_in_cubic_unbound(v)
Cubic function, the position equals the cube of elapsed time (unbound).
Parameters:
v (float) : `float` Elapsed time.
Returns: Ratio of change.
ease_in_cubic(v)
Cubic function, the position equals the cube of elapsed time (bound).
Parameters:
v (float) : `float` Elapsed time.
Returns: Ratio of change.
ease_out_cubic_unbound(v)
Cubic function, the position equals the cube of elapsed time (unbound).
Parameters:
v (float) : `float` Elapsed time.
Returns: Ratio of change.
ease_out_cubic(v)
Cubic function, the position equals the cube of elapsed time (bound).
Parameters:
v (float) : `float` Elapsed time.
Returns: Ratio of change.
ease_in_out_cubic_unbound(v)
Cubic function, the position equals the cube of elapsed time (unbound).
Parameters:
v (float) : `float` Elapsed time.
Returns: Ratio of change.
ease_in_out_cubic(v)
Cubic function, the position equals the cube of elapsed time (bound).
Parameters:
v (float) : `float` Elapsed time.
Returns: Ratio of change.
ease_in_quart_unbound(v)
Quartic function, the position equals the formula `f(t)=t^4` of elapsed time (unbound).
Parameters:
v (float) : `float` Elapsed time.
Returns: Ratio of change.
ease_in_quart(v)
Quartic function, the position equals the formula `f(t)=t^4` of elapsed time (bound).
Parameters:
v (float) : `float` Elapsed time.
Returns: Ratio of change.
ease_out_quart_unbound(v)
Quartic function, the position equals the formula `f(t)=t^4` of elapsed time (unbound).
Parameters:
v (float) : `float` Elapsed time.
Returns: Ratio of change.
ease_out_quart(v)
Quartic function, the position equals the formula `f(t)=t^4` of elapsed time (bound).
Parameters:
v (float) : `float` Elapsed time.
Returns: Ratio of change.
ease_in_out_quart_unbound(v)
Quartic function, the position equals the formula `f(t)=t^4` of elapsed time (unbound).
Parameters:
v (float) : `float` Elapsed time.
Returns: Ratio of change.
ease_in_out_quart(v)
Quartic function, the position equals the formula `f(t)=t^4` of elapsed time (bound).
Parameters:
v (float) : `float` Elapsed time.
Returns: Ratio of change.
ease_in_quint_unbound(v)
Quintic function, the position equals the formula `f(t)=t^5` of elapsed time (unbound).
Parameters:
v (float) : `float` Elapsed time.
Returns: Ratio of change.
ease_in_quint(v)
Quintic function, the position equals the formula `f(t)=t^5` of elapsed time (bound).
Parameters:
v (float) : `float` Elapsed time.
Returns: Ratio of change.
ease_out_quint_unbound(v)
Quintic function, the position equals the formula `f(t)=t^5` of elapsed time (unbound).
Parameters:
v (float) : `float` Elapsed time.
Returns: Ratio of change.
ease_out_quint(v)
Quintic function, the position equals the formula `f(t)=t^5` of elapsed time (bound).
Parameters:
v (float) : `float` Elapsed time.
Returns: Ratio of change.
ease_in_out_quint_unbound(v)
Quintic function, the position equals the formula `f(t)=t^5` of elapsed time (unbound).
Parameters:
v (float) : `float` Elapsed time.
Returns: Ratio of change.
ease_in_out_quint(v)
Quintic function, the position equals the formula `f(t)=t^5` of elapsed time (bound).
Parameters:
v (float) : `float` Elapsed time.
Returns: Ratio of change.
ease_in_expo_unbound(v)
Exponential function, the position equals the exponential formula of elapsed time (unbound).
Parameters:
v (float) : `float` Elapsed time.
Returns: Ratio of change.
ease_in_expo(v)
Exponential function, the position equals the exponential formula of elapsed time (bound).
Parameters:
v (float) : `float` Elapsed time.
Returns: Ratio of change.
ease_out_expo_unbound(v)
Exponential function, the position equals the exponential formula of elapsed time (unbound).
Parameters:
v (float) : `float` Elapsed time.
Returns: Ratio of change.
ease_out_expo(v)
Exponential function, the position equals the exponential formula of elapsed time (bound).
Parameters:
v (float) : `float` Elapsed time.
Returns: Ratio of change.
ease_in_out_expo_unbound(v)
Exponential function, the position equals the exponential formula of elapsed time (unbound).
Parameters:
v (float) : `float` Elapsed time.
Returns: Ratio of change.
ease_in_out_expo(v)
Exponential function, the position equals the exponential formula of elapsed time (bound).
Parameters:
v (float) : `float` Elapsed time.
Returns: Ratio of change.
ease_in_circ_unbound(v)
Circular function, the position equals the circular formula of elapsed time (unbound).
Parameters:
v (float) : `float` Elapsed time.
Returns: Ratio of change.
ease_in_circ(v)
Circular function, the position equals the circular formula of elapsed time (bound).
Parameters:
v (float) : `float` Elapsed time.
Returns: Ratio of change.
ease_out_circ_unbound(v)
Circular function, the position equals the circular formula of elapsed time (unbound).
Parameters:
v (float) : `float` Elapsed time.
Returns: Ratio of change.
ease_out_circ(v)
Circular function, the position equals the circular formula of elapsed time (bound).
Parameters:
v (float) : `float` Elapsed time.
Returns: Ratio of change.
ease_in_out_circ_unbound(v)
Circular function, the position equals the circular formula of elapsed time (unbound).
Parameters:
v (float) : `float` Elapsed time.
Returns: Ratio of change.
ease_in_out_circ(v)
Circular function, the position equals the circular formula of elapsed time (bound).
Parameters:
v (float) : `float` Elapsed time.
Returns: Ratio of change.
ease_in_back_unbound(v)
Back function, the position retreats a bit before resuming (unbound).
Parameters:
v (float) : `float` Elapsed time.
Returns: Ratio of change.
ease_in_back(v)
Back function, the position retreats a bit before resuming (bound).
Parameters:
v (float) : `float` Elapsed time.
Returns: Ratio of change.
ease_out_back_unbound(v)
Back function, the position retreats a bit before resuming (unbound).
Parameters:
v (float) : `float` Elapsed time.
Returns: Ratio of change.
ease_out_back(v)
Back function, the position retreats a bit before resuming (bound).
Parameters:
v (float) : `float` Elapsed time.
Returns: Ratio of change.
ease_in_out_back_unbound(v)
Back function, the position retreats a bit before resuming (unbound).
Parameters:
v (float) : `float` Elapsed time.
Returns: Ratio of change.
ease_in_out_back(v)
Back function, the position retreats a bit before resuming (bound).
Parameters:
v (float) : `float` Elapsed time.
Returns: Ratio of change.
ease_in_elastic_unbound(v)
Elastic function, the position oscilates back and forth like a spring (unbound).
Parameters:
v (float) : `float` Elapsed time.
Returns: Ratio of change.
ease_in_elastic(v)
Elastic function, the position oscilates back and forth like a spring (bound).
Parameters:
v (float) : `float` Elapsed time.
Returns: Ratio of change.
ease_out_elastic_unbound(v)
Elastic function, the position oscilates back and forth like a spring (unbound).
Parameters:
v (float) : `float` Elapsed time.
Returns: Ratio of change.
ease_out_elastic(v)
Elastic function, the position oscilates back and forth like a spring (bound).
Parameters:
v (float) : `float` Elapsed time.
Returns: Ratio of change.
ease_in_out_elastic_unbound(v)
Elastic function, the position oscilates back and forth like a spring (unbound).
Parameters:
v (float) : `float` Elapsed time.
Returns: Ratio of change.
ease_in_out_elastic(v)
Elastic function, the position oscilates back and forth like a spring (bound).
Parameters:
v (float) : `float` Elapsed time.
Returns: Ratio of change.
ease_in_bounce_unbound(v)
Bounce function, the position bonces from the boundery (unbound).
Parameters:
v (float) : `float` Elapsed time.
Returns: Ratio of change.
ease_in_bounce(v)
Bounce function, the position bonces from the boundery (bound).
Parameters:
v (float) : `float` Elapsed time.
Returns: Ratio of change.
ease_out_bounce_unbound(v)
Bounce function, the position bonces from the boundery (unbound).
Parameters:
v (float) : `float` Elapsed time.
Returns: Ratio of change.
ease_out_bounce(v)
Bounce function, the position bonces from the boundery (bound).
Parameters:
v (float) : `float` Elapsed time.
Returns: Ratio of change.
ease_in_out_bounce_unbound(v)
Bounce function, the position bonces from the boundery (unbound).
Parameters:
v (float) : `float` Elapsed time.
Returns: Ratio of change.
ease_in_out_bounce(v)
Bounce function, the position bonces from the boundery (bound).
Parameters:
v (float) : `float` Elapsed time.
Returns: Ratio of change.
select(v, formula, effect, bounded)
Parameters:
v (float)
formula (string)
effect (string)
bounded (bool)

SAT_BACKTEST @description TODO: Regroupement of useful functionsLibrary "SAT_BACKTEST"
ex_timezone(tz)
switch case return exact @timezone for timezone input
Parameters:
tz (simple string)
Returns: syminfo.timezone or tz
if_in_date_range(usefromDate, fromDate, usetoDate, toDate, src_timezone, dst_timezone)
if_in_date_range : check if @time_close is range
Parameters:
usefromDate (simple bool)
fromDate (simple int)
usetoDate (simple bool)
toDate (simple int)
src_timezone (simple string)
dst_timezone (simple string)
Returns: true if @time_close is range
if_in_session(useSessionStart, sessionStartHour, sessionStartMinute, useSessionEnd, sessionEndHour, sessionEndMinute, useSessionDay, mon, tue, wed, thu, fri, sat, sun, src_timezone, dst_timezone)
if_in_session : check if @time_close is range
Parameters:
useSessionStart (simple bool)
sessionStartHour (simple int)
sessionStartMinute (simple int)
useSessionEnd (simple bool)
sessionEndHour (simple int)
sessionEndMinute (simple int)
useSessionDay (simple bool)
mon (simple bool)
tue (simple bool)
wed (simple bool)
thu (simple bool)
fri (simple bool)
sat (simple bool)
sun (simple bool)
src_timezone (simple string)
dst_timezone (simple string)
Returns: true if @time_close is range

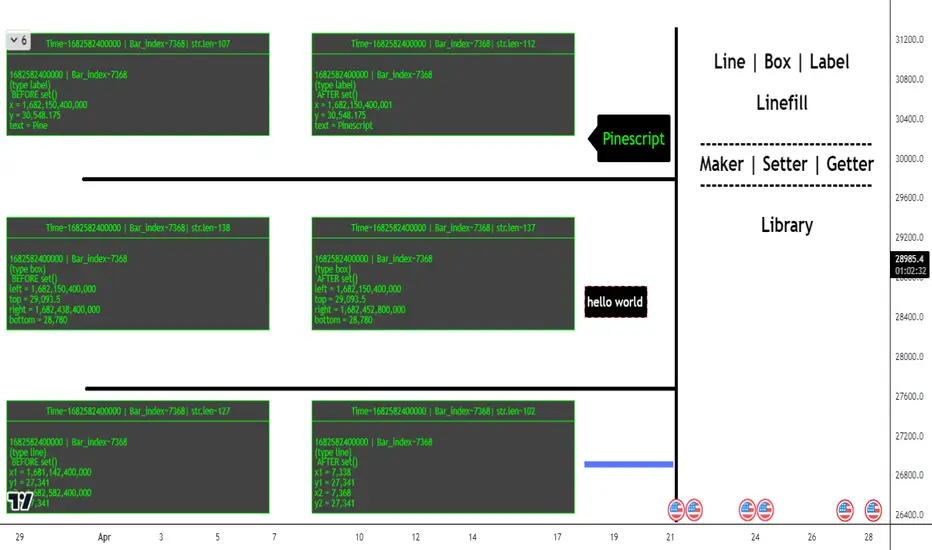
ObjectHelpersLibrary "ObjectHelpers"
Line | Box | Label | Linefill -- Maker, Setter, Getter Library
TODO: add table functionality
set(object)
set all params for `line`, `box`, `label`, `linefill` objects with 1 function
***
## Overloaded
***
```
method set(line Line, int x1=na, float y1=na, int x2=na, float y2=na,string xloc=na,string extend=na,color color=na,string style=na,int width=na,bool update=na) => line
```
### Params
- **Line** `line` - line object | `required`
- **x1** `int` - value to set x1
- **y1** `float` - value to set y1
- **x2** `int` - value to set x2
- **y2** `float` - value to set y2
- **xloc** `int` - value to set xloc
- **yloc** `int` - value to set yloc
- **extend** `string` - value to set extend
- **color** `color` - value to set color
- **style** `string` - value to set style
- **width** `int` - value to set width
- **update** `bool` - value to set update
***
```
method set(box Box,int left=na,float top=na,int right=na, float bottom=na,color bgcolor=na,color border_color=na,string border_style=na,int border_width=na,string extend=na,string txt=na,color text_color=na,string text_font_family=na,string text_halign=na,string text_valign=na,string text_wrap=na,bool update=false) => box
```
### Params
- **Box** `box` - box object
- **left** `int` - value to set left
- **top** `float` - value to set top
- **right** `int` - value to set right
- **bottom** `float` - value to set bottom
- **bgcolor** `color` - value to set bgcolor
- **border_color** `color` - value to set border_color
- **border_style** `string` - value to set border_style
- **border_width** `int` - value to set border_width
- **extend** `string` - value to set extend
- **txt** `string` - value to set _text
- **text_color** `color` - value to set text_color
- **text_font_family** `string` - value to set text_font_family
- **text_halign** `string` - value to set text_halign
- **text_valign** `string` - value to set text_valign
- **text_wrap** `string` - value to set text_wrap
- **update** `bool` - value to set update
***
```
method set(label Label,int x=na,float y=na, string txt=na,string xloc=na,color color=na,color textcolor=na,string size=na,string style=na,string textalign=na,string tooltip=na,string text_font_family=na,bool update=false) => label
```
### Paramas
- **Label** `label` - label object
- **x** `int` - value to set x
- **y** `float` - value to set y
- **txt** `string` - value to set text add`"+++"` to the _text striing to have the current label text concatenated to the location of the "+++")
- **textcolor** `color` - value to set textcolor
- **size** `string` - value to set size
- **style** `string` - value to set style (use "flip" ,as the style to have label flip to top or bottom of bar depending on if open > close and vice versa)
- **text_font_family** `string` - value to set text_font_family
- **textalign** `string` - value to set textalign
- **tooltip** `string` - value to set tooltip
- **update** `bool` - update label to next bar
***
```
method set(linefill Linefill=na,line line1=na,line line2=na,color color=na) => linefill
```
### Params
- **linefill** `linefill` - linefill object
- **line1** `line` - line object
- **line2** `line` - line object
- **color** `color` - color
Parameters:
object (obj)
Returns: `line`, `box`, `label`, `linefill`
method set(Line, x1, y1, x2, y2, xloc, extend, color, style, width, update)
set the location params of a line with 1 function auto detects time or bar_index for xloc param
Namespace types: series line
Parameters:
Line (line) : `line` - line object | `required`
x1 (int) : `int` - value to set x1
y1 (float) : `float` - value to set y1
x2 (int) : `int` - value to set x2
y2 (float) : `float` - value to set y2
xloc (string) : `int` - value to set xloc
extend (string) : `string` - value to set extend
color (color) : `color` - value to set color
style (string) : `string` - value to set style
width (int) : `int` - value to set width
update (bool) : `bool` - value to set update
Returns: `line`
method set(Box, left, top, right, bottom, bgcolor, border_color, border_style, border_width, extend, txt, text_color, text_font_family, text_halign, text_valign, text_wrap, update)
set the location params of a box with 1 function
Namespace types: series box
Parameters:
Box (box) : `box` - box object | `required`
left (int) : `int` - value to set left
top (float) : `float` - value to set top
right (int) : `int` - value to set right
bottom (float) : `float` - value to set bottom
bgcolor (color) : `color` - value to set bgcolor
border_color (color) : `color` - value to set border_color
border_style (string) : `string` - value to set border_style
border_width (int) : `int` - value to set border_width
extend (string) : `string` - value to set extend
txt (string) : `string` - value to set _text
text_color (color) : `color` - value to set text_color
text_font_family (string) : `string` - value to set text_font_family
text_halign (string) : `string` - value to set text_halign
text_valign (string) : `string` - value to set text_valign
text_wrap (string) : `string` - value to set text_wrap
update (bool) : `bool` - value to set update
Returns: `box`
method set(Label, x, y, txt, xloc, color, textcolor, size, style, textalign, tooltip, text_font_family, update)
set the location params of a label with 1 function auto detects time or bar_index for xloc param
Namespace types: series label
Parameters:
Label (label) : `label` | `required`
x (int) : `int` - value to set x
y (float) : `float` - value to set y
txt (string) : `string` - value to set text add`"+++"` to the _text striing to have the current label text concatenated to the location of the "+++")
xloc (string)
color (color)
textcolor (color) : `color` - value to set textcolor
size (string) : `string` - value to set size
style (string) : `string` - value to set style (use "flip" ,as the style to have label flip to top or bottom of bar depending on if open > close and vice versa)
textalign (string) : `string` - value to set textalign
tooltip (string) : `string` - value to set tooltip
text_font_family (string) : `string` - value to set text_font_family
update (bool) : `bool` - update label to next bar
Returns: `label`
method set(Linefill, line1, line2, color)
change the 1 or 2 of the lines in a linefill object
Namespace types: series linefill
Parameters:
Linefill (linefill)
line1 (line) : `line` - line object
line2 (line) : `line` - line object
color (color) : `color` - color
Returns: `linefill`
get(object)
get all of the location variables for `line`, `box`, `label` objects or the line objects from a `linefill`
***
## Overloaded
***
```
method get(line Line) =>
```
### Params
- **Line** `line` - line object | `required`
***
```
method get(box Box) =>
```
### Params
- **Box** `box` - box object | `required`
***
```
method get(label Label) =>
```
### Paramas
- **Label** `label` - label object | `required`
***
```
method get(linefill Linefill) =>
```
### Params
- **Linefill** `linefill` - linefill object | `required`
Parameters:
object (obj)
Returns: ` `
method get(Line)
Gets the location paramaters of a Line
Namespace types: series line
Parameters:
Line (line) : `line` - line object
Returns:
method get(Box)
Gets the location paramaters of a Box
Namespace types: series box
Parameters:
Box (box) : `box` - box object
Returns:
method get(Label)
Gets the `x`, `y`, `text` of a Label
Namespace types: series label
Parameters:
Label (label) : `label` - label object
Returns:
method get(Linefill)
Gets `line 1`, `line 2` from a Linefill
Namespace types: series linefill
Parameters:
Linefill (linefill) : `linefill` - linefill object
Returns:
method set_x(Line, x1, x2)
set the `x1`, `x2` of a line
***
### Params
- **Line** `line` - line object | `required`
- **x1** `int` - value to set x1 | `required`
- **x2** `int` - value to set x2 | `required`
Namespace types: series line
Parameters:
Line (line) : `line` - line object
x1 (int) : `int` - value to set x1
x2 (int) : `int` - value to set x2
Returns: `line`
method set_y(Line, y1, y2)
set `y1`, `y2` of a line
***
### Params
- **Line** `line` - line object | `required`
- **y1** `float` - value to set y1 | `required`
- **y2** `float` - value to set y2 | `required`
Namespace types: series line
Parameters:
Line (line) : `line` - line object
y1 (float) : `float` - value to set y1
y2 (float) : `float` - value to set y2
Returns: `line`
method Line(x1, y1, x2, y2, extend, color, style, width)
Similar to `line.new()` but can detect time or bar_index for xloc param and has defaults for all params but `x1`, `y1`, `x2`, `y2`
***
### Params
- **x1** `int` - value to set
- **y1** `float` - value to set
- **x2** `int` - value to set
- **y2** `float` - value to set
- **extend** `string` - extend value to set line
- **color** `color` - color to set line
- **style** `string` - style to set line
- **width** `int` - width to set line
Namespace types: series int, simple int, input int, const int
Parameters:
x1 (int) : `int` - value to set
y1 (float) : `float` - value to set
x2 (int) : `int` - value to set
y2 (float) : `float` - value to set
extend (string) : `string` - extend value to set line
color (color) : `color` - color to set line
style (string) : `string` - style to set line
width (int) : `int` - width to set line
Returns: `line`
method Box(left, top, right, bottom, extend, border_color, bgcolor, text_color, border_width, border_style, txt, text_halign, text_valign, text_size, text_wrap)
similar to box.new() with the but can detect xloc param and has defaults for everything but location params
***
### Params
- **left** `int` - value to set
- **top** `float` - value to set
- **right** `int` - value to set
- **bottom** `float` - value to set
- **extend** `string` - extend value to set box
- **border_color** `color` - color to set border
- **bgcolor** `color` - color to set background
- **text_color** `color` - color to set text
- **border_width** `int` - width to set border
- **border_style** `string` - style to set border
- **txt** `string` - text to set
- **text_halign** `string` - horizontal alignment to set text
- **text_valign** `string` - vertical alignment to set text
- **text_size** `string` - size to set text
- **text_wrap** `string` - wrap to set text
Namespace types: series int, simple int, input int, const int
Parameters:
left (int) : `int` - value to set
top (float) : `float` - value to set
right (int) : `int` - value to set
bottom (float) : `float` - value to set
extend (string) : `string` - extend value to set box
border_color (color) : `color` - color to set border
bgcolor (color) : `color` - color to set background
text_color (color) : `color` - color to set text
border_width (int) : `int` - width to set border
border_style (string) : `string` - style to set border
txt (string) : `string` - text to set
text_halign (string) : `string` - horizontal alignment to set text
text_valign (string) : `string` - vertical alignment to set text
text_size (string) : `string` - size to set text
text_wrap (string) : `string` - wrap to set text
Returns: `box`
method Label(txt, x, y, yloc, color, textcolor, style, size, textalign, text_font_family, tooltip)
Similar to label.new() but can detect time or bar_index for xloc param and has defaults for all params but x, y, txt, tooltip
***
### Params
- **txt** `string` - string to set
- **x** `int` - value to set
- **y** `float` - value to set
- **yloc** `string` - y location to set
- **color** `color` - label color to set
- **textcolor** `color` - text color to set
- **style** `string` - style to set
- **size** `string` - size to set
- **textalign** `string` - text alignment to set
- **text_font_family** `string` - font family to set
- **tooltip** `string` - tooltip to set
Namespace types: series string, simple string, input string, const string
Parameters:
txt (string) : `string` - string to set
x (int) : `int` - value to set
y (float) : `float` - value to set
yloc (string) : `string` - y location to set
color (color) : `color` - label color to set
textcolor (color) : `color` - text color to set
style (string) : `string` - style to set
size (string) : `string` - size to set
textalign (string) : `string` - text alignment to set
text_font_family (string) : `string` - font family to set
tooltip (string) : `string` - tooltip to set
Returns: `label`
obj
Fields:
obj (series__string)
peacefulIndicatorsWe are delighted to present the PeacefulIndicators library, a modest yet powerful collection of custom technical indicators created to enhance your trading analysis. The library features an array of practical tools, including MACD with Dynamic Length, Stochastic RSI with ATR Stop Loss, Bollinger Bands with RSI Divergence, and more.
The PeacefulIndicators library offers the following functions:
macdDynamicLength: An adaptive version of the classic MACD indicator, which adjusts the lengths of the moving averages based on the dominant cycle period, providing a more responsive signal.
rsiDivergence: A unique implementation of RSI Divergence detection that identifies potential bullish and bearish divergences using a combination of RSI and linear regression.
trendReversalDetection: A helpful tool for detecting trend reversals using the Rate of Change (ROC) and Moving Averages, offering valuable insights into possible market shifts.
volume_flow_oscillator: A custom oscillator that combines price movement strength and volume to provide a unique perspective on market dynamics.
weighted_volatility_oscillator: Another custom oscillator that factors in price volatility and volume to deliver a comprehensive view of market fluctuations.
rvo: The Relative Volume Oscillator highlights changes in volume relative to historical averages, helping to identify potential breakouts or reversals.
acb: The Adaptive Channel Breakout indicator combines a moving average with an adjustable volatility multiplier to create dynamic channels, useful for identifying potential trend shifts.
We hope this library proves to be a valuable addition to your trading toolbox.
Library "peacefulIndicators"
A custom library of technical indicators for trading analysis, including MACD with Dynamic Length, Stochastic RSI with ATR Stop Loss, Bollinger Bands with RSI Divergence, and more.
macdDynamicLength(src, shortLen, longLen, signalLen, dynLow, dynHigh)
Moving Average Convergence Divergence with Dynamic Length
Parameters:
src (float) : Series to use
shortLen (int) : Shorter moving average length
longLen (int) : Longer moving average length
signalLen (int) : Signal line length
dynLow (int) : Lower bound for the dynamic length
dynHigh (int) : Upper bound for the dynamic length
Returns: tuple of MACD line and Signal line
Computes MACD using lengths adapted based on the dominant cycle period
rsiDivergence(src, rsiLen, divThreshold, linRegLength)
RSI Divergence Detection
Parameters:
src (float) : Series to use
rsiLen (simple int) : Length for RSI calculation
divThreshold (float) : Divergence threshold for RSI
linRegLength (int) : Length for linear regression calculation
Returns: tuple of RSI Divergence (positive, negative)
Computes RSI Divergence detection that identifies bullish (positive) and bearish (negative) divergences
trendReversalDetection(src, rocLength, maLength, maType)
Trend Reversal Detection (TRD)
Parameters:
src (float) : Series to use
rocLength (int) : Length for Rate of Change calculation
maLength (int) : Length for Moving Average calculation
maType (string) : Type of Moving Average to use (default: "sma")
Returns: A tuple containing trend reversal direction and the reversal point
Detects trend reversals using the Rate of Change (ROC) and Moving Averages.
volume_flow_oscillator(src, length)
Volume Flow Oscillator
Parameters:
src (float) : Series to use
length (int) : Period for the calculation
Returns: Custom Oscillator value
Computes the custom oscillator based on price movement strength and volume
weighted_volatility_oscillator(src, length)
Weighted Volatility Oscillator
Parameters:
src (float) : Series to use
length (int) : Period for the calculation
Returns: Custom Oscillator value
Computes the custom oscillator based on price volatility and volume
rvo(length)
Relative Volume Oscillator
Parameters:
length (int) : Period for the calculation
Returns: Custom Oscillator value
Computes the custom oscillator based on relative volume
acb(price_series, ma_length, vol_length, multiplier)
Adaptive Channel Breakout
Parameters:
price_series (float) : Price series to use
ma_length (int) : Period for the moving average calculation
vol_length (int) : Period for the volatility calculation
multiplier (float) : Multiplier for the volatility
Returns: Tuple containing the ACB upper and lower values and the trend direction (1 for uptrend, -1 for downtrend)

Antares_messages_publicLibrary "Antares_messages_public"
This library add messages for yours strategy for use in Antares trading system for binance and bybit exchanges.
Данная библиотека позволяет формировать сообщения в алертах стратегий для Antares в более упрощенном для пользователя режиме, включая всплывающие подсказки и т.д.
set_leverage(token, market, ticker_id, leverage)
Set leverage for ticker on specified market.
Parameters:
token (string) : (integer or 0) token for trade in system, if = 0 then token part mess is empty. Токен, При значениb = 0 не включается в формирование строки алерта.
market (string) : (string) Spot 'binance' , 'bybit' . Futures ('binancefru','binancefro','bybitfu', 'bybitfi'). Строковая переменная названия биржи.
ticker_id (string) : (string) ticker in market ('btcusdt', 'ethusdt' etc...). Строковая переменная названия тикера (пары).
leverage (float) : (float) leverage level. Устанавливаемое плечо.
Returns: 'Set leverage message'.
pause(time_pause)
Set pause in message. '::' -left and '::' -right included.
Parameters:
time_pause (int)
LongLimit(token, market, ticker_id, type_qty, quantity, price, orderId, leverageforqty)
Buy order with limit price and quantity.
Лимитный ордер на покупку(в лонг).
Parameters:
token (string) : (integer or 0) token for trade in system, if = 0 then token part mess is empty. Токен, При значениb = 0 не включается в формирование строки алерта.
market (string) : (string) Spot 'binance' , 'bybit' . Futures ('binancefru','binancefro','bybitfu', 'bybitfi'). Строковая переменная названия биржи.
ticker_id (string) : (string) ticker in market ('btcusdt', 'ethusdt' etc...). Строковая переменная названия тикера (пары).
type_qty (string) : (string) type of quantity: 1. 'qty' or '' or na - standart (in coins), 2. 'quqty'- in assets (usdt,btc,etc..), 3.open% - open position(futures) or buy (spot) in % of base 4. close% - close in % of position (futures) or sell (spot) coins in % for current quantity
quantity (float) : (float) orders size, see at 'type_qty'. Размер ордера, базы или % в соответствии с 'type_qty'
price (float) : (float) price for limit order. Цена по которой должен быть установлен лимитный ордер.
orderId (string) : (string) if use order id you may change or cancel your order after or set it ''. Используйте OrderId если хотите изменить или отменить ордер в будущем.
leverageforqty (bool) : (bool) use leverage in qty. Использовать плечо при расчете количества или нет.
Returns: 'Limit Buy order'. Лимитный ордер на покупку (лонг).
LongMarket(token, market, ticker_id, type_qty, quantity, leverageforqty)
Market Buy order with quantity.
Рыночный ордер на покупку (в лонг).
Parameters:
token (string) : (integer or 0) token for trade in system, if = 0 then token part mess is empty. Токен, При значениb = 0 не включается в формирование строки алерта.
market (string) : (string) Spot 'binance' , 'bybit' . Futures ('binancefru','binancefro','bybitfu', 'bybitfi'). Строковая переменная названия биржи.
ticker_id (string) : (string) ticker in market ('btcusdt', 'ethusdt' etc...). Строковая переменная названия тикера (пары).
type_qty (string) : (string) type of quantity: 1. 'qty' or '' or na - standart (in coins), 2. 'quqty'- in assets (usdt,btc,etc..), 3.open% - open position(futures) or buy (spot) in % of base 4. close% - close in % of position (futures) or sell (spot) coins in % for current quantity
quantity (float) : (float) orders size, see at 'type_qty'. Размер ордера, базы или % в соответствии с 'type_qty'
leverageforqty (int) : (bool) use leverage in qty. Использовать плечо при расчете количества или нет.
Returns: 'Market Buy order'. Маркетный ордер на покупку (лонг).
ShortLimit(token, market, ticker_id, type_qty, quantity, price, leverageforqty, orderId)
Sell order with limit price and quantity.
Лимитный ордер на продажу(в шорт).
Parameters:
token (string) : (integer or 0) token for trade in system, if = 0 then token part mess is empty. Токен, При значениb = 0 не включается в формирование строки алерта.
market (string) : (string) Spot 'binance' , 'bybit' . Futures ('binancefru','binancefro','bybitfu', 'bybitfi'). Строковая переменная названия биржи.
ticker_id (string) : (string) ticker in market ('btcusdt', 'ethusdt' etc...). Строковая переменная названия тикера (пары).
type_qty (string) : (string) type of quantity: 1. 'qty' or '' or na - standart (in coins), 2. 'quqty'- in assets (usdt,btc,etc..), 3.open% - open position(futures) or buy (spot) in % of base 4. close% - close in % of position (futures) or sell (spot) coins in % for current quantity
quantity (float) : (float) orders size, see at 'type_qty'. Размер ордера, базы или % в соответствии с 'type_qty'
price (float) : (float) price for limit order. Цена по которой должен быть установлен лимитный ордер.
leverageforqty (bool) : (bool) use leverage in qty. Использовать плечо при расчете количества или нет.
orderId (string) : (string) if use order id you may change or cancel your order after or set it ''. Используйте OrderId если хотите изменить или отменить ордер в будущем.
Returns: 'Limit Sell order'. Лимитный ордер на продажу (шорт).
ShortMarket(token, market, ticker_id, type_qty, quantity, leverageforqty)
Sell by market price and quantity.
Рыночный ордер на продажу(в шорт).
Parameters:
token (string) : (integer or 0) token for trade in system, if = 0 then token part mess is empty. Токен, При значениb = 0 не включается в формирование строки алерта.
market (string) : (string) Spot 'binance' , 'bybit' . Futures ('binancefru','binancefro','bybitfu', 'bybitfi'). Строковая переменная названия биржи.
ticker_id (string) : (string) ticker in market ('btcusdt', 'ethusdt' etc...). Строковая переменная названия тикера (пары).
type_qty (string) : (string) type of quantity: 1. 'qty' or '' or na - standart (in coins), 2. 'quqty'- in assets (usdt,btc,etc..), 3.open% - open position(futures) or buy (spot) in % of base 4. close% - close in % of position (futures) or sell (spot) coins in % for current quantity
quantity (float) : (float) orders size, see at 'type_qty'. Размер ордера, базы или % в соответствии с 'type_qty'
leverageforqty (int) : (bool) use leverage in qty. Использовать плечо при расчете количества или нет.
Returns: 'Market Sell order'. Маркетный ордер на продажу (шорт).
Cancel_by_ticker(token, market, ticker_id)
Cancel all orders for market and ticker in setups. Отменяет все ордера на заданной бирже и заданном токене(паре).
Parameters:
token (string)
market (string) : (string) Spot 'binance' , 'bybit' . Futures ('binancefru','binancefro','bybitfu', 'bybitfi'). Строковая переменная названия биржи.
ticker_id (string) : (string) ticker in market ('btcusdt', 'ethusdt' etc...). Строковая переменная названия тикера (пары).
Returns: 'Cancel all orders'. Отмена всех ордеров на заданной бирже и заданном токене(паре).
Cancel_by_id(token, market, ticker_id, orderId)
Cancel order by Id for market and ticker in setups. Отменяет ордер по Id на заданной бирже и заданном токене(паре).
Parameters:
token (string)
market (string) : (string) Spot 'binance' , 'bybit' . Futures ('binancefru','binancefro','bybitfu', 'bybitfi'). Строковая переменная названия биржи.
ticker_id (string) : (string) ticker in market ('btcusdt', 'ethusdt' etc...). Строковая переменная названия тикера (пары).
orderId (string)
Returns: 'Cancel order'. Отмена ордера по Id на заданной бирже и заданном токене(паре).
Close_positions(token, market, ticker_id)
Close all positions for market and ticker in setups. Закрывает все позиции на заданной бирже и заданном токене(паре).
Parameters:
token (string)
market (string) : (string) Spot 'binance' , 'bybit' . Futures ('binancefru','binancefro','bybitfu', 'bybitfi'). Строковая переменная названия биржи.
ticker_id (string) : (string) ticker in market ('btcusdt', 'ethusdt' etc...). Строковая переменная названия тикера (пары).
Returns: 'Close positions'
CloseLongLimit(token, market, ticker_id, type_qty, quantity, price, orderId, leverageforqty)
Close limit order for long position. (futures)
Лимитный ордер на продажу(в шорт) для закрытия лонговой позиции(reduceonly).
Parameters:
token (string) : (integer or 0) token for trade in system, if = 0 then token part mess is empty. Токен, При значениb = 0 не включается в формирование строки алерта.
market (string) : (string) Spot 'binance' , 'bybit' . Futures ('binancefru','binancefro','bybitfu', 'bybitfi'). Строковая переменная названия биржи.
ticker_id (string) : (string) ticker in market ('btcusdt', 'ethusdt' etc...). Строковая переменная названия тикера (пары).
type_qty (string) : (string) type of quantity: 1. 'qty' or '' or na - standart (in coins), 2. 'quqty'- in assets (usdt,btc,etc..), 3.open% - open position(futures) or buy (spot) in % of base 4. close% - close in % of position (futures) or sell (spot) coins in % for current quantity
quantity (float) : (float) orders size, see at 'type_qty'. Размер ордера, базы или % в соответствии с 'type_qty'
price (float) : (float) price for limit order. Цена по которой должен быть установлен лимитный ордер.
orderId (string) : (string) if use order id you may change or cancel your order after or set it ''. Используйте OrderId если хотите изменить или отменить ордер в будущем.
leverageforqty (bool) : (bool) use leverage in qty. Использовать плечо при расчете количества или нет.
Returns: 'Limit Sell order reduce only (close long position)'. Лимитный ордер на продажу для снижения текущего лонга(в шорт не входит).
CloseLongMarket(token, market, ticker_id, type_qty, quantity, leverageforqty)
Close market order for long position.
Рыночный ордер на продажу(в шорт) для закрытия лонговой позиции(reduceonly).
Parameters:
token (string) : (integer or 0) token for trade in system, if = 0 then token part mess is empty. Токен, При значениb = 0 не включается в формирование строки алерта.
market (string) : (string) Spot 'binance' , 'bybit' . Futures ('binancefru','binancefro','bybitfu', 'bybitfi'). Строковая переменная названия биржи.
ticker_id (string) : (string) ticker in market ('btcusdt', 'ethusdt' etc...). Строковая переменная названия тикера (пары).
type_qty (string) : (string) type of quantity: 1. 'qty' or '' or na - standart (in coins), 2. 'quqty'- in assets (usdt,btc,etc..), 3.open% - open position(futures) or buy (spot) in % of base 4. close% - close in % of position (futures) or sell (spot) coins in % for current quantity
quantity (float) : (float) orders size, see at 'type_qty'. Размер ордера, базы или % в соответствии с 'type_qty'
leverageforqty (bool) : (bool) use leverage in qty. Использовать плечо при расчете количества или нет.
Returns: 'Market Sell order reduce only (close long position)'. Ордер на снижение/закрытие текущего лонга(в шорт не входит) по рыночной цене.
CloseShortLimit(token, market, ticker_id, type_qty, quantity, price, orderId, leverageforqty)
Close limit order for short position.
Лимитный ордер на покупку(в лонг) для закрытия шортовой позиции(reduceonly).
Parameters:
token (string) : (integer or 0) token for trade in system, if = 0 then token part mess is empty. Токен, При значениb = 0 не включается в формирование строки алерта.
market (string) : (string) Spot 'binance' , 'bybit' . Futures ('binancefru','binancefro','bybitfu', 'bybitfi'). Строковая переменная названия биржи.
ticker_id (string) : (string) ticker in market ('btcusdt', 'ethusdt' etc...). Строковая переменная названия тикера (пары).
type_qty (string) : (string) type of quantity: 1. 'qty' or '' or na - standart (in coins), 2. 'quqty'- in assets (usdt,btc,etc..), 3.open% - open position(futures) or buy (spot) in % of base 4. close% - close in % of position (futures) or sell (spot) coins in % for current quantity
quantity (float) : (float) orders size, see at 'type_qty'. Размер ордера, базы или % в соответствии с 'type_qty'
price (float) : (float) price for limit order. Цена по которой должен быть установлен лимитный ордер.
orderId (string) : (string) if use order id you may change or cancel your order after or set it ''. Используйте OrderId если хотите изменить или отменить ордер в будущем.
leverageforqty (bool) : (bool) use leverage in qty. Использовать плечо при расчете количества или нет.
Returns: 'Limit Buy order reduce only (close short position)' . Лимитный ордер на покупку (лонг) для сокращения/закрытия текущего шорта.
CloseShortMarket(token, market, ticker_id, type_qty, quantity, leverageforqty)
Set Close limit order for long position.
Рыночный ордер на покупку(в лонг) для сокращения/закрытия шортовой позиции(reduceonly).
Parameters:
token (string) : (integer or 0) token for trade in system, if = 0 then token part mess is empty. Токен, При значениb = 0 не включается в формирование строки алерта.
market (string) : (string) Spot 'binance' , 'bybit' . Futures ('binancefru','binancefro','bybitfu', 'bybitfi'). Строковая переменная названия биржи.
ticker_id (string) : (string) ticker in market ('btcusdt', 'ethusdt' etc...). Строковая переменная названия тикера (пары).
type_qty (string) : (string) type of quantity: 1. 'qty' or '' or na - standart (in coins), 2. 'quqty'- in assets (usdt,btc,etc..), 3.open% - open position(futures) or buy (spot) in % of base 4. close% - close in % of position (futures) or sell (spot) coins in % for current quantity
quantity (float) : (float) orders size, see at 'type_qty'. Размер ордера, базы или % в соответствии с 'type_qty'
leverageforqty (bool) : (bool) use leverage in qty. Использовать плечо при расчете количества или нет.
Returns: 'Market Buy order reduce only (close short position)'. Маркетного ордера на покупку (лонг) для сокращения/закрытия текущего шорта.
cancel_all_close(token, market, ticker_id)
Parameters:
token (string)
market (string)
ticker_id (string)
limit_tpsl_bybitfu(token, ticker_id, order_id, side, type_qty, quantity, price, tp_price, sl_price, leverageforqty)
Set multi order for Bybit : limit + takeprofit + stoploss
Выставление тройного ордера на Bybit лимитка со стоплоссом и тейкпрофитом
Parameters:
token (string) : (integer or 0) token for trade in system, if = 0 then token part mess is empty. Токен, При значениb = 0 не включается в формирование строки алерта.
ticker_id (string) : (string) ticker in market ('btcusdt', 'ethusdt' etc...). Строковая переменная названия тикера (пары).
order_id (string)
side (bool) : (bool) "buy side" if true or "sell side" if false. true для лонга, false для шорта.
type_qty (string) : (string) type of quantity: 1. 'qty' or '' or na - standart (in coins), 2. 'quqty'- in assets (usdt,btc,etc..), 3.open% - open position(futures) or buy (spot) in % of base 4. close% - close in % of position (futures) or sell (spot) coins in % for current quantity
quantity (float) : (float) orders size, see at 'type_qty'. Размер ордера, базы или % в соответствии с 'type_qty'
price (float) : (float) price for limit order by 'side'. Цена лимитного ордера
tp_price (float) : (float) price for take profit order.
sl_price (float) : (float) price for stoploss order
leverageforqty (bool) : (bool) use leverage in qty. Использовать плечо при расчете количества или нет.
Returns: Set multi order for Bybit : limit + takeprofit + stoploss.
replace_limit_tpsl_bybitfu(token, ticker_id, order_id, side, type_qty, quantity, price, tp_price, sl_price, leverageforqty)
Change multi order for Bybit : limit + takeprofit + stoploss
Изменение тройного ордера на Bybit лимитка со стоплоссом и тейкпрофитом
Parameters:
token (string) : (integer or 0) token for trade in system, if = 0 then token part mess is empty. Токен, При значениb = 0 не включается в формирование строки алерта.
ticker_id (string) : (string) ticker in market ('btcusdt', 'ethusdt' etc...). Строковая переменная названия тикера (пары).
order_id (string)
side (bool) : (bool) "buy side" if true or "sell side" if false. true для лонга, false для шорта.
type_qty (string) : (string) type of quantity: 1. 'qty' or '' or na - standart (in coins), 2. 'quqty'- in assets (usdt,btc,etc..), 3.open% - open position(futures) or buy (spot) in % of base 4. close% - close in % of position (futures) or sell (spot) coins in % for current quantity
quantity (float) : (float) orders size, see at 'type_qty'. Размер ордера, базы или % в соответствии с 'type_qty'
price (float) : (float) price for limit order by 'side'. Цена лимитного ордера
tp_price (float) : (float) price for take profit order.
sl_price (float) : (float) price for stoploss order
leverageforqty (bool) : (bool) use leverage in qty. Использовать плечо при расчете количества или нет.
Returns: Set multi order for Bybit : limit + takeprofit + stoploss.
long_stop(token, market, ticker_id, type_qty, quantity, l_stop, leverageforqty)
Stop market order for long position
Рыночный стоп-ордер на продажу для закрытия лонговой позиции.
Parameters:
token (string)
market (string) : (string) 'binance' , 'binancefru' etc.. Строковая переменная названия биржи.
ticker_id (string) : (string) ticker in market ('btcusdt', 'ethusdt' etc...). Строковая переменная названия тикера (пары).
type_qty (string) : (string) type of quantity: 1. 'qty' or '' or na - standart (in coins), 2. 'quqty'- in assets (usdt,btc,etc..), 3.open% - open position(futures) or buy (spot) in % of base 4. close% - close in % of position (futures) or sell (spot) coins in % for current quantity
quantity (float) : (float) orders size. Размер ордера.
l_stop (float) : (float) price for activation stop order. Цена активации стоп-ордера.
leverageforqty (bool) : (bool) use leverage in qty. Использовать плечо при расчете количества или нет.
Returns: 'Stop Market Sell order (close long position)'. Маркетный стоп-ордер на снижения/закрытия текущего лонга.
short_stop(token, market, ticker_id, type_qty, quantity, s_stop, leverageforqty)
Stop market order for short position
Рыночный стоп-ордер на покупку(в лонг) для закрытия шорт позиции.
Parameters:
token (string)
market (string) : (string) 'binance' , 'binancefru' etc.. Строковая переменная названия биржи.
ticker_id (string) : (string) ticker in market ('btcusdt', 'ethusdt' etc...). Строковая переменная названия тикера (пары).
type_qty (string) : (string) type of quantity: 1. 'qty' or '' or na - standart (in coins), 2. 'quqty'- in assets (usdt,btc,etc..), 3.open% - open position(futures) or buy (spot) in % of base 4. close% - close in % of position (futures) or sell (spot) coins in % for current quantity
quantity (float) : (float) orders size. Размер ордера.
s_stop (float) : (float) price for activation stop order. Цена активации стоп-ордера.
leverageforqty (bool) : (bool) use leverage in qty. Использовать плечо при расчете количества или нет.
Returns: 'Stop Market Buy order (close short position)'. Маркетный стоп-ордер на снижения/закрытия текущего шорта.
change_stop_l(token, market, ticker_id, type_qty, quantity, l_stop, leverageforqty)
Change Stop market order for long position
Изменяем стоп-ордер на продажу(в шорт) для закрытия лонг позиции.
Parameters:
token (string)
market (string) : (string) 'binance' , 'binancefru' etc.. Строковая переменная названия биржи.
ticker_id (string) : (string) ticker in market ('btcusdt', 'ethusdt' etc...). Строковая переменная названия тикера (пары).
type_qty (string) : (string) type of quantity: 1. 'qty' or '' or na - standart (in coins), 2. 'quqty'- in assets (usdt,btc,etc..), 3.open% - open position(futures) or buy (spot) in % of base 4. close% - close in % of position (futures) or sell (spot) coins in % for current quantity
quantity (float) : (float) orders size. Размер ордера.
l_stop (float) : (float) price for activation stop order. Цена активации стоп-ордера.
leverageforqty (bool) : (bool) use leverage in qty. Использовать плечо при расчете количества или нет.
Returns: 'Change Stop Market Buy order (close long position)'. Смещает цену активации Маркетного стоп-ордер на снижения/закрытия текущего лонга.
change_stop_s(token, market, ticker_id, type_qty, quantity, s_stop, leverageforqty)
Change Stop market order for short position
Смещает цену активации Рыночного стоп-ордера на покупку(в лонг) для закрытия шорт позиции.
Parameters:
token (string)
market (string) : (string) 'binance' , 'binancefru' etc.. Строковая переменная названия биржи.
ticker_id (string) : (string) ticker in market ('btcusdt', 'ethusdt' etc...). Строковая переменная названия тикера (пары).
type_qty (string)
quantity (float) : (float) orders size. Размер ордера.
s_stop (float) : (float) price for activation stop order. Цена активации стоп-ордера.
leverageforqty (bool) : (bool) use leverage in qty. Использовать плечо при расчете количества или нет.
Returns: 'Change Stop Market Buy order (close short position)'. Смещает цену активации Маркетного стоп-ордер на снижения/закрытия текущего шорта.
open_long_position(token, market, ticker_id, type_qty, quantity, l_stop, leverageforqty)
Cancel and close all orders and positions by ticker , then open Long position by market price with stop order
Отменяет все лимитки и закрывает все позы по тикеру, затем открывает лонг по маркету с выставлением стопа (переворот позиции, при необходимости).
Parameters:
token (string)
market (string) : (string) 'binance' , 'binancefru' etc.. Строковая переменная названия биржи.
ticker_id (string) : (string) ticker in market ('btcusdt', 'ethusdt' etc...). Строковая переменная названия тикера (пары).
type_qty (string) : (string) type of quantity: 1. 'qty' or '' or na - standart (in coins), 2. 'quqty'- in assets (usdt,btc,etc..), 3.open% - open position(futures) or buy (spot) in % of base 4. close% - close in % of position (futures) or sell (spot) coins in % for current quantity
quantity (float) : (float) orders size. Размер ордера.
l_stop (float) : (float). Price for activation stop loss. Цена активации стоп-лосса.
leverageforqty (int) : (bool) use leverage in qty. Использовать плечо при расчете количества или нет.
Returns: 'command_all_close + LongMarket + long_stop.
open_short_position(token, market, ticker_id, type_qty, quantity, s_stop, leverageforqty)
Cancel and close all orders and positions , then open Short position by market price with stop order
Отменяет все лимитки и закрывает все позы по тикеру, затем открывает шорт по маркету с выставлением стопа(переворот позиции, при необходимости).
Parameters:
token (string)
market (string) : (string) 'binance' , 'binancefru' etc.. Строковая переменная названия биржи.
ticker_id (string) : (string) ticker in market ('btcusdt', 'ethusdt' etc...). Строковая переменная названия тикера (пары).
type_qty (string) : (string) type of quantity: 1. 'qty' or '' or na - standart (in coins), 2. 'quqty'- in assets (usdt,btc,etc..), 3.open% - open position(futures) or buy (spot) in % of base 4. close% - close in % of position (futures) or sell (spot) coins in % for current quantity
quantity (float) : (float) orders size. Размер ордера.
s_stop (float) : (float). Price for activation stop loss. Цена активации стоп-лосса.
leverageforqty (int) : (bool) use leverage in qty. Использовать плечо при расчете количества или нет.
Returns: 'command_all_close + ShortMarket + short_stop'.
open_long_trade(token, market, ticker_id, type_qty, quantity, l_stop, qty_ex1, price_ex1, qty_ex2, price_ex2, qty_ex3, price_ex3, leverageforqty)
Cancell and close all orders and positions , then open Long position by market price with stop order and take 1 ,take 2, take 3
Отменяет все лимитки и закрывает все позы по тикеру, затем открывает лонг по маркету с выставлением стопа и 3 тейками (переворот позиции, при необходимости).
Parameters:
token (string)
market (string) : (string) 'binance' , 'binancefru' etc.. Строковая переменная названия биржи.
ticker_id (string) : (string) ticker in market ('btcusdt', 'ethusdt' etc...). Строковая переменная названия тикера (пары).
type_qty (string) : (string) type of quantity: 1. 'qty' or '' or na - standart (in coins), 2. 'quqty'- in assets (usdt,btc,etc..), 3.open% - open position(futures) or buy (spot) in % of base 4. close% - close in % of position (futures) or sell (spot) coins in % for current quantity
quantity (float) : (float) enter order size, see at type_qty. Размер ордера входа, согласно type_qty.
l_stop (float) : (float). Price for activation stop loss. Цена активации стоп-лосса.
qty_ex1 (float) : (float). Quantity for 1th take see at type_qty, if = 0 string for order dont set. Размер лимитного ордера для 1го тейка, согласно type_qty.. Если 0, то строка для этого тейка не формируется
price_ex1 (float) : (float). Price for 1th take , if = 0 string for order dont set. Цена лимитного ордера для 1го тейка. Если 0, то строка для этого тейка не формируется
qty_ex2 (float) : (float). Quantity for 2th take see at type_qty, if = 0 string for order dont set. Размер лимитного ордера для 2го тейка, согласно type_qty..Если 0, то строка для этого тейка не формируется
price_ex2 (float) : (float). Price for 2th take, if = 0 string for order dont set. Цена лимитного ордера для 2го тейка. Если 0, то строка для этого тейка не формируется
qty_ex3 (float) : (float). Quantity for 3th take see at type_qty, if = 0 string for order dont set. Размер лимитного ордера для 2го тейка, согласно type_qty..Если 0, то строка для этого тейка не формируется
price_ex3 (float) : (float). Price for 3th take, if = 0 string for order dont set. Цена лимитного ордера для 3го тейка. Если 0, то строка для этого тейка не формируется
leverageforqty (int)
Returns: 'cancel_all_close + LongMarket + long_stop + CloseLongLimit1 + CloseLongLimit2+CloseLongLimit3'.
open_short_trade(token, market, ticker_id, type_qty, quantity, s_stop, qty_ex1, price_ex1, qty_ex2, price_ex2, qty_ex3, price_ex3, leverageforqty)
Cancell and close all orders and positions , then open Short position by market price with stop order and take 1 and take 2
Отменяет все лимитки и закрывает все позы по тикеру, затем открывает шорт по маркету с выставлением стопа и 3 тейками (переворот позиции, при необходимости).
Parameters:
token (string)
market (string) : (string) 'binance' , 'binancefru' etc.. Строковая переменная названия биржи.
ticker_id (string) : (string) ticker in market ('btcusdt', 'ethusdt' etc...). Строковая переменная названия тикера (пары).
type_qty (string)
quantity (float)
s_stop (float) : (float). Price for activation stop loss. Цена активации стоп-лосса.
qty_ex1 (float) : (float). Quantity for 1th take see at type_qty, if = 0 string for order dont set. Размер лимитного ордера для 1го тейка, согласно type_qty.. Если 0, то строка для этого тейка не формируется
price_ex1 (float) : (float). Price for 1th take , if = 0 string for order dont set. Цена лимитного ордера для 1го тейка. Если 0, то строка для этого тейка не формируется
qty_ex2 (float) : (float). Quantity for 2th take see at type_qty, if = 0 string for order dont set. Размер лимитного ордера для 2го тейка, согласно type_qty..Если 0, то строка для этого тейка не формируется
price_ex2 (float) : (float). Price for 2th take, if = 0 string for order dont set. Цена лимитного ордера для 2го тейка. Если 0, то строка для этого тейка не формируется
qty_ex3 (float) : (float). Quantity for 3th take see at type_qty, if = 0 string for order dont set. Размер лимитного ордера для 2го тейка, согласно type_qty..Если 0, то строка для этого тейка не формируется
price_ex3 (float) : (float). Price for 3th take, if = 0 string for order dont set. Цена лимитного ордера для 3го тейка. Если 0, то строка для этого тейка не формируется
leverageforqty (int)
Returns: 'command_all_close + ShortMarket + short_stop + CloseShortLimit + CloseShortLimit(2)'.
Multi_LongLimit(token, market, ticker_id, type_qty, qty1, price1, qty2, price2, qty3, price3, qty4, price4, qty5, price5, qty6, price6, qty7, price7, qty8, price8, leverageforqty)
8 or less Buy orders with limit price and quantity.
До 8 Лимитных ордеров на покупку(в лонг).
Parameters:
token (string) : (integer or 0) token for trade in system, if = 0 then token part mess is empty. Токен, При значениb = 0 не включается в формирование строки алерта.
market (string) : (string) Spot 'binance' , 'bybit' . Futures ('binancefru','binancefro','bybitfu', 'bybitfi'). Строковая переменная названия биржи.
ticker_id (string) : (string) ticker in market ('btcusdt', 'ethusdt' etc...). Строковая переменная названия тикера (пары).
type_qty (string) : (string) type of quantity: 1. 'qty' or '' or na - standart (in coins), 2. 'quqty'- in assets (usdt,btc,etc..), 3.open% - open position(futures) or buy (spot) in % of base 4. close% - close in % of position (futures) or sell (spot) coins in % for current quantity
qty1 (float)
price1 (float)
qty2 (float)
price2 (float)
qty3 (float)
price3 (float)
qty4 (float)
price4 (float)
qty5 (float)
price5 (float)
qty6 (float)
price6 (float)
qty7 (float)
price7 (float)
qty8 (float)
price8 (float)
leverageforqty (bool) : (bool) use leverage in qty. Использовать плечо при расчете количества или нет.
Returns: 'Limit Buy order'. Лимитный ордер на покупку (лонг).
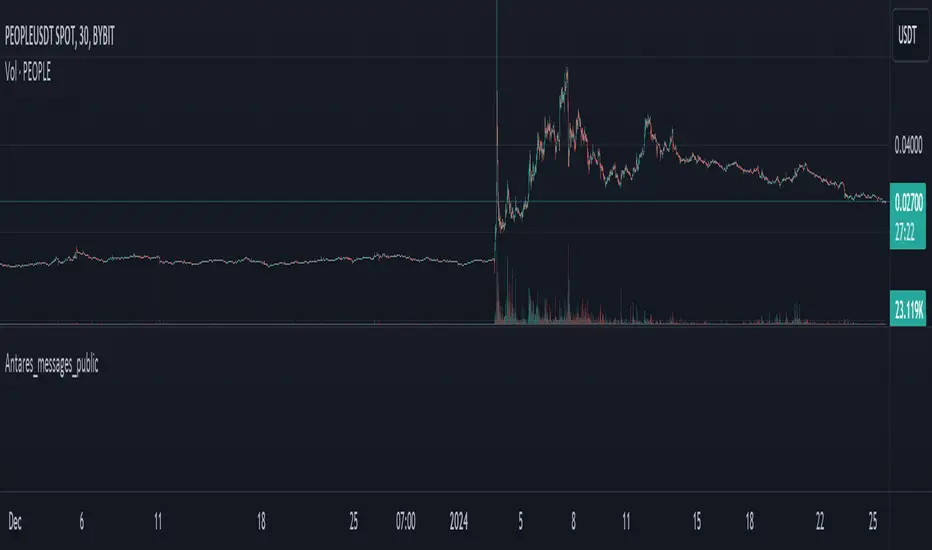
UtilityLibrary "Utility"
dema(src, length)
Parameters:
src (float)
length (simple int)
tema(src, length)
Parameters:
src (float)
length (simple int)
hma(src, length)
Parameters:
src (float)
length (int)
zlema(src, length)
Parameters:
src (float)
length (simple int)
stochRSI(src, lengthRSI, lengthStoch, smoothK, smoothD)
Parameters:
src (float)
lengthRSI (simple int)
lengthStoch (int)
smoothK (int)
smoothD (int)
slope(src, length)
Parameters:
src (float)
length (int)

loxxfftLibrary "loxxfft"
This code is a library for performing Fast Fourier Transform (FFT) operations. FFT is an algorithm that can quickly compute the discrete Fourier transform (DFT) of a sequence. The library includes functions for performing FFTs on both real and complex data. It also includes functions for fast correlation and convolution, which are operations that can be performed efficiently using FFTs. Additionally, the library includes functions for fast sine and cosine transforms.
Reference:
www.alglib.net
fastfouriertransform(a, nn, inversefft)
Returns Fast Fourier Transform
Parameters:
a (float ) : float , An array of real and imaginary parts of the function values. The real part is stored at even indices, and the imaginary part is stored at odd indices.
nn (int) : int, The number of function values. It must be a power of two, but the algorithm does not validate this.
inversefft (bool) : bool, A boolean value that indicates the direction of the transformation. If True, it performs the inverse FFT; if False, it performs the direct FFT.
Returns: float , Modifies the input array a in-place, which means that the transformed data (the FFT result for direct transformation or the inverse FFT result for inverse transformation) will be stored in the same array a after the function execution. The transformed data will have real and imaginary parts interleaved, with the real parts at even indices and the imaginary parts at odd indices.
realfastfouriertransform(a, tnn, inversefft)
Returns Real Fast Fourier Transform
Parameters:
a (float ) : float , A float array containing the real-valued function samples.
tnn (int) : int, The number of function values (must be a power of 2, but the algorithm does not validate this condition).
inversefft (bool) : bool, A boolean flag that indicates the direction of the transformation (True for inverse, False for direct).
Returns: float , Modifies the input array a in-place, meaning that the transformed data (the FFT result for direct transformation or the inverse FFT result for inverse transformation) will be stored in the same array a after the function execution.
fastsinetransform(a, tnn, inversefst)
Returns Fast Discrete Sine Conversion
Parameters:
a (float ) : float , An array of real numbers representing the function values.
tnn (int) : int, Number of function values (must be a power of two, but the code doesn't validate this).
inversefst (bool) : bool, A boolean flag indicating the direction of the transformation. If True, it performs the inverse FST, and if False, it performs the direct FST.
Returns: float , The output is the transformed array 'a', which will contain the result of the transformation.
fastcosinetransform(a, tnn, inversefct)
Returns Fast Discrete Cosine Transform
Parameters:
a (float ) : float , This is a floating-point array representing the sequence of values (time-domain) that you want to transform. The function will perform the Fast Cosine Transform (FCT) or the inverse FCT on this input array, depending on the value of the inversefct parameter. The transformed result will also be stored in this same array, which means the function modifies the input array in-place.
tnn (int) : int, This is an integer value representing the number of data points in the input array a. It is used to determine the size of the input array and control the loops in the algorithm. Note that the size of the input array should be a power of 2 for the Fast Cosine Transform algorithm to work correctly.
inversefct (bool) : bool, This is a boolean value that controls whether the function performs the regular Fast Cosine Transform or the inverse FCT. If inversefct is set to true, the function will perform the inverse FCT, and if set to false, the regular FCT will be performed. The inverse FCT can be used to transform data back into its original form (time-domain) after the regular FCT has been applied.
Returns: float , The resulting transformed array is stored in the input array a. This means that the function modifies the input array in-place and does not return a new array.
fastconvolution(signal, signallen, response, negativelen, positivelen)
Convolution using FFT
Parameters:
signal (float ) : float , This is an array of real numbers representing the input signal that will be convolved with the response function. The elements are numbered from 0 to SignalLen-1.
signallen (int) : int, This is an integer representing the length of the input signal array. It specifies the number of elements in the signal array.
response (float ) : float , This is an array of real numbers representing the response function used for convolution. The response function consists of two parts: one corresponding to positive argument values and the other to negative argument values. Array elements with numbers from 0 to NegativeLen match the response values at points from -NegativeLen to 0, respectively. Array elements with numbers from NegativeLen+1 to NegativeLen+PositiveLen correspond to the response values in points from 1 to PositiveLen, respectively.
negativelen (int) : int, This is an integer representing the "negative length" of the response function. It indicates the number of elements in the response function array that correspond to negative argument values. Outside the range , the response function is considered zero.
positivelen (int) : int, This is an integer representing the "positive length" of the response function. It indicates the number of elements in the response function array that correspond to positive argument values. Similar to negativelen, outside the range , the response function is considered zero.
Returns: float , The resulting convolved values are stored back in the input signal array.
fastcorrelation(signal, signallen, pattern, patternlen)
Returns Correlation using FFT
Parameters:
signal (float ) : float ,This is an array of real numbers representing the signal to be correlated with the pattern. The elements are numbered from 0 to SignalLen-1.
signallen (int) : int, This is an integer representing the length of the input signal array.
pattern (float ) : float , This is an array of real numbers representing the pattern to be correlated with the signal. The elements are numbered from 0 to PatternLen-1.
patternlen (int) : int, This is an integer representing the length of the pattern array.
Returns: float , The signal array containing the correlation values at points from 0 to SignalLen-1.
tworealffts(a1, a2, a, b, tn)
Returns Fast Fourier Transform of Two Real Functions
Parameters:
a1 (float ) : float , An array of real numbers, representing the values of the first function.
a2 (float ) : float , An array of real numbers, representing the values of the second function.
a (float ) : float , An output array to store the Fourier transform of the first function.
b (float ) : float , An output array to store the Fourier transform of the second function.
tn (int) : float , An integer representing the number of function values. It must be a power of two, but the algorithm doesn't validate this condition.
Returns: float , The a and b arrays will contain the Fourier transform of the first and second functions, respectively. Note that the function overwrites the input arrays a and b.
█ Detailed explaination of each function
Fast Fourier Transform
The fastfouriertransform() function takes three input parameters:
1. a: An array of real and imaginary parts of the function values. The real part is stored at even indices, and the imaginary part is stored at odd indices.
2. nn: The number of function values. It must be a power of two, but the algorithm does not validate this.
3. inversefft: A boolean value that indicates the direction of the transformation. If True, it performs the inverse FFT; if False, it performs the direct FFT.
The function performs the FFT using the Cooley-Tukey algorithm, which is an efficient algorithm for computing the discrete Fourier transform (DFT) and its inverse. The Cooley-Tukey algorithm recursively breaks down the DFT of a sequence into smaller DFTs of subsequences, leading to a significant reduction in computational complexity. The algorithm's time complexity is O(n log n), where n is the number of samples.
The fastfouriertransform() function first initializes variables and determines the direction of the transformation based on the inversefft parameter. If inversefft is True, the isign variable is set to -1; otherwise, it is set to 1.
Next, the function performs the bit-reversal operation. This is a necessary step before calculating the FFT, as it rearranges the input data in a specific order required by the Cooley-Tukey algorithm. The bit-reversal is performed using a loop that iterates through the nn samples, swapping the data elements according to their bit-reversed index.
After the bit-reversal operation, the function iteratively computes the FFT using the Cooley-Tukey algorithm. It performs calculations in a loop that goes through different stages, doubling the size of the sub-FFT at each stage. Within each stage, the Cooley-Tukey algorithm calculates the butterfly operations, which are mathematical operations that combine the results of smaller DFTs into the final DFT. The butterfly operations involve complex number multiplication and addition, updating the input array a with the computed values.
The loop also calculates the twiddle factors, which are complex exponential factors used in the butterfly operations. The twiddle factors are calculated using trigonometric functions, such as sine and cosine, based on the angle theta. The variables wpr, wpi, wr, and wi are used to store intermediate values of the twiddle factors, which are updated in each iteration of the loop.
Finally, if the inversefft parameter is True, the function divides the result by the number of samples nn to obtain the correct inverse FFT result. This normalization step is performed using a loop that iterates through the array a and divides each element by nn.
In summary, the fastfouriertransform() function is an implementation of the Cooley-Tukey FFT algorithm, which is an efficient algorithm for computing the DFT and its inverse. This FFT library can be used for a variety of applications, such as signal processing, image processing, audio processing, and more.
Feal Fast Fourier Transform
The realfastfouriertransform() function performs a fast Fourier transform (FFT) specifically for real-valued functions. The FFT is an efficient algorithm used to compute the discrete Fourier transform (DFT) and its inverse, which are fundamental tools in signal processing, image processing, and other related fields.
This function takes three input parameters:
1. a - A float array containing the real-valued function samples.
2. tnn - The number of function values (must be a power of 2, but the algorithm does not validate this condition).
3. inversefft - A boolean flag that indicates the direction of the transformation (True for inverse, False for direct).
The function modifies the input array a in-place, meaning that the transformed data (the FFT result for direct transformation or the inverse FFT result for inverse transformation) will be stored in the same array a after the function execution.
The algorithm uses a combination of complex-to-complex FFT and additional transformations specific to real-valued data to optimize the computation. It takes into account the symmetry properties of the real-valued input data to reduce the computational complexity.
Here's a detailed walkthrough of the algorithm:
1. Depending on the inversefft flag, the initial values for ttheta, c1, and c2 are determined. These values are used for the initial data preprocessing and post-processing steps specific to the real-valued FFT.
2. The preprocessing step computes the initial real and imaginary parts of the data using a combination of sine and cosine terms with the input data. This step effectively converts the real-valued input data into complex-valued data suitable for the complex-to-complex FFT.
3. The complex-to-complex FFT is then performed on the preprocessed complex data. This involves bit-reversal reordering, followed by the Cooley-Tukey radix-2 decimation-in-time algorithm. This part of the code is similar to the fastfouriertransform() function you provided earlier.
4. After the complex-to-complex FFT, a post-processing step is performed to obtain the final real-valued output data. This involves updating the real and imaginary parts of the transformed data using sine and cosine terms, as well as the values c1 and c2.
5. Finally, if the inversefft flag is True, the output data is divided by the number of samples (nn) to obtain the inverse DFT.
The function does not return a value explicitly. Instead, the transformed data is stored in the input array a. After the function execution, you can access the transformed data in the a array, which will have the real part at even indices and the imaginary part at odd indices.
Fast Sine Transform
This code defines a function called fastsinetransform that performs a Fast Discrete Sine Transform (FST) on an array of real numbers. The function takes three input parameters:
1. a (float array): An array of real numbers representing the function values.
2. tnn (int): Number of function values (must be a power of two, but the code doesn't validate this).
3. inversefst (bool): A boolean flag indicating the direction of the transformation. If True, it performs the inverse FST, and if False, it performs the direct FST.
The output is the transformed array 'a', which will contain the result of the transformation.
The code starts by initializing several variables, including trigonometric constants for the sine transform. It then sets the first value of the array 'a' to 0 and calculates the initial values of 'y1' and 'y2', which are used to update the input array 'a' in the following loop.
The first loop (with index 'jx') iterates from 2 to (tm + 1), where 'tm' is half of the number of input samples 'tnn'. This loop is responsible for calculating the initial sine transform of the input data.
The second loop (with index 'ii') is a bit-reversal loop. It reorders the elements in the array 'a' based on the bit-reversed indices of the original order.
The third loop (with index 'ii') iterates while 'n' is greater than 'mmax', which starts at 2 and doubles each iteration. This loop performs the actual Fast Discrete Sine Transform. It calculates the sine transform using the Danielson-Lanczos lemma, which is a divide-and-conquer strategy for calculating Discrete Fourier Transforms (DFTs) efficiently.
The fourth loop (with index 'ix') is responsible for the final phase adjustments needed for the sine transform, updating the array 'a' accordingly.
The fifth loop (with index 'jj') updates the array 'a' one more time by dividing each element by 2 and calculating the sum of the even-indexed elements.
Finally, if the 'inversefst' flag is True, the code scales the transformed data by a factor of 2/tnn to get the inverse Fast Sine Transform.
In summary, the code performs a Fast Discrete Sine Transform on an input array of real numbers, either in the direct or inverse direction, and returns the transformed array. The algorithm is based on the Danielson-Lanczos lemma and uses a divide-and-conquer strategy for efficient computation.
Fast Cosine Transform
This code defines a function called fastcosinetransform that takes three parameters: a floating-point array a, an integer tnn, and a boolean inversefct. The function calculates the Fast Cosine Transform (FCT) or the inverse FCT of the input array, depending on the value of the inversefct parameter.
The Fast Cosine Transform is an algorithm that converts a sequence of values (time-domain) into a frequency domain representation. It is closely related to the Fast Fourier Transform (FFT) and can be used in various applications, such as signal processing and image compression.
Here's a detailed explanation of the code:
1. The function starts by initializing a number of variables, including counters, intermediate values, and constants.
2. The initial steps of the algorithm are performed. This includes calculating some trigonometric values and updating the input array a with the help of intermediate variables.
3. The code then enters a loop (from jx = 2 to tnn / 2). Within this loop, the algorithm computes and updates the elements of the input array a.
4. After the loop, the function prepares some variables for the next stage of the algorithm.
5. The next part of the algorithm is a series of nested loops that perform the bit-reversal permutation and apply the FCT to the input array a.
6. The code then calculates some additional trigonometric values, which are used in the next loop.
7. The following loop (from ix = 2 to tnn / 4 + 1) computes and updates the elements of the input array a using the previously calculated trigonometric values.
8. The input array a is further updated with the final calculations.
9. In the last loop (from j = 4 to tnn), the algorithm computes and updates the sum of elements in the input array a.
10. Finally, if the inversefct parameter is set to true, the function scales the input array a to obtain the inverse FCT.
The resulting transformed array is stored in the input array a. This means that the function modifies the input array in-place and does not return a new array.
Fast Convolution
This code defines a function called fastconvolution that performs the convolution of a given signal with a response function using the Fast Fourier Transform (FFT) technique. Convolution is a mathematical operation used in signal processing to combine two signals, producing a third signal representing how the shape of one signal is modified by the other.
The fastconvolution function takes the following input parameters:
1. float signal: This is an array of real numbers representing the input signal that will be convolved with the response function. The elements are numbered from 0 to SignalLen-1.
2. int signallen: This is an integer representing the length of the input signal array. It specifies the number of elements in the signal array.
3. float response: This is an array of real numbers representing the response function used for convolution. The response function consists of two parts: one corresponding to positive argument values and the other to negative argument values. Array elements with numbers from 0 to NegativeLen match the response values at points from -NegativeLen to 0, respectively. Array elements with numbers from NegativeLen+1 to NegativeLen+PositiveLen correspond to the response values in points from 1 to PositiveLen, respectively.
4. int negativelen: This is an integer representing the "negative length" of the response function. It indicates the number of elements in the response function array that correspond to negative argument values. Outside the range , the response function is considered zero.
5. int positivelen: This is an integer representing the "positive length" of the response function. It indicates the number of elements in the response function array that correspond to positive argument values. Similar to negativelen, outside the range , the response function is considered zero.
The function works by:
1. Calculating the length nl of the arrays used for FFT, ensuring it's a power of 2 and large enough to hold the signal and response.
2. Creating two new arrays, a1 and a2, of length nl and initializing them with the input signal and response function, respectively.
3. Applying the forward FFT (realfastfouriertransform) to both arrays, a1 and a2.
4. Performing element-wise multiplication of the FFT results in the frequency domain.
5. Applying the inverse FFT (realfastfouriertransform) to the multiplied results in a1.
6. Updating the original signal array with the convolution result, which is stored in the a1 array.
The result of the convolution is stored in the input signal array at the function exit.
Fast Correlation
This code defines a function called fastcorrelation that computes the correlation between a signal and a pattern using the Fast Fourier Transform (FFT) method. The function takes four input arguments and modifies the input signal array to store the correlation values.
Input arguments:
1. float signal: This is an array of real numbers representing the signal to be correlated with the pattern. The elements are numbered from 0 to SignalLen-1.
2. int signallen: This is an integer representing the length of the input signal array.
3. float pattern: This is an array of real numbers representing the pattern to be correlated with the signal. The elements are numbered from 0 to PatternLen-1.
4. int patternlen: This is an integer representing the length of the pattern array.
The function performs the following steps:
1. Calculate the required size nl for the FFT by finding the smallest power of 2 that is greater than or equal to the sum of the lengths of the signal and the pattern.
2. Create two new arrays a1 and a2 with the length nl and initialize them to 0.
3. Copy the signal array into a1 and pad it with zeros up to the length nl.
4. Copy the pattern array into a2 and pad it with zeros up to the length nl.
5. Compute the FFT of both a1 and a2.
6. Perform element-wise multiplication of the frequency-domain representation of a1 and the complex conjugate of the frequency-domain representation of a2.
7. Compute the inverse FFT of the result obtained in step 6.
8. Store the resulting correlation values in the original signal array.
At the end of the function, the signal array contains the correlation values at points from 0 to SignalLen-1.
Fast Fourier Transform of Two Real Functions
This code defines a function called tworealffts that computes the Fast Fourier Transform (FFT) of two real-valued functions (a1 and a2) using a Cooley-Tukey-based radix-2 Decimation in Time (DIT) algorithm. The FFT is a widely used algorithm for computing the discrete Fourier transform (DFT) and its inverse.
Input parameters:
1. float a1: an array of real numbers, representing the values of the first function.
2. float a2: an array of real numbers, representing the values of the second function.
3. float a: an output array to store the Fourier transform of the first function.
4. float b: an output array to store the Fourier transform of the second function.
5. int tn: an integer representing the number of function values. It must be a power of two, but the algorithm doesn't validate this condition.
The function performs the following steps:
1. Combine the two input arrays, a1 and a2, into a single array a by interleaving their elements.
2. Perform a 1D FFT on the combined array a using the radix-2 DIT algorithm.
3. Separate the FFT results of the two input functions from the combined array a and store them in output arrays a and b.
Here is a detailed breakdown of the radix-2 DIT algorithm used in this code:
1. Bit-reverse the order of the elements in the combined array a.
2. Initialize the loop variables mmax, istep, and theta.
3. Enter the main loop that iterates through different stages of the FFT.
a. Compute the sine and cosine values for the current stage using the theta variable.
b. Initialize the loop variables wr and wi for the current stage.
c. Enter the inner loop that iterates through the butterfly operations within each stage.
i. Perform the butterfly operation on the elements of array a.
ii. Update the loop variables wr and wi for the next butterfly operation.
d. Update the loop variables mmax, istep, and theta for the next stage.
4. Separate the FFT results of the two input functions from the combined array a and store them in output arrays a and b.
At the end of the function, the a and b arrays will contain the Fourier transform of the first and second functions, respectively. Note that the function overwrites the input arrays a and b.
█ Example scripts using functions contained in loxxfft
Real-Fast Fourier Transform of Price w/ Linear Regression
Real-Fast Fourier Transform of Price Oscillator
Normalized, Variety, Fast Fourier Transform Explorer
Variety RSI of Fast Discrete Cosine Transform
STD-Stepped Fast Cosine Transform Moving Average
RsiLibLibrary "RsiLib"
TODO: add library description here
bullishDivergence(rsi, check_backward_length, rsi_threshold, rsi_overload_threshold, power_threshhold)
Parameters:
rsi (float)
check_backward_length (int)
rsi_threshold (float)
rsi_overload_threshold (float)
power_threshhold (int)
toolsLibrary "tools"
A library of many helper methods, plus a comprehensive print method and a printer object.
This is a newer version of the helpers library. This script uses pinescripts v5 latest objects and methods.
peterzorve-libraryLibrary "library"
is_bullish_engulfing()
is_bearish_engulfing()
is_hammer(fib_level)
Parameters:
fib_level (float)
is_shooting_star(fib_level)
Parameters:
fib_level (float)
is_hammer_and_star(fib_level)
Parameters:
fib_level (float)
is_star_and_hammer(fib_level)
Parameters:
fib_level (float)
is_dogi(dogi_body_ratio)
Parameters:
dogi_body_ratio (float)
is_bear_bear_bullish_engulf()
is_atr_stoploss_takeprofit(atr_multiplier, atr_length, reward_ratio)
Parameters:
atr_multiplier (float)
atr_length (simple int)
reward_ratio (float)
is_fixed_stoploss_takeprofit(stoploss_pips, reward_ratio)
Parameters:
stoploss_pips (float)
reward_ratio (float)
is_step_trailing_stoploss(stoploss_pips)
Parameters:
stoploss_pips (float)
is_atr_trailing_stoploss(atr_multiplier, break_even_pip)
Parameters:
atr_multiplier (float)
break_even_pip (int)
is_pull_back_strategy(length)
Parameters:
length (simple int)
is_trade_statistics(condition, entrypoint, stoploss, takeprofit)
Parameters:
condition (bool)
entrypoint (float)
stoploss (float)
takeprofit (float)
is_table_of_statistics(win_trades, lost_trades, even_trades, pips_won, pips_lost)
Parameters:
win_trades (int)
lost_trades (int)
even_trades (int)
pips_won (float)
pips_lost (float)
is_pine_info(lotsize, stoploss, takeprofit)
Parameters:
lotsize (float)
stoploss (float)
takeprofit (float)
is_support_and_resistance_strategy(look_back, look_forward)
Parameters:
look_back (int)
look_forward (int)
is_choral_strategy(smoothing_period, constant_d)
Parameters:
smoothing_period (int)
constant_d (float)
is_bollinger_band_strategy(length, dev_entry, dev_stoploss, dev_takeprofit)
Parameters:
length (int)
dev_entry (simple float)
dev_stoploss (simple float)
dev_takeprofit (simple float)
Console📕 Console Library
🔷 Introduction
This script is an adaptation of the classic JavaScript console script. It provides a simple way to display data in a console-like table format for debugging purposes.
While there are many nice console/logger scripts out there, my personal goal was to achieve inline functionality and visual object (label, lines) logging .
🔷 How to Use
◼ 1. Import the Console library into your script:
import cryptolinx/Console/1
- or -
Instead of the library namespace, you can define a custom namespace as alias.
import cryptolinx/Console/1 as c
◼ 2. Create and init a new `` object.
The `init()` method is used to initialize the console object with default settings. It can be used to customize it.
// When using the `var` keyword in a declaration, the logs will act as ever-forwarding.
// Without `var`, the `console` variable will be redeclared every time `bar` is called.
// var console = Console.terminal.new(log_position=position.bottom_left, prefix = '> ', show_no = true)
- or -
If you has set up an alias before.
var console = c.terminal.new().init()
◼ 3. Logging
// inline ✨
array testArray = array.new(3, .0).log(console)
// basic
console.log(testArray)
// inline ✨
var testLabel = label.new(bar_index, close, 'Label Text').log(console)
// basic
console.log(testLabel)
// It is also possible to use `().` for literals ✨.
int a = 100
testCalc = (5 * 100).log(console) + a.log(console) // SUM: 600
console.
.empty()
.log('SUM' + WS + testCalc.tostring())
◼ 4. Visibility
Finally, we need to call the `show()` method to display the logged messages in the console.
console.show(true) // True by default. Simply turn it on or off
LibAndyLibrary "LibAndy"
TODO: add library description here
greencandlme(x)
TODO: add function description here
Parameters:
x (float) : TODO: add parameter x description here
Returns: TODO: add what function returns
greencandle()
Whether this candle is green or not
Returns: Whether this candle is green or not
redcandle()
Whether this candle is red or not
Returns: Whether this candle is red or not
boostrapSeries(bsSeries)
Parameters:
bsSeries (float)

PolynomialLibrary "Polynomial"
TODO: add library description here
PolyNomial(Dop, n, step, nonp)
TODO: add function description here
Parameters:
Dop (int)
n (int)
step (int)
nonp (int)
Returns: TODO: add what function returns
Branch CurveLibrary "branch"
Generates a branch made of segments with a starting angle
and a turning angle for each segment. The branch is generated from a starting point
and a number of nodes to generate. The length of each segment and angle of each segment
can be adjusted. The branch can be generated in 2D or 3D, render as you wish.
method branch(origin, nodes, segment_length, segment_growth, angle_start, angle_turn)
# Branch Generation.
- `origin`: CommonTypesMath.Vector3 - The starting point of the branch. If the z value is not zero, it will be used as the starting angle.
- `nodes`: int - The number of nodes to generate.
- `segment_length`: float - The length of each segment.
- `segment_growth`: float - The growth of each segment. 0 = no growth, 100 = double the length of the previous segment.
- `angle_start`: float - The starting angle of the branch in degrees.
- `angle_turn`: float - The turning angle of each segment in degrees.
Namespace types: CommonTypesMath.Vector3
Parameters:
origin (Vector3 type from RicardoSantos/CommonTypesMath/1) : The starting point of the branch. If the z value is not zero, it will be used as the starting angle.
nodes (int) : The number of nodes to generate.
segment_length (float) : The length of each segment.
segment_growth (float) : The growth of each segment. 0 = no growth, 100 = double the length of the previous segment.
angle_start (float) : The starting angle of the branch in degrees.
angle_turn (float) : The turning angle of each segment in degrees.
@return segments The list of segments that make up the branch.

VolumeLibLibrary "VolumeLib"
Contains types and methods related to VOLUME
volumePrice()
TODO: add function description here
Returns: TODO: add what function returns
averageVolumePrice(length)
Parameters:
length (simple int)
volumePower(volume_price, average_volume_price)
Parameters:
volume_price (float)
average_volume_price (float)
volumePower(length)
Parameters:
length (simple int)
OrderLibLibrary "OrderLib"
TODO: add library description here
removeOrderView(view)
Parameters:
view (orderView)
createOrderView(model, length, profit_color, loss_color, enter_color)
Parameters:
model (orderModel)
length (simple int)
profit_color (simple color)
loss_color (simple color)
enter_color (simple color)
createOrder(enter, tp, sl)
Parameters:
enter (float)
tp (float)
sl (float)
createOrderByRR(enter, sl, rr)
Parameters:
enter (float)
sl (float)
rr (float)
createOrderByRR(enter, sl, rr, commision_percent)
Parameters:
enter (float)
sl (float)
rr (simple float)
commision_percent (simple float)
orderModel
Fields:
enter (series__float)
sl (series__float)
tp (series__float)
orderView
Fields:
enter (series__line)
sl (series__line)
tp (series__line)