Auto Intelligence Selective Moving Average(AI/MA)# 🤖 Auto Intelligence Moving Average Strategy (AI/MA)
**AI/MA** is a state-adaptive moving average crossover strategy designed to **maximize returns from golden cross / death cross logic** by intelligently switching between different MA types and parameters based on market conditions.
---
## 🎯 Objective
To build a moving average crossover strategy that:
- **Adapts dynamically** to market regimes (trend vs range, rising vs falling)
- **Switches intelligently** between SMA, EMA, RMA, and HMA
- **Maximizes cumulative return** under realistic backtesting
---
## 🧪 materials amd methods
- **MA Types Considered**: SMA, EMA, RMA, HMA
- **Parameter Ranges**: Periods from 5 to 40
- **Market Conditions Classification**:
- Based on the slope of a central SMA(20) line
- And the relative position of price to the central line
- Resulting in 4 regimes: A (Bull), B (Pullback), C (Rebound), D (Bear)
- **Optimization Dataset**:
- **Bybit BTCUSDT.P**
- **1-hour candles**
- **2024 full-year**
- **Search Process**:
- **Random search**: 200 parameter combinations
- Evaluated by:
- `Cumulative PnL`
- `Sharpe Ratio`
- `Max Drawdown`
- `R² of linear regression on cumulative PnL`
- **Implementation**:
- Optimization performed in **Python (Pandas + Matplotlib + Optuna-like logic)**
- Final parameters ported to **Pine Script (v5)** for TradingView backtesting
---
## 📈 Performance Highlights (on optimization set)
| Timeframe | Return (%) | Notes |
|-----------|------------|----------------------------|
| 6H | +1731% | Strongest performance |
| 1D | +1691% | Excellent trend capture |
| 12H | +1438% | Balance of trend/range |
| 5min | +27.3% | Even survives scalping |
| 1min | +9.34% | Robust against noise |
- Leverage: 100x
- Position size: 100%
- Fees: 0.055%
- Margin calls: **none** 🎯
---
## 🛠 Technology Stack
- `Python` for data handling and optimization
- `Pine Script v5` for implementation and visualization
- Fully state-aware strategy, modular and extendable
---
## ✨ Final Words
This strategy is **not curve-fitted**, **not over-parameterized**, and has been validated across multiple timeframes. If you're a fan of dynamic, intelligent technical systems, feel free to use and expand it.
💡 The future of simple-yet-smart trading begins here.
Göstergeler ve stratejiler

ATR Trend Strategy + KAMA FilterATR Trend Strategy with XMA KAMA Filter
Strategy Description
This strategy combines a dynamic ATR trailing stop with an XMA KAMA filter to precisely detect trends and generate reliable entry signals.
It uses a two-step trend confirmation system:
1️⃣ ATR Trailing Stop
Based on the Average True Range (ATR), this trailing stop automatically adapts to market volatility.
It determines whether the market is in a bullish or bearish phase by comparing the current price to the ATR trailing stop level.
2️⃣ KAMA Filter (XMA Version)
KAMA (Kaufman Adaptive Moving Average) provides an additional trend filter.
This XMA version of KAMA avoids the traditional fast/slow parameters and instead dynamically calculates the ratio of signal to market "noise", helping to reduce false signals and over-sensitivity.
How It Works
Long Signal:
Price is above both the ATR trailing stop and the KAMA (XMA) line.
Short Signal:
Price is below both the ATR trailing stop and the KAMA (XMA) line.
What Makes This Strategy Different?
Unlike many classic strategies that rely on simple moving averages, this system uses an adaptive KAMA filter that responds better to changing market conditions and volatility.
The ATR trailing stop automatically adjusts to current market volatility, providing an extra layer of protection against false breakouts.
By combining these tools, this strategy offers:
Precise trend filtering
Avoidance of false breakouts and noise
Dynamic adjustment to market conditions
How to Use
Apply the strategy to any market chart (Forex, stocks, crypto, indices, etc.)
Adjust the ATR and KAMA parameters to match your trading plan
Use the TradingView Strategy Tester to evaluate performance before live trading
Who Is This For?
Swing traders and trend followers
Traders looking for clean, filtered signals with reduced noise
Medium-term traders seeking a system that adapts to market dynamics
Additional Info: Heikin Ashi Compatibility
This strategy is fully compatible with Heikin Ashi candles.
By applying it to a chart with Heikin Ashi candles, traders can further reduce market noise and enhance trend visualization.
The combination of ATR trailing stop + XMA KAMA filter + Heikin Ashi smoothing provides an even cleaner trend-following system, minimizing false signals and improving decision-making clarity.

Zen CSC Bar Strategy v1🧠 Zen Consecutive Bar Strategy — Research Tool (Trend + Reversal)
**Description:**
This strategy is designed as a flexible research tool for studying price behavior following consecutive bull or bear bars. It allows users to explore breakout and reversal scenarios with full control over trade entry and filtering logic.
**🔧 Key Features:**
* **Configurable bar sequence**: Detects customizable streaks of consecutive bull or bear bars.
* **Trend or Reversal mode**: Toggle between breakout-style entries or fade/reversal-style setups.
* **MA-based filter**: Optionally restrict trades to occur above or below the 20-period moving average.
* Longs can be limited to above/below MA
* Shorts can be limited to above/below MA
* **Customizable R-multiple targets**: Choose between 0.5R, 1R, 1.5R, or 2R reward targets.
* **Stop loss logic**: Uses syminfo.mintick to offset stops by 1 tick beyond the pattern high/low.
* **Entry logic**: Buy/Sell either on the close of the setup bar or on breakout beyond high/low.
* **Trade direction**: Enable long-only, short-only, or both.
**📊 Research Use Only:**
This is not a ready-to-trade system. It’s intended to help traders test ideas and collect performance stats under different configurations. Use it to:
* Evaluate the failure rate of open spikes
* Study behavior following strong directional bars
* Compare trend-following vs mean-reversion edge across sessions
**❗Disclaimer:**
This script is for educational purposes only. It does not constitute financial advice. Past performance does not guarantee future results.

Eliora Gold 1min (Heikin Ashi)Eliora -focused trading strategy designed for anything on the 1-minute timeframe using Heikin Ashi candles. This mode combines advanced market logic with structured risk management to deliver smooth, disciplined trade execution.
Key Features:
✅ Trend Confirmation – Aligns with dominant market direction for higher accuracy.
✅ ATR-Based Volatility Filter – Avoids high-risk conditions and chaotic price action.
✅ Candle Strength Logic – Filters weak setups, focusing on strong momentum.
✅ Balanced Risk/Reward – Calculates stop-loss and take-profit dynamically for consistent results.
✅ Cooldown & Overtrade Protection – Limits frequency to maintain trade quality.
This version of Eliora is built for scalpers and intraday traders seeking high-probability entries with graceful exits.

EMA and Dow Theory Strategies🌐 Strategy Description
📘 Overview
This is a hybrid strategy that combines EMA crossovers, Dow Theory swing logic, and multi-timeframe trend overlays. It is suitable for intraday to short-term trading on any asset class: crypto, forex, stocks, and indices.
The strategy provides precise entry/exit signals, dynamic stop-loss and scale-out, and highly visual trade guidance.
🧠 Key Features
・Dual EMA crossover system (applied to both symbol and external index)
・Dow Theory-based swing high/low detection for trend confirmation
・Visual overlay of higher timeframe swing trend (htfTrend)
・RSI filter to avoid overbought/oversold entries
・Dynamic partial take-profit when trend weakens
・Custom stop-loss (%) control
・Visualized trade PnL labels directly on chart
・Alerts for entry, stop-loss, partial exit
・Gradient background zones for swing zones and trend visualization
・Auto-tracked metrics: APR, drawdown, win rate, equity curve
⚙️ Input Parameters
| Parameter | Description |
| ------------------------- | -------------------------------------------------------- |
| Fast EMA / Slow EMA | Periods for detecting local trend via EMAs |
| Index Fast EMA / Slow EMA | EMAs applied to external reference index |
| StopLoss | Maximum loss threshold in % |
| ScaleOut Threshold | Scale-out percentage when trend changes color |
| RSI Period / Levels | RSI period and overbought/oversold levels |
| Swing Detection Length | Number of bars used to detect swing highs/lows |
| Stats Display Options | Toggle PnL labels and position of statistics table |
🧭 About htfTrend (Higher Timeframe Trend)
The script includes a higher timeframe trend (htfTrend) calculated using Dow Theory (pivot highs/lows).
This trend is only used for visual guidance, not for actual entry conditions.
Why? Strictly filtering trades by higher timeframe often leads to missed opportunities and low frequency.
By keeping htfTrend visual-only, traders can still refer to macro structure but retain trade flexibility.
Use it as a contextual tool, not a constraint.
ストラテジー説明
📘 概要
本ストラテジーは、EMAクロスオーバー、ダウ理論によるスイング判定、**上位足トレンドの視覚表示(htfTrend)**を組み合わせた複合型の短期トレーディング戦略です。
仮想通貨・FX・株式・指数など幅広いアセットに対応し、デイトレード〜スキャルピング用途に適しています。
動的な利確/損切り、視覚的にわかりやすいエントリー/イグジット、統計表示を搭載しています。
🧠 主な機能
・対象銘柄+外部インデックスのEMAクロスによるトレンド判定
・ダウ理論に基づいたスイング高値・安値検出とトレンド判断
・上位足スイングトレンド(htfTrend)の視覚表示
・RSIフィルターによる過熱・売られすぎの回避
・トレンドの弱まりに応じた部分利確(スケールアウト)
・**損切り閾値(%)**をカスタマイズ可能
・チャート上に損益ラベル表示
・アラート完備(エントリー・決済・部分利確)
・トレンドゾーンを可視化する背景グラデーション
・勝率・ドローダウン・APR・資産増加率などの自動表示
| 設定項目名 | 説明内容 |
| --------------------- | -------------------------- |
| Fast EMA / Slow EMA | 銘柄に対して使用するEMAの期間設定 |
| Index Fast / Slow EMA | 外部インデックスのEMA設定 |
| 損切り(StopLoss) | 損切りラインのしきい値(%で指定) |
| 部分利確しきい値 | トレンド弱化時にスケールアウトする割合(%) |
| RSI期間・水準 | RSI計算期間と、過熱・売られすぎレベル設定 |
| スイング検出期間 | スイング高値・安値の検出に使用するバー数 |
| 統計表示の切り替え | 損益ラベルや統計テーブルの表示/非表示選択 |
🧭 上位足トレンド(htfTrend)について
本スクリプトには、上位足でのスイング高値・安値の更新に基づく**htfTrend(トレンド判定)が含まれています。
これは視覚的な参考情報であり、エントリーやイグジットには直接使用されていません。**
その理由は、上位足を厳密にロジックに組み込むと、トレード機会の損失が増えるためです。
このスクリプトでは、**判断の補助材料として「表示のみに留める」**設計を採用しています。
→ 裁量で「利確を早める」「逆張りを避ける」判断に活用可能です。

XRP Trend & Signal Strategy V2This is a simple yet effective script that plots the closing price of the selected asset directly on the chart. Useful for visualizing raw price action without additional indicators, this script serves as a clean base for further customization and strategy development.

Dema Entry FRAMA Exit VTECDual-Timeframe Trend Strategy
This strategy combines a 20-hour DEMA Supertrend with a 1-day FRAMA to capture strong market trends with fast entries and high-confidence exits.
Key Components
DEMA Supertrend (20H): Triggers quick entries to catch early trend momentum.
FRAMA (1D): Confirms major trends, ensuring profitable exits.
ATR Filter (1D): Sets precise entry/exit bands using Average True Range.
Gaussian Filter (1D): Smooths price data for reliable FRAMA signals.
Trading Rules
Entry: Enter long if DEMA Supertrend (20H) or FRAMA (1D) signals bullish.
Exit: Exit long if DEMA Supertrend (20H) or FRAMA (1D) signals bearish.
Flow: DEMA typically enters first, FRAMA confirms, and either closes the trade.
Best Markets
Ideal for trending markets
Use on a 1-day chart with 20-hour DEMA data.
Best for 24/7 markets; check compatibility for stocks.
This strategy balances speed and precision for high-profit trades with disciplined risk control.

LANZ Strategy 5.0 [Backtest]🔷 LANZ Strategy 5.0 — Rule-Based BUY Logic with Time Filter, Session Limits and Auto SL/TP Execution
This is the backtest version of LANZ Strategy 5.0, built as a strategy script to evaluate real performance under fixed intraday conditions. It automatically places BUY and SELL trades based on structured candle confirmation, EMA trend alignment, and session-based filters. The system simulates real-time execution with precise Stop Loss and Take Profit levels.
📌 Built for traders seeking to simulate clean intraday logic with fully automated entries and performance metrics.
🧠 Core Logic & Strategy Conditions
✅ BUY Signal Conditions:
Price is above the EMA200
The last 3 candles are bullish (close > open)
The signal occurs within the defined session window (NY time)
Daily trade limit has not been exceeded
If all are true, a BUY order is executed at market, with SL and TP set immediately.
🔻 SELL Signal Conditions (Optional):
Exactly inverse to BUY (below EMA + 3 bearish candles). Disabled by default.
🕐 Operational Time Filter (New York Time)
You can fully customize your intraday window:
Start Time: e.g., 01:15 NY
End Time: e.g., 16:00 NY
The system evaluates signals only within this range, even across midnight if configured.
🔁 Trade Management System
One trade at a time per signal
Trades include a Stop Loss (SL) and Take Profit (TP) based on pip distance
Trade result is calculated automatically
Each signal is shown with a triangle marker (BUY only, by default)
🧪 Backtest Accuracy
This version uses:
strategy.order() for entries
strategy.exit() for SL and TP
strategy.close_all() at the configured manual closing time
This ensures realistic behavior in the TradingView strategy tester.
⚙️ Flow Summary (Step-by-Step)
On every bar, check:
Is the time within the operational session?
Is the price above the EMA?
Are the last 3 candles bullish?
If conditions met → A BUY trade is opened:
SL = entry – X pips
TP = entry + Y pips
Trade closes:
If SL or TP is hit
Or at the configured manual close time (e.g., 16:00 NY)
📊 Settings Overview
Timeframe: 1-hour (ideal)
SL/TP: Configurable in pips
Max trades/day: User-defined (default = 99 = unlimited)
Manual close: Adjustable by time
Entry type: Market (not limit)
Visuals: Plotshape triangle for BUY entry
👨💻 Credits:
💡 Developed by: LANZ
🧠 Strategy logic & execution: LANZ
✅ Designed for: Clean backtesting, clarity in execution, and intraday logic simulation

IU Martingale StrategyDESCRIPTION
This strategy is a Martingale-based trading system that enters a long position based on simple candle patterns and doubles the position size after each loss. It tracks the worst-case drawdown using a live risk matrix table to help traders visualize the downside. With clear profit and loss points, auto position sizing, and a risk visualization table, it’s perfect for backtesting the Martingale concept directly on charts.
WHAT IS MARTINGALE SYSTEM?
The Martingale system is a position-sizing strategy where you double your trade size after every loss, aiming to recover all previous losses with a single profitable trade. It assumes that a winning trade will eventually occur. While it can be high-risk, it’s often used in controlled environments or with high probability setups.
USER INPUTS
📦 Starting Position: Initial position size for the first trade
📈 Profit Points: Target profit in price points
📉 Loss Points: Stop loss in price points
📊 Show Risk Matrix Table: Enable or disable a live table showing current streak and risk stats
LONG CONDITION
A long trade is triggered when the current candle closes higher than it opened, and no open position exists. The condition is simple and used to simulate market entry for testing the Martingale logic.
// Entry Condition:
close > open and no existing position
LONG EXIT
Each trade has a fixed stop-loss and take-profit, based on the user's input:
Stop Loss = Entry Price − Loss Points
Take Profit = Entry Price + Profit Points
The exit is handled using strategy.exit() with these dynamic values.
WHY IT IS UNIQUE
🔁 Implements a dynamic Martingale position sizing system
📊 Includes a visual Risk Matrix Table tracking losing streaks, max size, and risk
📈 Automatically resets position size after a win
🧠 Smart use of array to manage loss history and control logic
🎯 Customizable SL and TP for each entry
🎨 Beautiful chart visuals for entry, stop loss, and target levels
HOW USER CAN BENEFIT FROM IT
🧪 Test the sustainability of a Martingale system with real chart data
👁️ Visualize the risks and impact of consecutive losses
📈 Explore risk vs. reward scenarios before deploying in real markets
🧰 Use it as a base template to build more advanced Martingale or grid-based systems
📚 Great for educational purposes to understand the mathematical drawdowns involved in doubling strategies
Disclaimer :
This Video is not financial advice, it's for educational purposes only highlighting the power of coding( pine script) in TradingView, I am not a SEBI-registered advisor. Trading and investing involve risk, and you should consult with a qualified financial advisor before making any trading decisions. I do not guarantee profits or take responsibility for any losses you may incur.

Strategy with DI+/DI-, ADX, RSI, MACD, EMA + Time Stop [EXP. 1]Strategy Overview
This is an experimental trend-following strategy combining directional movement indicators, momentum filters, and time-based exits. Built for low timeframes like BTCUSDT 5m, it aims to detect clean directional setups while managing risk tightly.
Indicator Components
• DI+/DI- + ADX – Confirms trend direction and strength
• RSI (14) – Momentum filter (entries only if RSI > 55 or < 45)
• MACD Histogram – Confirms momentum shift in signal direction
• Candle Body % Filter – Screens for strong price commitment bars
• EMA 600 & EMA 2400 – Defines long-term trend alignment
• Time-Based Stop – Closes trade if it doesn’t move 0.75% in 85 bars
• Reward:Risk – 1% stop-loss, 7.5:1 reward-to-risk
• One Trade per EMA Cross – Only trades first valid signal per trend shift
Entry Logic
Long Entry:
• DI+ crosses above DI−
• RSI > 55
• MACD histogram > 0
• Strong bullish candle
• EMA600 > EMA2400
• Occurs within 25 bars of an EMA crossover
Short Entry:
• DI+ crosses below DI−
• RSI < 45
• MACD histogram < 0
• Strong bearish candle
• EMA2400 > EMA600
• Occurs within 25 bars of an EMA crossover
Exit Logic
• Stop-loss: 1% from entry
• Take-profit: 7.5x risk
• Time-stop: Trade closed if price doesn’t move 0.75% in 85 bars
Testing Parameters
• Initial Capital: $10,000
• Commission: 0.04% per trade
• Timeframe: 5-minute
• Tested on: BTCUSDT
• ⚠️ Early-stage strategy — trade count may be low depending on market context. This is shared for educational use and community feedback.
Notes
• This script is experimental and educational
• Please forward-test in a demo environment before using it live
• Open-source for learning and improvement — contributions welcome!

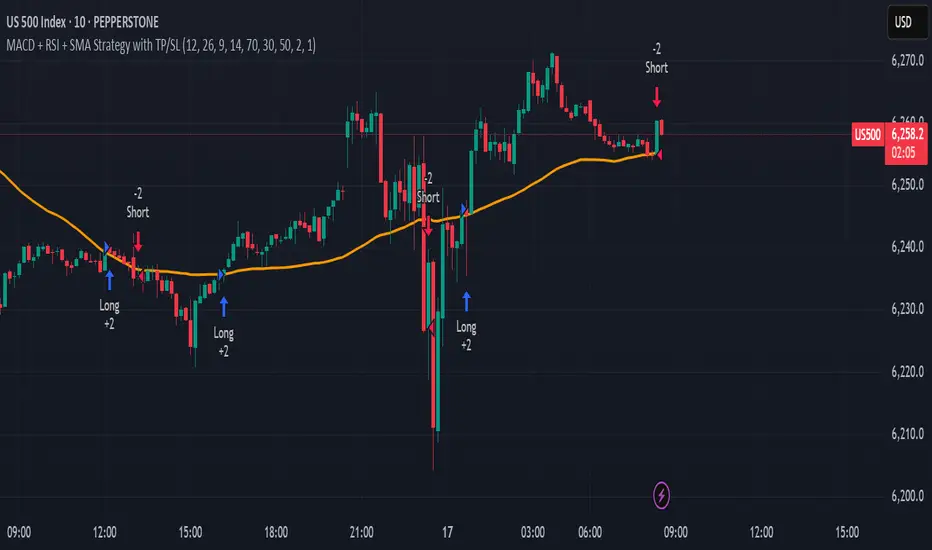
MACD + RSI + SMA Strategy with TP/SLThis strategy combines three technical indicators: MACD, RSI, and Simple Moving Average (SMA) to identify high-probability entry points. It enters trades in the direction of the trend (filtered by SMA), confirms momentum shifts (via MACD crossover), and validates signals with RSI to avoid overbought/oversold conditions.
Key Features:
Directional filter using SMA to align trades with the broader trend.
Momentum validation with MACD crossovers.
Risk control through RSI thresholds and fixed percentage-based Take Profit and Stop Loss levels.
Works for both long and short positions.
Disclaimer: This is a sample strategy for educational purposes only.
Trading involves risk. Use at your own discretion.
You bear full responsibility for any profit or loss.
T3MA Ribbon Strategy (v6 - Fixed HA) by LKALGOT3MA Ribbon Strategy (v6) by LKALGO
The T3MA Ribbon Strategy helps you catch trends with confidence!
It combines a fast and slow T3 moving average to create a color-filled ribbon that clearly shows bullish (green) and bearish (red) momentum.
✅ Key features:
Smooth trend signals using powerful T3 MAs
Optional Heikin Ashi smoothing for even cleaner trends
Simple, clear BUY and SELL signals on the chart
Alerts included for easy automation
How it works:
Enter long when the ribbon turns green (fast T3 crosses above slow T3)
Exit when it turns red (fast T3 crosses below slow T3)
Works on all timeframes and markets. Perfect for traders who want a simple but effective trend-following system.

Aggressive RSI + EMA Strategy with TP/SLWhat This Strategy Does 🔥
📉 It monitors RSI to find when the market is potentially oversold (RSI < 40) or overbought (RSI > 60).
📈 It checks the trend direction using two EMAs — fast EMA (short-term) and slow EMA (long-term).
✅ It only buys when the market looks oversold and the short-term trend is up (fast EMA > slow EMA).
❌ It only sells when the market looks overbought and the short-term trend is down (fast EMA < slow EMA).
💰 Once in a trade, it sets a take profit at 1% gain and a stop loss at 0.5% loss — so profits are locked and risks controlled.
🔄 This cycle repeats continuously, aiming to catch many small, quick moves rather than waiting for big swings.
🚀 The aggressive RSI thresholds mean it triggers trades more often — ideal for active traders who want lots of setups.
📊 It shows clear visual indicators and plots on the chart so you can easily see entries, exits, and indicator levels.
🔔 It also supports alerts, so you can get notified instantly when a trade setup happens.
In short, it’s a fast, trend-aware momentum strategy with built-in risk control designed for active trading and consistent small wins.

Buy Dip Multiple Positions🎯 Objective
This strategy aims to capture aggressive dip-buying opportunities during volume-confirmed price reversals in short term downtrending markets. It is optimized for multi-entry precision, adaptive stop management, and real-time trade monitoring.
It allows traders to execute multiple long entries and dynamically trail stops to maximize gains while capping risk. Designed with modular inputs, this strategy is ideal for intraday momentum scalping and swing trading alike.
🔧 How It Operates
The strategy triggers buy entries when three conditions align:
Reversal Candle: Current close < prior low × 0.998
Volume Confirmation: Current volume exceeds average of prior 2 bars × 1.2
Price Surge Threshold: Current close below user-defined % of close from N bars ago
Once a reversal candle is confirmed, the strategy:
Calculates position size based on user-defined risk parameters
Allows up to a max number of simultaneous trades
Trailing Stop kicks in 2 bars after entry, climbing by a user-defined % each bar
Exit occurs when price hits either the trailing stop or target price
🛠️ Inputs
Users can customize all major aspects of the strategy:
Max Simultaneous Trades: Default 20
Trailing Stop Increase per Bar (%): Default 1%
Initial Stop (% of Reversal Low): Default 85%
Target Price (% Above Reversal Low): Default 60%
Price Surge Threshold (% of Past Close): Default 89%
Surge Lookback Bars: Default 14
Show Active Trade Dot: Toggle to display green trade status dot
📊 Visual Overlays
The chart displays the following:
Marker Description
🟢 Green Dot Active trade (toggleable)
🔴 Red Dot Max trades reached
📈 Trailing Stop Applied internally but not plotted (can be added)
📊 Metrics Plots of win rate, winning/losing trade counts
📎 Notes
Strategy uses strategy.cash allocation logic
Entry size adapts to account equity and risk per trade
All parameters are accessible via the settings panel
Built entirely in Pine Script v5
This strategy balances flexibility and precision, giving traders control over entry timing, capital allocation, and stop behavior. Ideal for those looking to automate dip-buy setups with tactical overlays and visual alerts.

80% Rule BacktestStrategy Overview: 80% Rule Backtest Tool
This strategy tester is designed to validate the classic 80% Rule setup within a defined ETH futures session. Signals are triggered when price reenters the prior day's value area and holds for a qualified duration — targeting the Point of Control (POC) for primary exits, while tracking full value area traversals for research purposes.
- 📅 Session Logic: Anchored to a true 22-hour ETH futures window (5PM–3PM Pacific), with global time zone support
- 🧠 Signal Confirmation: Price must reenter and hold inside value area for ≥ 45 minutes to validate entry
Note: Optimized for 15-minute charts — aligns exactly with traditional rule definition (3-bar hold)
- 🎯 Targets: Primary TP at POC; visual logs for full VAH/VAL reach
- 🔍 Manual Override Mode: Precise SVP-level control when auto logic isn’t preferred
- 🔧 Debug Mode: Single-bar diagnostic labels for development and forward testing
This tool supports both auto-calculated and manually anchored value areas, allowing traders to blend systematic backtesting with discretionary insight.
working on this tool to be used as a strategy tester

StockMarketWolf 9/20 EMA VWAP MACD StrategyThis strategy is all about catching momentum in the market by combining some of the most trusted technical indicators—moving averages, VWAP, and MACD—to help you spot better trade opportunities with more confidence.
Here’s the simple idea:
Use the 9 and 20 EMA crossover to spot when the short-term trend is turning up or down.
Check that the price is trading above or below the VWAP (the average price weighted by volume for the day) to confirm the overall market sentiment.
Use the MACD to make sure momentum is supporting your trade—no point jumping in if momentum isn’t backing it up.
How it works:
Go long when the 9 EMA crosses above the 20 EMA, price is above VWAP, and MACD is signaling positive momentum.
Go short when the 9 EMA crosses below the 20 EMA, price is below VWAP, and MACD shows bearish momentum.
Exit the trade when these signals flip or momentum fades.
Why it’s useful:
It helps you avoid trading against the trend by using the VWAP filter.
The MACD momentum check cuts down on fake breakouts.
It’s straightforward and works well on popular day trading charts like the 5-minute timeframe.
Great for high-volume stocks and futures like SPY, QQQ, or ES futures.
Things to keep in mind:
It doesn’t throw out signals all day — you get quality over quantity.
Like any strategy, it’s not perfect and can struggle during sideways markets.
Sticking to the rules and having patience is key.
All in all, this is a solid, no-nonsense strategy that mixes trend and momentum in a way that makes trading feel a bit more clear and less noisy. Perfect if you want a systematic approach without overcomplicating things.

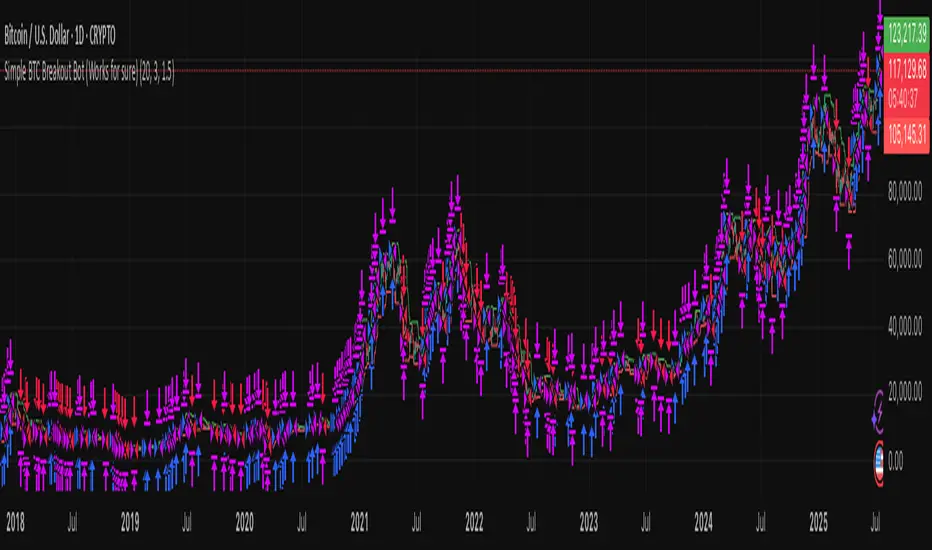
Simple BTC Breakout Bot (Works for sure)🚀 Simple BTC Breakout Bot (Works for sure)
This strategy is designed for BTC/USDT breakout trading using recent highs and lows. It automatically detects breakout signals and manages trades with Take Profit and Stop Loss to help manage risk and lock in profits.
Key Features:
🔍 Breakout Detection:
Enters a long position when price crosses above the highest high of the last N candles (default 20).
Enters a short position when price crosses below the lowest low of the last N candles.
💰 Risk Management:
Automatically sets a Take Profit (default 3%) and Stop Loss (default 1.5%) for every trade.
📊 Visuals:
Plots breakout levels (highest high in green, lowest low in red) on the chart.
🔔 Alerts:
Sends alerts on every breakout trade for long and short entries, compatible with TradingView’s alert system.
Parameters:
⏳ Breakout Lookback Period: Number of candles to check for breakouts (default: 20)
🎯 Take Profit (%): Profit target as a percentage from entry price (default: 3%)
🚫 Stop Loss (%): Maximum loss allowed as a percentage from entry price (default: 1.5%)
⚠️ Disclaimer:
This strategy is based on historical data and does not guarantee future profits. Always backtest and trade with proper risk management.
MA Crossover Strategy with TP/SL📊 MA Crossover Strategy with TP/SL
This strategy uses two simple moving averages (SMAs) to catch trend changes and trade breakouts with clear risk management.
🔥 How it works:
Enters a Long position when the fast SMA (short period) crosses above the slow SMA (long period), signaling an upward trend.
Enters a Short position when the fast SMA crosses below the slow SMA, signaling a downward trend.
🎯 Features:
Take Profit (TP): Automatically closes the trade at a defined percentage profit.
Stop Loss (SL): Limits potential losses with a predefined stop level.
Customizable parameters: Adjust the lengths of the moving averages, TP%, and SL% to fit your style.
Alerts: Receive notifications on every trade entry for timely action.
⚡️ Designed for traders looking for a simple, effective trend-following system with built-in risk control.

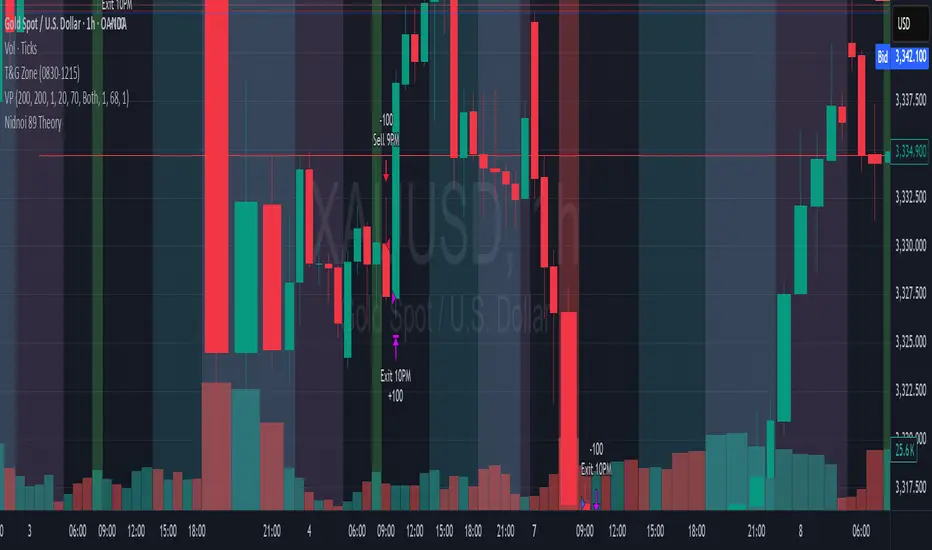
Nidnoi 89 TheoryNidnoi Morning Trading style
// This strategy is based on a reversal logic applied to the 8AM candle (Bangkok Time, UTC+7).
// The logic is:
// - If the 8AM candle is bullish (green), it indicates potential exhaustion — enter a SELL at the 9AM open.
// - If the 8AM candle is bearish (red), it suggests a possible bounce — enter a BUY at the 9AM open.
// All trades are closed at the 10AM open, limiting exposure to 1 hour.
//
// This strategy is designed for XAUUSD on a 1-hour chart and aligns with short-term intraday reversal patterns.
// The actual time used in code (UTC+7) is 9PM for the 8AM candle, and 10PM for the exit at 10AM.
//
// Highlights are shown on the 8AM candle for visual confirmation.
// Make sure your chart is set to 1H timeframe and uses XAUUSD.
BTC 15m Range Breakout Strategy
This is a **BTC 15-minute Range Breakout Strategy** designed for Most Simple Bitcoin Trading Strategy | Bitcoin Trading Strategy | Theta Gainers
Here's a brief overview:
## Strategy Overview
**Core Concept**: The strategy identifies a narrow 15-minute range during low volatility and trades breakouts from that range.
**Key Components**:
- **Range Definition**: Creates a price range based on the high/low between 19:15-19:30 IST (Indian Standard Time)
- **Trading Session**: Operates from 19:00 to 05:30 IST (covers both Asian and early European sessions)
- **Entry Signals**:
- **Long**: When price breaks above the range high
- **Short**: When price breaks below the range low
- **Risk Management**: Uses the opposite range boundary as stop loss with a customizable risk-reward ratio (default 2:1)
**Logic**: This targets the common pattern where Bitcoin consolidates during low-volume periods, then breaks out with momentum as major trading sessions begin. The 19:15-19:30 IST window likely captures a quiet period before increased activity.
**Features**:
- Visual range box display
- Automatic alerts for entries/exits
- Session-based position management
- Only one position per session
- Positions close automatically at session end
The strategy is designed for systematic breakout trading with clear risk parameters and automated execution.
########################################################################################
Ready to Elevate Your Trading? Explore many strategies
for traders who seek to refine their edge further to amplify consistency precision and more importantly greately minimising losses. 🚀
Visit lyrobtics.in
Contact: lyrobtics@gmail.com
#######################################################################################################

거래량 지표 전략 (최종)"Leverage 100x, 10% of capital committed, 0.3% profit target, 0.2% stop loss."
레버리지 100배 이용, 10프로 자본금 투입, 0.3프로 수익 , 0.2프로 손해
"Volume Indicator Strategy (Final)" Summary
This Pine Script strategy is designed to integrate volume data from multiple cryptocurrency exchanges (Binance, Bitget, OKX, Bybit) across spot and futures markets. It then uses this consolidated volume data to identify volume spikes and apply an RSI filter to generate buy/sell signals.
Key Features and Logic:
Multi-Exchange/Asset Volume Consolidation:
Based on user settings, it fetches and sums up spot and perpetual futures volume data from Binance, Bitget, OKX, and Bybit.
It uses the request.security function to query volume data from each specified exchange.
NA (Not Available) data points are safely handled and treated as 0 to prevent calculation errors.
Volume Spike Detection:
It calculates the Simple Moving Average (avg_volume) of the combined_volume over a lookback period (default 70 bars).
A vol_7x condition is met when the combined_volume is equal to or greater than 7 times (vol_multiplier_7x, user-configurable) the avg_volume.
RSI Filter (Optional):
An RSI (Relative Strength Index) filter (enable_rsi_filter, user-configurable) can be applied in conjunction with the volume spike condition.
Short Entry Condition: vol_7x (volume spike) & price_up (current bar's close is higher than the previous close) & RSI is 73 or greater (if filter is enabled).
Long Entry Condition: vol_7x (volume spike) & price_down (current bar's close is lower than the previous close) & RSI is 28 or less (if filter is enabled).
Strategy Entry/Exit:
When entry conditions are met, the strategy enters a position at market price.
It includes a re-entry cooldown period (default 10 bars) to prevent immediate re-entry in the same direction.
Fixed Take Profit and Stop Loss percentages (0.3% Take Profit, 0.2% Stop Loss) are set to manage open positions.
Visualization:
The combined_volume is plotted as columns (plot.style_columns) in a lower pane, changing color when the 7x volume spike condition is met.
The avg_volume is plotted as a line.
Volume values on the plot (and intended for the Y-axis scale) are formatted using format=format.volume to display in K (thousands), M (millions), B (billions) units.
The chart background color changes to indicate RSI overbought (>= 70, red) and oversold (<= 30, blue) zones.
Labels are displayed on the chart for individual trade P/L (Profit/Loss), and an info panel shows the total P/L over a user-defined period.
This strategy aims to capture significant market movements by aggregating volume data across various sources and combining it with price action and momentum (RSI) analysis to generate automated trading signals.
-------------------------------------------------------------------------------------------------------------
"거래량 지표 전략 (최종)" 요약
이 전략은 여러 암호화폐 거래소(바이낸스, 비트겟, OKX, 바이비트)의 현물(Spot) 및 선물(Futures) 거래량 데이터를 통합하여 사용하는 것을 핵심으로 합니다. 통합된 거래량 데이터를 바탕으로 거래량 급등을 포착하고 RSI 필터를 적용하여 매수/매도 신호를 생성하는 전략입니다.
주요 기능 및 로직:
다중 거래소/자산 거래량 통합:
사용자 설정에 따라 바이낸스, 비트겟, OKX, 바이비트의 현물 및 선물(무기한) 거래량을 개별적으로 가져와 합산합니다.
request.security 함수를 사용하여 각 거래소의 거래량 데이터를 요청합니다.
데이터가 없는 경우(NA)는 0으로 처리하여 계산 오류를 방지합니다.
거래량 급등 감지:
통합된 거래량(combined_volume)의 lookback 기간(기본 70봉) 이동평균(avg_volume)을 계산합니다.
combined_volume이 avg_volume의 7배(vol_multiplier_7x, 사용자 설정 가능) 이상으로 급등하면 vol_7x 조건을 만족합니다.
RSI 필터 (옵션):
거래량 급등 조건과 함께 RSI(상대 강도 지수) 필터(enable_rsi_filter, 사용자 설정 가능)를 적용할 수 있습니다.
매도(Short) 진입 조건: vol_7x (거래량 급등) & price_up (현재 봉 종가가 이전 봉보다 상승) & RSI가 73 이상일 때.
매수(Long) 진입 조건: vol_7x (거래량 급등) & price_down (현재 봉 종가가 이전 봉보다 하락) & RSI가 28 이하일 때.
전략 진입/청산:
위 진입 조건이 충족되면 시장가로 포지션에 진입합니다.
동일 방향으로 10봉 이내 재진입을 제한합니다.
고정 익절(Take Profit) 및 손절(Stop Loss) 비율(각각 0.3%, 0.2%)을 설정하여 포지션을 관리합니다.
시각화:
통합 거래량(combined_volume)은 차트 하단에 막대그래프(plot.style_columns)로 표시되며, 7배 급등 시 색상이 변경됩니다.
평균 거래량(avg_volume)은 선으로 표시됩니다.
거래량 값은 format=format.volume을 사용하여 K(천), M(백만), B(십억) 단위로 간소화되어 표시됩니다.
차트 배경색으로 RSI 과매수(70 이상, 빨간색) 및 과매도(30 이하, 파란색) 구간을 시각적으로 표시합니다.
개별 거래의 P/L(손익) 라벨과 지정된 기간 동안의 총 P/L을 차트 상단에 표시합니다.
이 전략은 여러 거래소의 거래량 데이터를 취합하여 시장의 전반적인 거래 활동을 파악하고, 이를 바탕으로 특정 패턴(거래량 급등 + 가격 방향 + RSI 필터)에 따라 매매 결정을 내리도록 설계되었습니다.

ZYTX RSI SuperTrendZYTX RSI SuperTrend
ZYTX RSI + SuperTrend Strategy
The definitive integration of RSI and SuperTrend trend-following indicators, delivering exemplary performance in automated trading bots.
