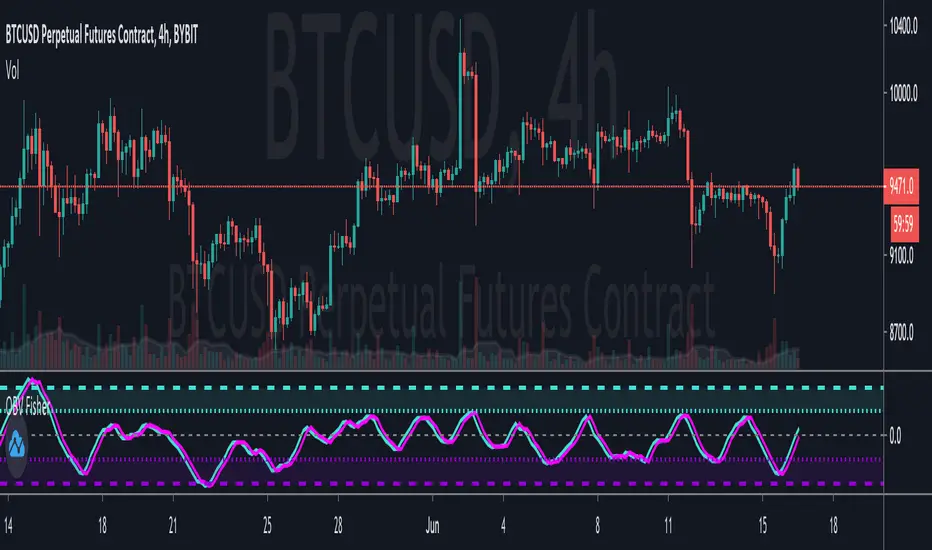
Fisher Transform on OBVApplies Ehlers Fisher Transform on to OBV, with EMA as trigger line.
Useful for identifying overbought and oversold conditions.
Overbought
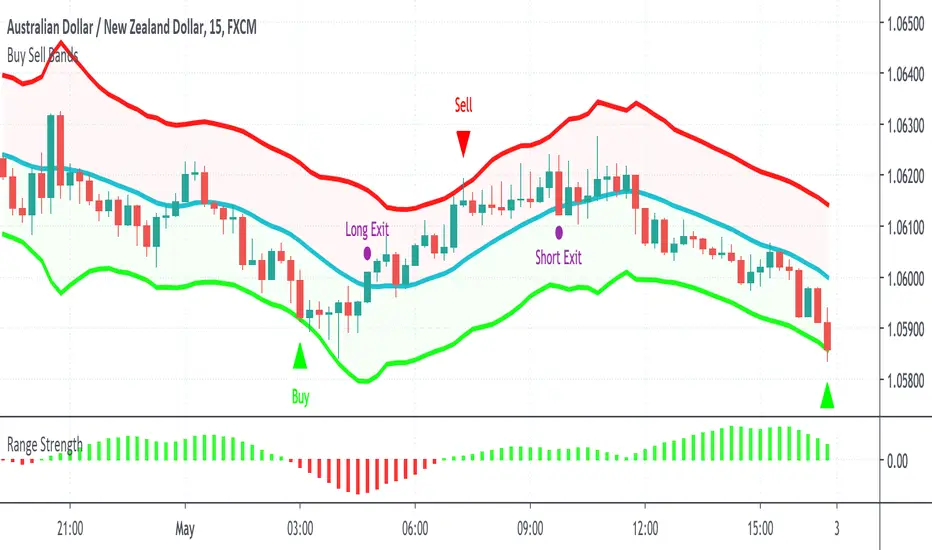
Buy Sell BandsBuy Sell Bands is a super simple indicator based on the mean reversion (range trading) strategy that shows you exactly where to buy, sell and close trades on every chart, market and timeframe.
It's best used together with our Range Strength indicator to identify when the market is in a range mode, this is the best time to take the entry signals from the Buy Sell Bands.
How Is It Different From Other Indicators?
- Designed specifically for the mean reversion (range trading) strategy
- Upper and lower bands are based on current and past volatility
- Aren't as sensitive to "squeezes" after periods of contracted volatility
- Works well in conjunction with the Range Strength Indicator to confirm entry signals
- Helps identify good "pair trading" opportunities
- Can be applied to all markets and timeframes
How To Use The Indicator?
1) Visit our website URL shown below this description and signup
2) We will then grant your TradingView username permission to use our indicators
3) Go to your Indicators window, then the Invite-Only section and add our indicators to your chart
4) Our indicators will then show on every chart you now look at
5) You can set up alerts to be notified in real time of trading signals from our indicators
6) Read our user manual for all the best tips on how to use our indicators as part of a range trading strategy
7) Feel free to reach out to us for personal one-on-one help with getting setup
What Markets and Conditions Does It Work Best On?
All markets cycle between trending and ranging modes, and the key to successfully using these indicators is identifying when the market is in or about to go into a range trading mode, and as such it can be applied to all markets and timeframes.
Some markets and timeframes trade within ranges more predictably than others, for example Forex, Cryptocurrencies, and Futures on the 15 minute timeframe during the US night session can work well due to the lack of price sensitive news creating lasting trends. With Stocks & ETFs on the 5 minute timeframe during the midday session on large cap blue chip stocks with no recent news releases can show strong range trading environments to use our indicators in.
In addition to single markets, you can also use our indicators on pair charts, for example Coca Cola(KO) versus Pepsi(PEP), you can do this by entering KO/PEP inside your TradingView chart quote box and it will bring up a pair chart. Our indicators will show buy and sell signals right on the pair chart just like any other single instrument chart. You can get very creative with what type of pairs you can come up with.
Our indicators are primarily designed for day trading and swing trading, however they can also be used for position trading and investing by identifying technically oversold and overbought range levels that are based on current and past volatility around a dynamic average price, for this we recommend using a weekly chart to identify longer trading opportunities.
As always indicators should be used as part of a trading strategy to assist in making decisions, instead of just blindly following every signal they produce you should always seek to compliment technical trading signals with additional analysis to reduce your risk and increase your odds of making a winning trade.
Examples Of Use On Various Markets and Timeframes
GBP vs CHF Forex Pair 15 Minute Chart
Tesla Stock 1 Minute Chart
Bitcoin vs USD Crypto Pair 15 Minute Chart
Micro E-Mini SP500 Futures 1 Minute Chart
Mastercard vs Visa Stock Daily Pair Chart
To gain access to the Buy Sell Bands and Range Strength Indicators visit our website shown below.
Happy Range Trading :)
DBT MoMo v.4 Candle Color VersionThis indicator is the older version of the DBT MoMo v.4 that colors candles instead of using shading.
For a full write up on this indicator please see:
For Access or Questions: Private message us. Thank you.

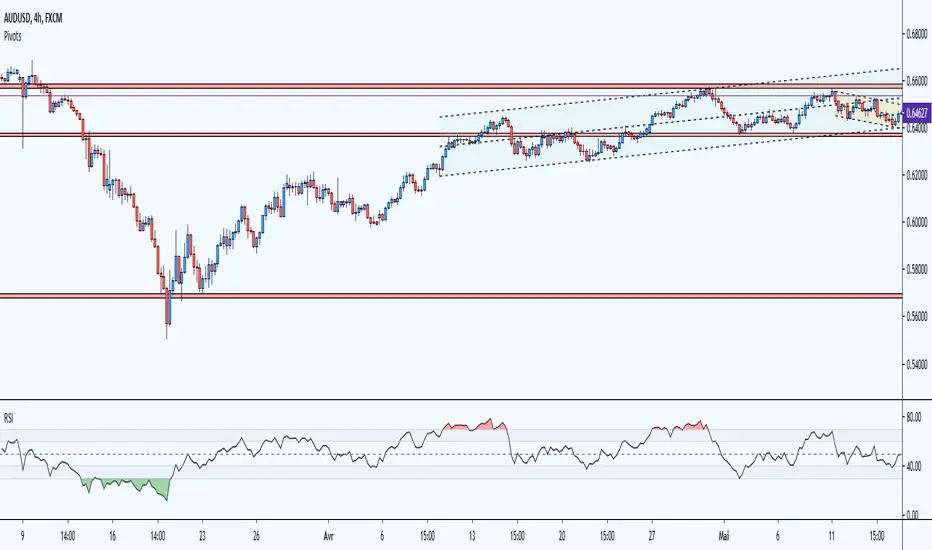
RSI Multicolor editableEN:
RSI with overbought and oversold area in color and editable level. visually more interesting than the basic version the overbought and oversold areas catch the eye quickly. Depending on the strategies and your personal use of the RSI, you can modify all the lines and add colors to each defined zone.
overbought zone, oversold and editable noise zone
I wanted to have a modifiable RSI like some trading platforms.
please excuse me for my english and my code, i'm just getting started.
FR:
RSI avec zone de surachat et survente en couleur et niveau éditable. visuellement plus intéressant que la version basique les zones de surachat et survente attirent l’œil rapidement. Selon les stratégies et l'utilisation personnel que vous faite du RSI, vous pouvez modifier toutes les lignes et ajouter des couleurs à chaque zone défini.
zone de surachat, survente et zone de bruit éditable
je souhaitais avoir un RSI modifiable comme certaines plateforme de trading.
veuillez m'excuser pour mon anglais et mon code, je débute.
B3 Stochastic Full w/BarColorNow with Bar Color!
The simplest upgrade to the classic indicator, old script:
B3 Stochastic Full
Also, if you like this one you may appreciate my personally modified take on the stochastic readings:
B3 Extended Stochastics

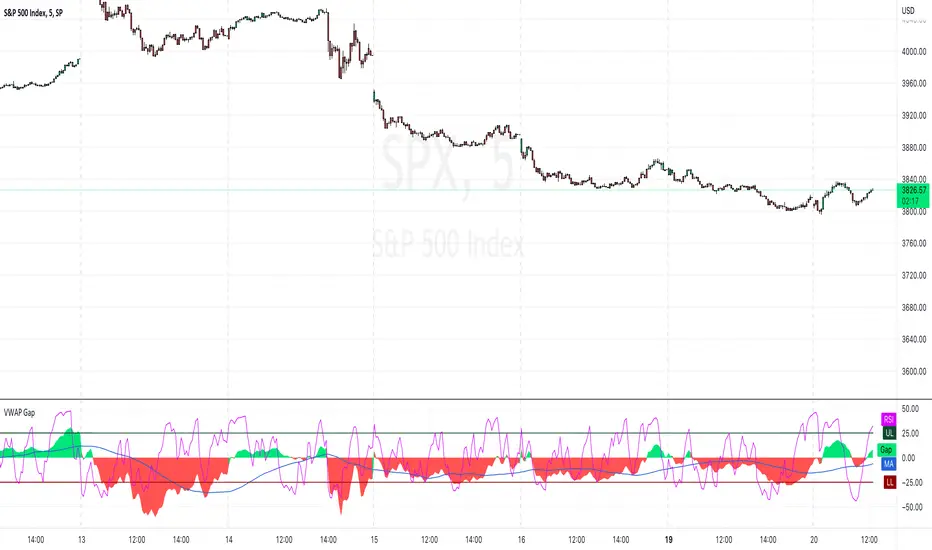
VWAP Gap [AR]This simple indicator measure the difference between price and VWAP line
The VWAP Gap indicator works best on intraday charts
SET-UP INFO
1. Add VWAP to your chart and set it up
2. Open "VWAP Gap Indicator" settings
3. Change source to "VWAP"
Enjoy!
Alex R.
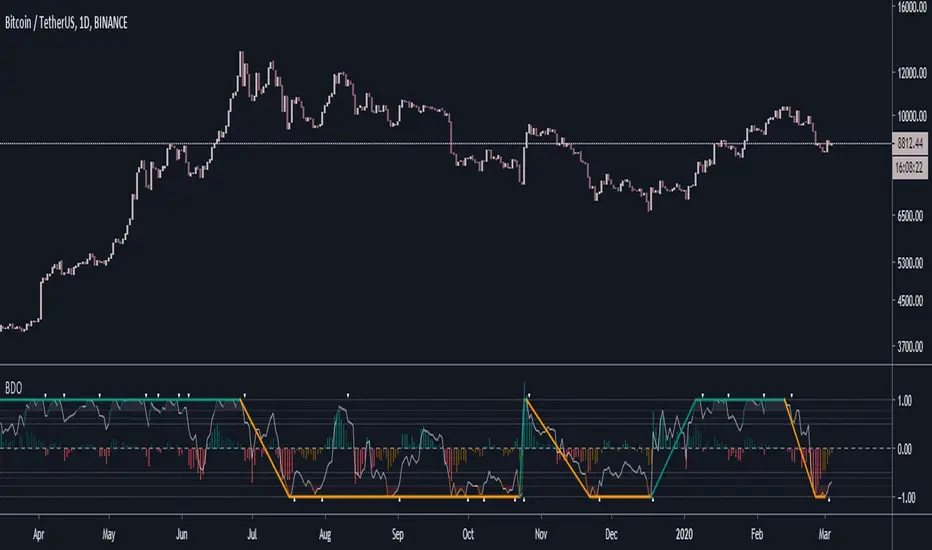
Better Donchian OscillatorWhat is BDO?
- BDO is the Better Donchian Oscillator. This is a proprietary indicator which I derived from the donchian formula.
BDO usage
1. BDO is mainly used to determine overbought and oversold levels. I think it is more accurate in determing these levels than RSI or MACD.
2. It can also be used to follow major trends with a very high accuracy, although it is lagging. However, its main oscillator in the middle is still a leading indicator.
Access and Documentation:
Message or PM to know how to get access.
RSI Call-outs [BigBitsIO]This is a simple RSI indicator that overlays the current chart to show labels for specified oversold and overbought areas defined with inputs.
It will delete any labels of the same kind within the last 3 candles so you don't see as many labels as you would otherwise.
Red labels with white text represent overbought RSI levels as defined by the user.
Green labels with black test represent oversold RSI levels as defined by the user.
This RSI overlay help easily call-out overbought and oversold candles on a chart without sacrificing screen space for a traditional RSI indicator that is not overlayed on the chart.

RSI ChannelHello All. For a while this idea (showing RSI levels on the chart as a channel) was in my mind and finally today I developed the script. I hope it will be usefull for all.
Enjoy!

Range MovementRange Movement is an indicator I created to help me determine a few things:
1. the mood of the market makers and market participants
2. the price trend
What I found after creating the indicator is that it is extremely helpful in finding "EXTREME SENTIMENT" when this line has moved up dramatically and price has too, but then RgMov diverges and signals a weakening support for the stock. When Range Movement surges it reveals extreme optimism and powerful upward movement in price, which can draw in momentum investors and create a blow-off peak in price. So in this instance, RgMov is an overbought, oversold indicator.
What I also found is that when a stock is stuck in a range for a long time that RgMov will breakout FIRST to give an early indicator of the future price move to follow. This can be true for rallies or declines.
In the example I show $TSLA Tesla shares which broke out in RgMov well ahead of the stock price in October 2019. See example on chart.
What is RgMov or Range Movement?
Range Movement, aka "RgMov" is derived from open-high-low-close price data. If the market has moved up more than it has moved down during a given bar, the line will move up. Tracking the cumulative movement of the line over time creates the pattern.
You can use RgMov in many ways. Here's how I created it to be used for the daily trend in any stock or index:
Uptrend = New high over 44 days
Downtrend = New low over 44 days
As long as the trend is up on the 44-day time frame, I use shorter term (11-days, for example) oversold conditions as entry points to buy and go with the uptrend.
If the trend turns down, then I use shorter term (11-days, for example again) overbought readings to go short to trade with the downtrend.

CryptoSignalScanner - Stochastic Trend IndicatorDESCRIPTION:
This script has been designed to provide the ideal buy and sell moment on the lower time frames.
• This scripts is based on the Stochastic RSI Indicator.
• When we are in an uptrend the background becomes green.
• When we are in a downtrend the background becomes red.
• It is also possibility to set the overbought and oversold range.
HOW TO USE:
• When the blue line (stochastic K) has crossed above the red line (stochastic D) in the oversold area then this is the ideal moment to get into a trade.
• When the blue line (stochastic K) has crossed below the red line (stochastic D) in the overbought area then this is the ideal moment to get out of a trade.
• Use this together with the CryptoSignalScanner - Advanced BUY/SELL indicator to get a stronger confirmation.
• Use the Fibonacci tool together with the Eliot Waves to help you to find the ideal buy or sell moment.
HOW TO GET ACCESS TO THE SCRIPT:
• Use the link below to subscribe to our indicators.
REMARKS:
• This advice is NOT financial advice.
• We do not provide personal investment advice and we are not a qualified licensed investment advisor.
• All information found here, including any ideas, opinions, views, predictions, forecasts, commentaries, suggestions, or stock picks, expressed or implied herein, are for informational, entertainment or educational purposes only and should not be construed as personal investment advice.
• We will not and cannot be held liable for any actions you take as a result of anything you read here.
• We only provide this information to help you make a better decision.
• While the information provided is believed to be accurate, it may include errors or inaccuracies.
Good Luck,
The CryptoSignalScanner Team

CryptoSignalScanner - Advanced BUY/SELL indicatorDESCRIPTION:
This script has been designed to do some swing trading on 4 hour and daily candles.
After some adjustments it also gives a good result on the lower timeframes 5m, 15m and 1h.
• This scripts is based on RSI, Stoch RSI and some other indicator(s).
• It provides BUY, SELL, STRONG BUY and STRONG SELL labels when loading the script.
• It is also possibility to set a BUY, STRONG BUY, SELL, STRONG SELL, BUY/SELL or STRONG BUY/STRONG SELL alert.
HOW TO USE:
• When a BUY signal appears it means that the trading pair is oversold. Wait for the reversal to buy. Use the Fibonacci tool together with the Eliot Waves Theory to BUY or SELL or wait for the SELL signal.
• When a SELL signal appears it means that the trading pair is overbought. SELL immediately or use the Fibonacci tool together with the Eliot Waves Theory to SELL.
FEATURES:
• You can show/hide the labels based on RSI, Stoch RSI input values.
• You can show/hide the labels based on Stoch RSI K and R input values.
• You can show/hide the labels based on Stoch RSI K and R crossing.
• You can show only STRONG BUY or STRONG SELL labels.
• Etc...
HOW TO GET ACCESS TO THE SCRIPT:
• Use the link below to subscribe to our indicators.
• Based on this script we provide telegram channels that provides signals for all Binance BTC, ETH, USDT and BNB pairs.
REMARKS:
• This advice is NOT financial advice.
• We do not provide personal investment advice and we are not a qualified licensed investment advisor.
• All information found here, including any ideas, opinions, views, predictions, forecasts, commentaries, suggestions, or stock picks, expressed or implied herein, are for informational, entertainment or educational purposes only and should not be construed as personal investment advice.
• We will not and cannot be held liable for any actions you take as a result of anything you read here.
• We only provide this information to help you make a better decision.
• While the information provided is believed to be accurate, it may include errors or inaccuracies.
Good Luck,
The CryptoSignalScanner Team

RSI Divergence Plotter (2020)How do i use this script?
Firstly, be sure that you have done your research on what divergence is. The oscillator will automatically mark all types of divergence and has coloured 'over bought' and 'oversold' levels at 30 and 70, although reliable, be sure to use other Technical Analysis before entering trades.
Thank you.

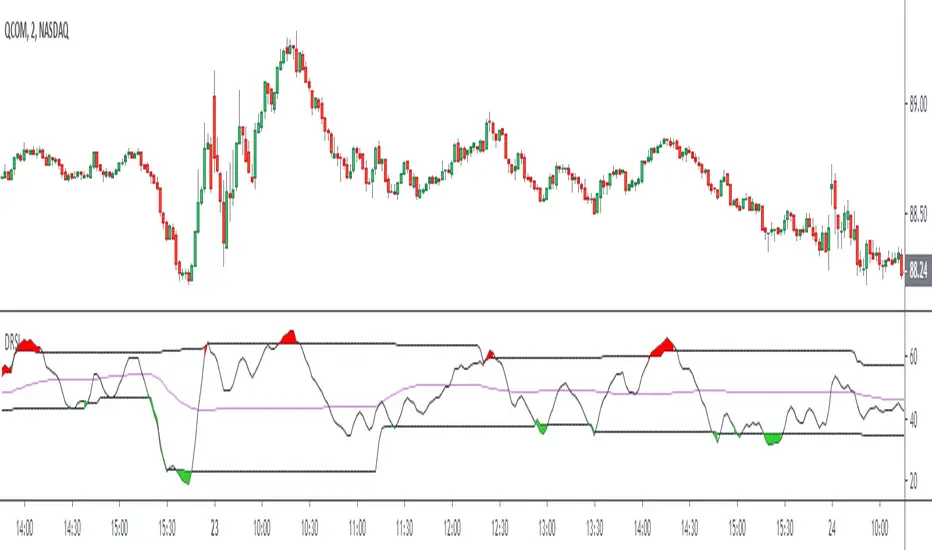
Dynamic RSIThe Dynamic RSI indicator is a kind of exponential RSI. The overbought and oversold levels (respectively HiLine and LoLine) are calculated according to the recent highest and lowest values of the Dynamic RSI line.
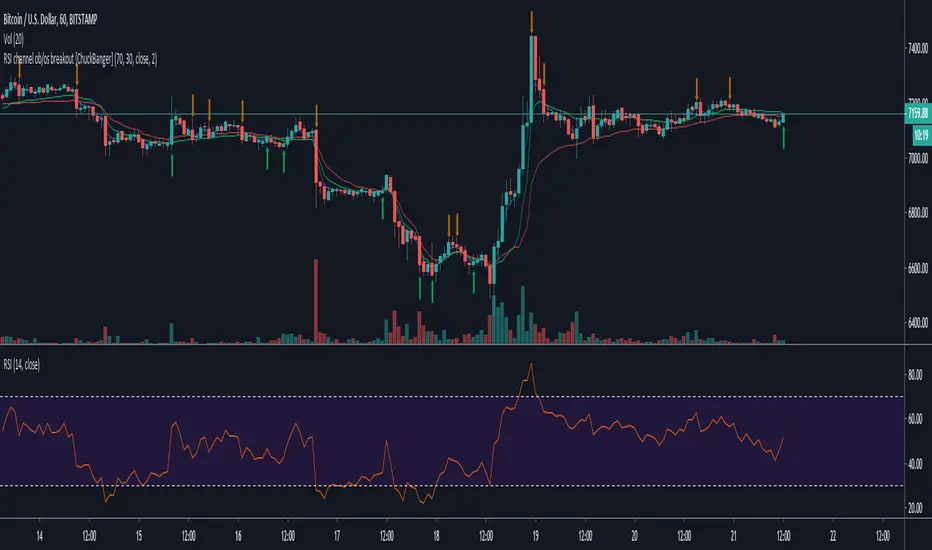
RSI channel ob/os breakout [ChuckBanger]This is a breakout signal script based on reverse engineering of RSI. It shows a channel of overbought and oversold readings that the trader can sett in settings. When low crosses under lower line it shows bullish signal and when high is crossing upper line it shows a bearish signal. The script also has wilder's moving average as filter instead of high/low.
Good luck traders!
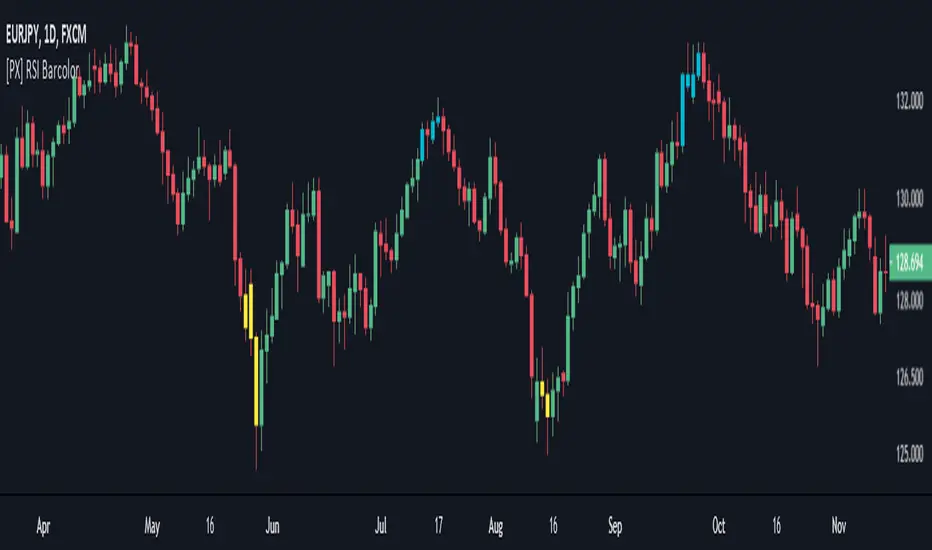
[PX] RSI BarcolorThis script simply colors the candles based on the defined "overbought" and "oversold" RSI-levels set in the input section of the indicator.
If the price is below the oversold level, the candle is colored in yellow.
If the price is above the overbought level, the candle is colored in aqua.
If the price moves back between both levels, no color will be applied.
Might be useful for some of you ;)
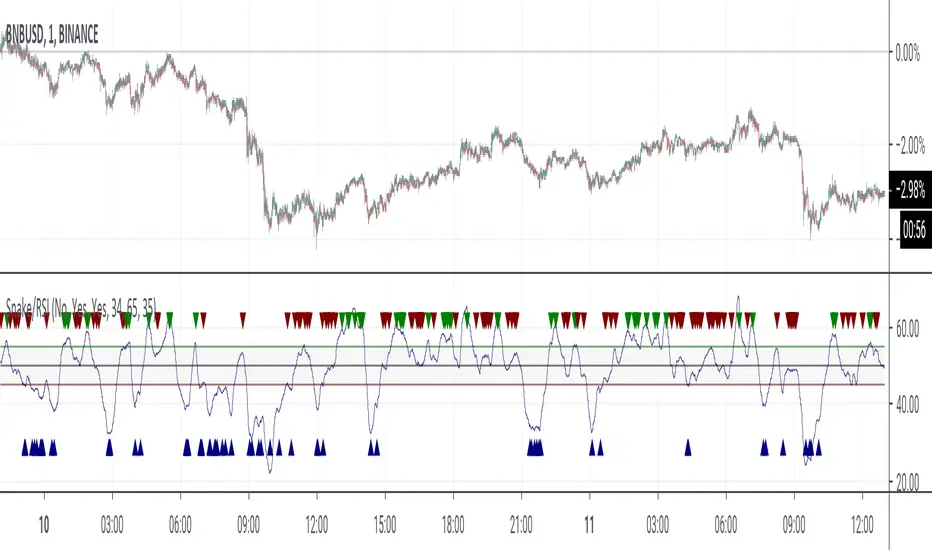
Snake/RSIThis study is similar to my Snake study. The differernce is that instead of following a moving average, this "snake" follows a RSI closely looking for the best opportunities to buy/sell.
Dark red triangles at the bottom are buy signals with alerts of BUY ASSET. Dark red triangles to the top are sell signals with alerts of SELL ASSET.
Overbought and oversold are configurable as well as the length of the RSI itself.
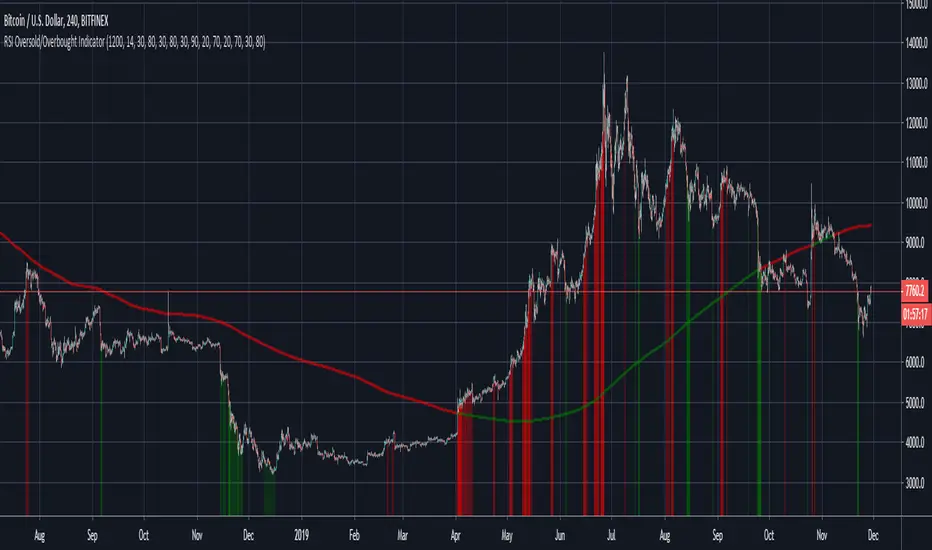
RSI Oversold/Overbought IndicatorThis is a very simple but quite powerful indicator which looks at the RSI simultaneously over the 4h, Daily and Weekly timeframes, and places bands on the chart when one or more timeframes move into oversold/overbought territory. For further filtering I use the 200 day SMA to determine if we are in a Bull or Bear market, which puts a bias on the RSI (30/80 in a Bull market and 20/70 in a Bear market).
The deeper the colour, the more oversold the market is. The weekly RSI can be used as an early warning sign, with the Daily/ 4h RSI useful to identify local peaks.
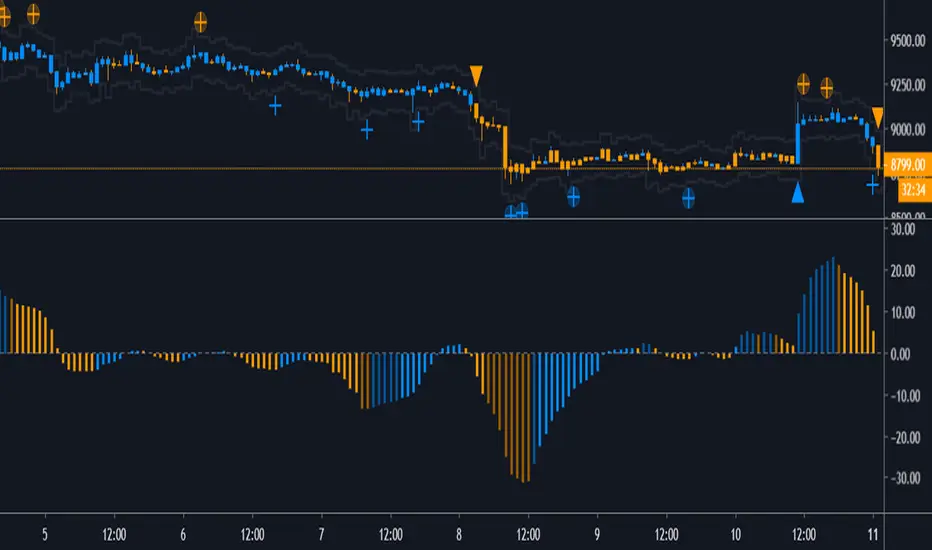
Project Windfall BETAThis oscillator is designed to be used in confluence with the PROJECT ROYALTY BETA.
The oscillator to end all oscillators. With over 1000 lines of code, this oscillator provides a detailed and responsive look at trend direction.
Color Description:
Blue is showing bullish movement. Price action is most likely moving upwards.
Darkened Blue is showing extreme bullish movement. This does not guarantee that price is or soon will be rocketing. The coloring is related to recent bullish movement. Color could be darkened while price could be increasing slowly.
Orange is showing bearish movement. Price action is most likely moving downwards.
Darkened Orange shows extreme bearish movement. Again, this does not guarantee that price is or soon will be plummeting. The coloring is related to recent bearish movement. Color could be darkened while price could be decreasing slowly.
Trading Strategy
LONG when color turns from any orange to any blue.
LONG when the oscillator is below the zero line, is increasing (blue), and when the color changes from dark to light.
SHORT when color turns from any blue to any orange.
SHORT when the oscillator is above the zero line, is decreasing (orange), and when the color changes from dark to light.
IMPORTANT:
This oscillator is specifically tuned for BTCUSD and is most effective on the 1 HOUR . Be warned when trading any other instrument with this oscillator.
WaveTrend Oscillator + Divergence + Direction Detection +AlertsMake this version of the famous WaveTrend indicator has the following characteristics:
- WaveTrend direction detection
- Customizable overbought and oversold level (set by default just like the original version)
- Possibility to modify the length of the channel (set by default same as the original version)
- Possibility of modifying mobile period (set by default same as the original version)
- Show ONLY overbought sales.
- Show all sales.
- Show ONLY purchases in oversold.
- Show all purchases.
- See histogram.
- See half signal.
- Paint Bars.
- Modification of colors.
Alerts:
The indicator has the following alerts:
- Sales in oversold
- All Sales
- Purchases in oversold
- All Purchases
- Purchases / Overbought sales / Sales
- All Sales / Purchases
- Change WT Direction
NOTE: This single indicator should not be taken as a trading strategy is only a tool for the trader that gives a sense of depth market and potential opportunities for purchase / sale which must be evaluated in the context generally used this indicator to look for positions in areas of overbought / sell, also for detecting differences, other aspects such as the direction of Wavetrend, levels, histogram, etc, also provide useful information.
Release Notes: Add a field to change reaction and color change direction WT, is set to 1 as fast (default), better greater number address filter but is slower.
Release Notes: Add a Hidden Divergences detector and Regulars (bulls and the bears), from setup can activate them, also can turn off the labels and leave only the lines, configure it to your liking.
NOTE: SCRIPT IN SPANISH

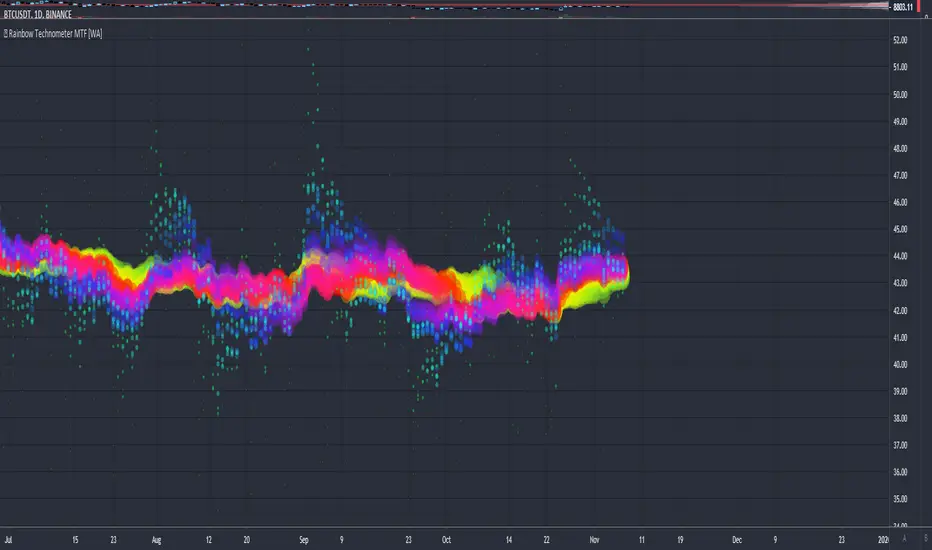
Rainbow Technometer - Multi Timeframe [WYCKOFF ARSENAL]🌈 Rainbow Technometer - Multi Timeframe WYCKOFF ARSENAL
The purpose of the Technometer is to provide a mathematical indication of the degree to which the market is overbought or oversold .
The value of the Technometer could be as high as 100 or as low as 0. The other possible values would represent degrees of overbought or oversold.
In Rainbow form, the Technometer could also be used as a trend-following indicator.
The Rainbow Technometer can be used on any available timeframes and assets with volume data .
It is a combination of Technometer instances of different lengths that are plotted on the same chart.
The confluence zones can hint at a price reversal and help estimate the trend strength.
The Rainbow Technometer can be combined with other technical analysis tools as a trend-following indicator.
When the trend is strong and the other indicators used to determine entry points send a bullish or a bearish signal, a position can be opened.
When the trend is weak, opening new positions should not be to consider.
The Rainbow Technometer can also be used on its own. The angles of the Rainbow will hint at the trend strength.
The steeper the curve, the stronger the trend. The flatter the curve, the weaker the trend.
A Buy position can be opened in the beginning of a strong positive trend .
A Sell position can be opened in the beginning of a strong negative trend .
During a strong trend, short-lived retracements can be found, and it is possible to enter a position in the direction of the general trend against the retracement.
The Rainbow mode can be experienced with the Multi RSI indicator as well.
Related tools :
▪ Optimism Pessimism
▪ Force
- 🌈 Rainbow Force
▪ Technometer
- 🌈 Rainbow Technometer ◄
▪ Momentum
- 🌈 Rainbow Momentum
▪ Market Screener
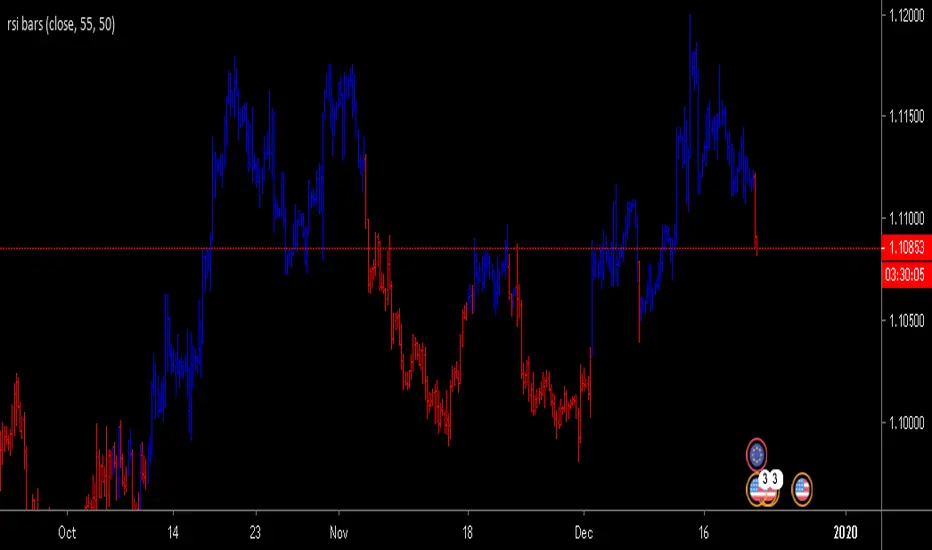
RSI bars chartShows RSI over-bought /over-sold conditions with specific bar-color on main chart.
All inputs such as color, RSI value & level are modifiable by users.
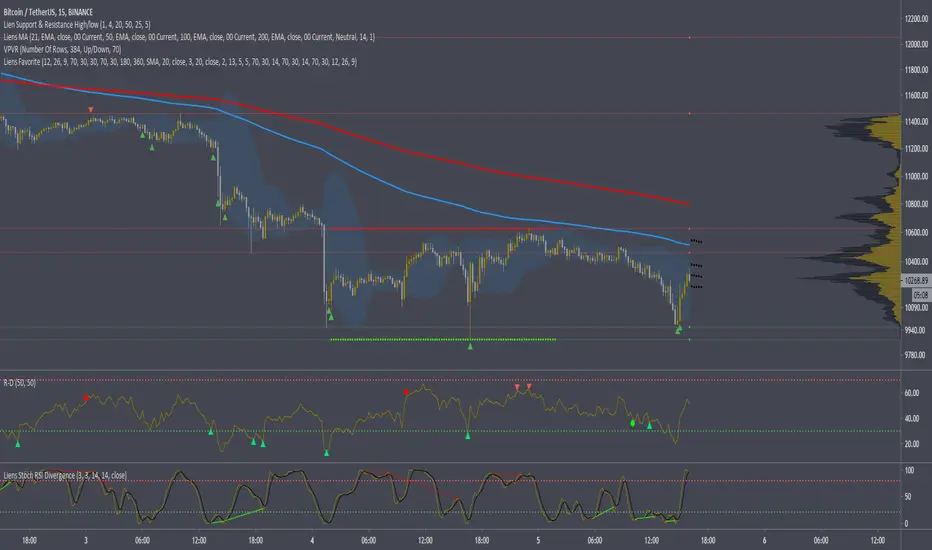
Liens FavoriteMy favorite scripts togheter.
1. Long / M/S-R.Trend changing direction. This is best on higher tf, but can be used on lower aswell. It gives signals when stochastic is overbought/oversold and the macd is crossing the 0 line.
2. This script got 2 ema lines ( Buy/Sell crosses )
3. MA line that changes color. Options - SMA", "EMA", "WMA", "VWMA", "SMMA", "DEMA", "TEMA", "HullMA", "ZEMA", "TMA", "SSMA". Sometimes i use this(ma) insdead of the bb center line.
4. Standar Bollinger bands with buy and sell signals - also added a function so buy and sell signals only show when stochastic is overbought/oversold for less false signals.
5. Stochastic Oversold/overbought on chart.
6. Macd Bearish and bullish crosses on chart.
Alerts for all functions.