Day Trading Astra by Pooja📌 Day Trading Astra by Pooja
Day Trading Astra by Pooja is specily designed for F&O Traders, a clean and fast momentum-shift indicator designed to support day traders with clear entry signals and structured filtering.
It uses a refined RSI–MA crossover engine, allowing traders to visualize momentum transitions directly on the price chart with minimal clutter.
✨ Key Features
🔶 1. RSI–MA Crossover Engine
Identifies potential momentum shifts using a fast RSI and smoothed RSI-MA baseline.
🔶 2. Clean BUY/SELL Chart Signals
Markers appear directly on the candle chart—easy to read, no extra panes.
🔶 3. Smart Filtering System (Optional)
To help reduce low-quality signals in uncertain conditions:
ADX trend-strength filter
ATR volatility check
Slope validation
Minimum bars between two signals
🔶 4. Alert + Webhook Ready
Supports TradingView alerts and webhook integration for automation tools.
Each alert includes symbol, direction, price, timestamp, unique ID, and an optional secret key for secure execution.
🔶 5. Multi-Timeframe Flexible
Works across all timeframes; users can apply it according to their day-trading style.
📝 How to Use
Add indicator to chart.
Select your preferred filters or use default settings.
Enable alerts if automated notifications are needed.
Combine with your own risk management and trading framework.
This tool is meant to support analysis, not replace personal judgment.
⚠️ Disclaimer
This script is a technical analysis tool and not financial advice.
Results vary depending on market conditions and user settings.
No indicator can guarantee profits or eliminate risk.
Always test settings before applying them in live markets.
The user is fully responsible for all trading decisions.
⭐ Summary
A clean, fast, and structured momentum-entry tool designed to help day traders identify potential intraday shifts with clarity and alert support.
Optionselling

Straddle Charts - Live
Description :
This indicator is designed to display live prices for both call and put options of a straddle strategy, helping traders visualize the real-time performance of their options positions. The indicator allows users to select the symbols for specific call and put options and fetches their prices on a 1-minute timeframe, ensuring updated information.
Key Features :
Live Call and Put Option Prices: View individual prices for both call and put options of the straddle, plotted separately.
Straddle Price Calculation: The total price of the straddle (sum of call and put) is displayed, allowing for easy monitoring of the straddle’s combined movement.
Customizable Inputs: Easily change the call and put option symbols directly from the settings.
Use this indicator to stay on top of your straddle's value and make informed trading decisions based on real-time data.

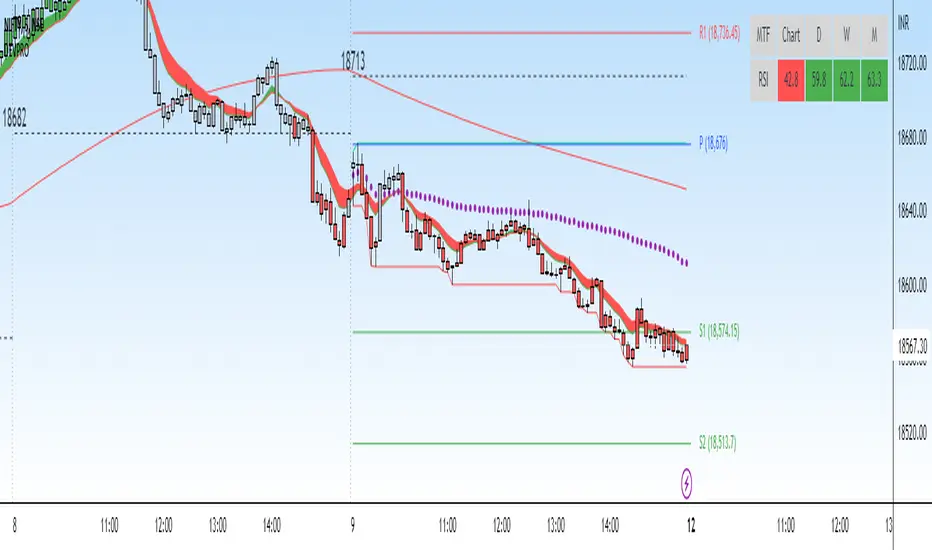
DEVPRO TradingDEVPRO Trading system comprises of the following:
D - Double (EMA and VWAP)
E - EMA
V - VWAP (current and previous day ending VWAP level)
P - Standard Pivot Point
R - RSI (Multi-time frame table is added at the top and traders can add standard RSI 14 as an additional non-overlay indicator)
O - OI data (not available for options trading in TV but trader can always check in their broker terminal)
Double EMA have been color coded in red and green for bullish and bearish trends.
Candles are colored for bullish (green), sideways (grey) and bearish (red) phases.
Setup to be traded with monthly options for stocks and weekly options for indices.
Bullish Setup:
RSI greater than 50
Current candle close above VWAP and previous day closing VWAP
Current candle close above daily Pivot
For option buying (Call option OI should be falling below its moving average 20 meaning short covering)
For option selling (Put option OI should be rising above its moving average 20 meaning Put writers confidence is increasing)
Book partial qty profits at R1/R2/R3 and/or exit completely on Doji candle low break
Bearish Setup:
RSI less than 50
Current candle close below VWAP and previous day closing VWAP
Current candle close below daily Pivot
For option buying (Put option OI should be falling below its moving average 20 meaning short covering)
For option selling (Call option OI should be rising above its moving average 20 meaning Call writers confidence is increasing)
Book partial qty profits at S1/S2/S3 and/or exit completely on Doji candle high break
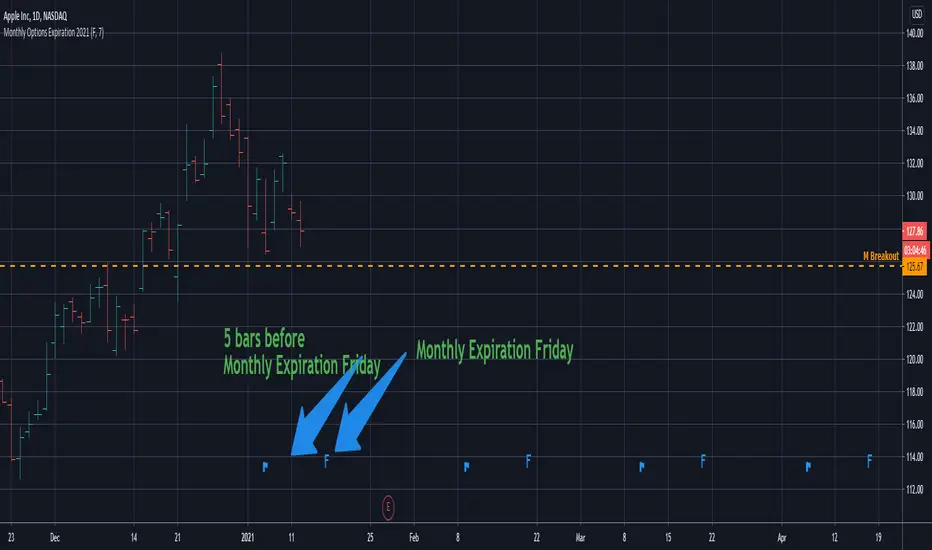
Monthly Options Expiration 2021Monthly options expiration for the year 2021.
Also you can set a flag X no. of days before the expiration date. I use it at as marker to take off existing positions in expiration week or roll to next expiration date or to place new trades.
Happy new year 2021 in advance and all the best traders.
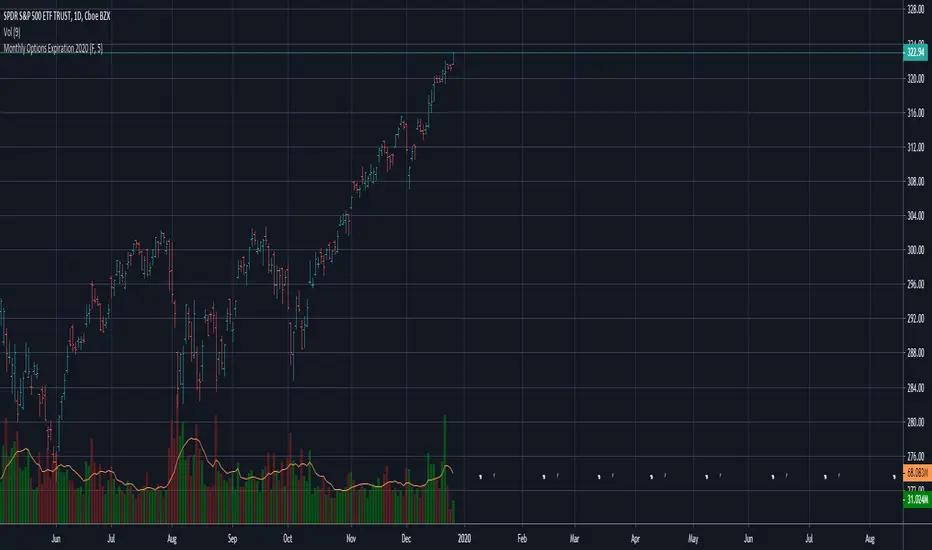
Monthly Options Expiration 2020Monthly options expiration for the year 2020.
Also you can set a flag X no. of days before the expiration date. I use it at as marker to take off existing positions in expiration week or roll to next expiration date or to place new trades.
Happy new year 2020 and all the best traders.