Gold NY Session Key TimesJust showing to us that news come out, open market, close bond for NY Session Time For Indonesia
Options

Hedge Pressure Index (HPI)Hedge Pressure Index (HPI)
Overview
The Hedge Pressure Index (HPI) is a flow-aware indicator that fuses daily options Open Interest (OI) with intraday put/call volume to estimate the directional hedging pressure of market makers and dealers. It helps traders visualize whether options flow is creating mechanical buy/sell pressure in IWM, and when that pressure may be shifting.
What HPI Shows
Daily OI Baseline (white line): Net OI carried forward intraday (Put OI − λ × Call OI). Updated once daily before the open.
Intraday Flow (teal line): Net put minus λ × call volume in real time. Smoothed to show underlying flow.
Spread Histogram (gray): Divergence between intraday flow and daily OI.
HPI Proxy Histogram (blue): Intraday hedge-pressure intensity. Strong extremes indicate heavy one-sided dealer hedging.
Trading Signals
Crossover:
When intraday Volume line crosses above OI, it suggests bullish hedge pressure.
When Volume line crosses below OI, it suggests bearish hedge pressure.
Z-Score Extremes:
HPI ≥ +1.5 → strong mechanical bid.
HPI ≤ −1.5 → strong mechanical offer.
Alerts: Built in for both crossovers and extreme readings.
How to Use HPI
1. Confirmation Tool (recommended for most traders):
Trade your usual price/technical setups.
Use HPI as a confirmation: only take trades that align with the hedge pressure direction.
2. Flow Bias (advanced):
Use HPI direction intraday as a standalone bias.
Fade signals when the histogram mean-reverts or crosses zero.
Best practice: Focus on the open and first 2 hours where hedging flows are most active. Combine with ATR/time-based stops.
Inputs
Demo Mode: If no OI/volume feed is set, the script uses chart volume for layout.
λ (Call Weight): Adjusts how much call volume offsets put volume (default = 1.0).
Smoothing Length: Smooths intraday flow line.
Z-Score Lookback: Sets lookback window for HPI extremes.
Custom Symbols:
Daily Net OI (pre-open OI difference).
Intraday Put Volume.
Intraday Call Volume.
Setup Instructions
Add the indicator to an IWM chart.
In Inputs, either keep Demo Mode ON (for layout) or enter your vendor’s Daily Net OI / Put Volume / Call Volume symbols.
Set alerts for crossovers and strong HPI readings to catch flow shifts in real time.
Optionally tune λ and smoothing to match your feed’s scale.
Notes
This is a proxy for dealer hedge pressure. For highest accuracy, replace the proxy histogram with gamma-weighted flow by strike/DTE when your data feed supports it.
Demo mode is for visualization only; live use requires a valid OI and volume feed.
Disclaimer
This script is for educational and research purposes only. It is not financial advice. Options and derivatives carry significant risk. Always test in a demo environment before using live capital.

Iron Condor Pro v6 – Full EngineIronCondor Engine v6.6 is a multi-mode options strategy tool for planning and managing iron condors, straddles, strangles, and butterflies. It supports both setup planning and live trade tracking with modeled delta, risk-based strike selection, IV rank estimation, and visual breach alerts.
Use Setup Mode to preview strike structures based on IV proxy, ATR, delta targeting, and risk tier (High/Mid/Low/Delta). Use Live Mode to track real trades, enter strike/premium data, and monitor live P&L, delta drift, and range status.
This script does not connect to live option chains. Volatility and delta are modeled using price history. All strikes and premiums must be confirmed using your broker before placing trades. Best used with strong support/resistance levels and high IV rank (30%+).
For educational purposes only.
Workflow Guide
Use this flow whether you're setting up on Sunday night or any day before placing a trade.
Step 0: Pre-Script Preparation
Before using the script:
Identify major support and resistance zones on your chart. Define the expected range or consolidation area. Use this context to help evaluate strike placement
1. Setup Phase (Pre-Trade Planning)
Step 1 – Load the Script
Add: IronCondor Engine v6.6 – Full Risk/Decay Edition to your chart
Step 2 – Set Mode = Setup
This enables planning mode, where the engine calculates strike combinations based on:
Your selected risk profile (High, Mid, Low, or Delta)
Historical volatility (20-day log return)
ATR (Average True Range)
Target short delta (adjustable)
Step 3 – Review Setup Table
Enable Show Setup Table to view calculated strikes and width by risk tier.
Adjust any of the following as needed:
Target Short Delta
Strike Interval ($)
Width multipliers (High/Mid/Low)
Risk tier under Auto-Feed Choice
Step 4 – Evaluate the Setup
Is the net credit at least 1.5–2.0x your max risk?
Are the short strikes clearly outside support/resistance zones?
Are the short deltas between 0.15 and 0.30?
Is the range wide enough to handle normal price movement?
Step 5 – Prep for Execution
Enable Auto-Feed Setup → Live to carry Setup strikes into Live mode
Or disable it if you prefer to manually enter strikes later
2. Trade Execution (Live Tracking Mode)
Step 1 – Place the Trade with Your Broker
Use your brokerage (TOS, Tasty, IBKR, etc.) to place the iron condor or other structure
Step 2 – Set Mode = Live
In Live mode:
If Auto-Feed is ON, the Setup strikes auto-populate
If Auto-Feed is OFF, manually enter:
Short and long strikes (Call and Put)
Premiums collected/paid per leg
Total net credit (Entry Credit)
Optional: Input current mid prices for each leg in the "Live Chain" section to track live mark-to-market P&L
Once all required fields are valid, the script activates:
Real-time profit/loss tracking
Max risk estimate
Delta monitoring on short legs
IV Rank estimate
Breach detection system
Chart visuals (if enabled)
3. Trade Management (During the Week)
While the trade is active, use the dashboard and visuals to monitor:
Key Metrics:
Unrealized P/L %
Mark-to-market value vs entry credit
Daily decay (theta)
Days until expiration
Breach status:
In Range
Near Breach
Breached
Alerts:
Price near short strike → suggests roll
Price breaches long strike → breach alert
50% or 75% profit → optional exit signal
Delta exceeds threshold → exposure may need adjustment
Management Tips:
At 50–75% profit: consider closing early
If price nears a short leg: roll, hedge, or manage
If nearing expiry: decide whether to hold or close
If IV collapses: may accelerate time decay or reduce exit value
4. End-of-Week or Expiration Management
If Profit Target Hit
Close early to reduce risk and lock gains
If Still Open Near Expiry
Close the position or
Hold through expiration only if you're fully prepared for pinning/gamma/assignment scenarios
Avoid holding open spreads over the weekend unless part of a defined strategy
Reference Notes
Strike Width
Defined as:
Width = Distance between Short and Long strike
Used for calculating max loss and breach visuals
Delta Guidelines
0.15–0.20 = safer, wider range, lower credit
0.25–0.30 = more aggressive, tighter range, higher credit
Use Target Short Delta input to adjust auto-selected strikes accordingly
Credit Example
Sell Call: $1.04
Sell Put: $0.23
Buy Call + Put wings: $0.14
Net Credit = $1.13 = $113 per contract (max profit)
This is the max profit if price stays between short strikes through expiration
IV Rank (Estimated)
This script does not use options chain IV data.
Instead, it calculates a volatility proxy:
ivRaw = ta.stdev(log returns, 20) * sqrt(252)
IV Rank is then calculated as the percentile of this value within the last 252 bars.
High IV Rank (30%–100%) → better premium-selling conditions
Low IV Rank (<30%) → lower edge for condors
Ideal to sell premium when IV Rank is above 30–50%
Disclosures and Limitations
This script is for educational use only
It does not connect to live option chains
All strikes, deltas, and premiums must be validated through your broker
Always confirm real-time IV, delta, and pricing before placing a trade

Pro Momentum Table + Trade Alerts📊 Indicator Name: Pro Momentum Table – ADX + DI + ATR + Astro Timing
🧠 Concept:
This indicator is designed for professional scalpers and intraday traders who want to capture only strong momentum waves — not noise. It combines trend strength, volatility, directional movement, momentum oscillation, vega divergence, and astrological timing into a single compact table on your chart.
⚙️ Components Explained:
Metric Description
ADX (Average Directional Index) Measures the strength of the trend. Values above 20 indicate that a meaningful move is starting.
+DI / -DI (Directional Indicators) Show whether buyers (+DI) or sellers (-DI) are dominating. Increasing +DI with ADX rising = bullish momentum. Increasing -DI with ADX rising = bearish momentum.
ATR (Average True Range) Shows volatility and expected range. Used for setting realistic stop-loss and multi-level targets (1×, 1.5×, 2×, 2.5× ATR).
Price Displays the current price level for quick reference.
CMO (Chande Momentum Oscillator) Measures short-term momentum direction and strength. Helps identify overbought/oversold conditions in trend continuation.
Vega Divergence Shows a synthetic reading of volatility pressure — "Bullish" when volatility expansion supports upward moves, "Bearish" for downward pressure, and "Neutral" otherwise.
Astro Remark Suggests ideal time windows based on planetary cycles for scalping entries. “Bullish Window” often aligns with high-probability long trades; “Bearish Window” favors shorts.
Trade Signal The core momentum condition: “Bullish Momentum” if ADX > 20 and +DI rising, “Bearish Momentum” if ADX > 20 and -DI rising, else “No Clear Momentum.”
📈 How to Use:
Wait for ADX > 20 – This confirms that the market is entering a strong momentum phase.
Check DI direction:
✅ +DI rising: Buyers gaining strength → look for long setups.
✅ -DI rising: Sellers gaining strength → look for short setups.
Use ATR to plan exits:
🎯 TP1 = Entry ± 1 × ATR
🎯 TP2 = Entry ± 1.5 × ATR
🎯 TP3 = Entry ± 2 × ATR
🎯 TP4 = Entry ± 2.5 × ATR
CMO & Vega Divergence: Confirm momentum direction and volatility expansion before committing.
Astro Remark: Align your scalping activity with the planetary support window for higher probability trades.
🪙 Pro Tips for Scalpers:
Only trade when ADX > 20 and DI is consistently rising. Ignore signals in choppy or sideways phases.
Avoid trades if Vega is neutral and CMO is flat – these usually indicate fake breakouts.
If targets aren’t hit within expected ATR-based time, treat the move as false and exit early.
Combine with 9 EMA and 20 EMA (hidden) for wave structure confirmation without cluttering the chart.
💡 Summary:
This indicator acts as a real-time trade decision dashboard. It removes clutter from the chart and delivers everything a professional scalper needs — strength, direction, volatility, momentum, timing, and actionable trade bias — all in one elegant table.

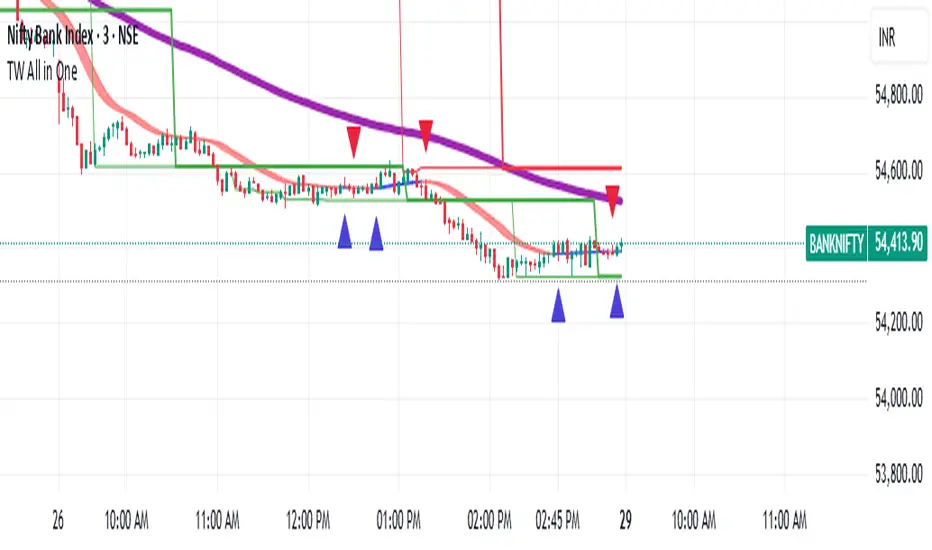
TW All in OneIts a overlap strategy, giving signals for buy and sell.
Mostly suitable for Bank Nifty. Nifty and crude oil
Tristan's Star: 15m Shooting Star DetectorThis script is designed to be used on the 1-minute chart , but it analyzes the market as if you were watching the 15-minute candles.
Every cluster of 15 one-minute candles is grouped together and treated as a single 15-minute candle.
When that 15-minute “synthetic” candle looks like a shooting star pattern (small body near the low, long upper wick, short lower wick, bearish bias), the script triggers a signal.
At the close of that 15-minute cluster, the script will:
Plot a single “Sell” label on the last 1-minute bar of the group.
Draw a horizontal line across the 15 bars at the high, showing the level that created the shooting star.
Optionally display a table cell in the corner with the word “SELL.”
This lets you stay on the 1-minute timeframe for precision entries and exits, while still being alerted when the higher-timeframe (15-minute) shows a bearish reversal pattern.

J. YOUNG INDICATOR (2)QUICK REFERENCE to help with a PRICE FOR OPTIONS and or B/H entry MEDIAN PRICE of the MONTHLY/QUARTERLY aVWAPS to get a more accurate price point

Trend + Squeeze High VolatilityGood for High Volatility Stocks and Options
Trend and Squeeze High Volatility
Good For High Volatility Stocks and Options
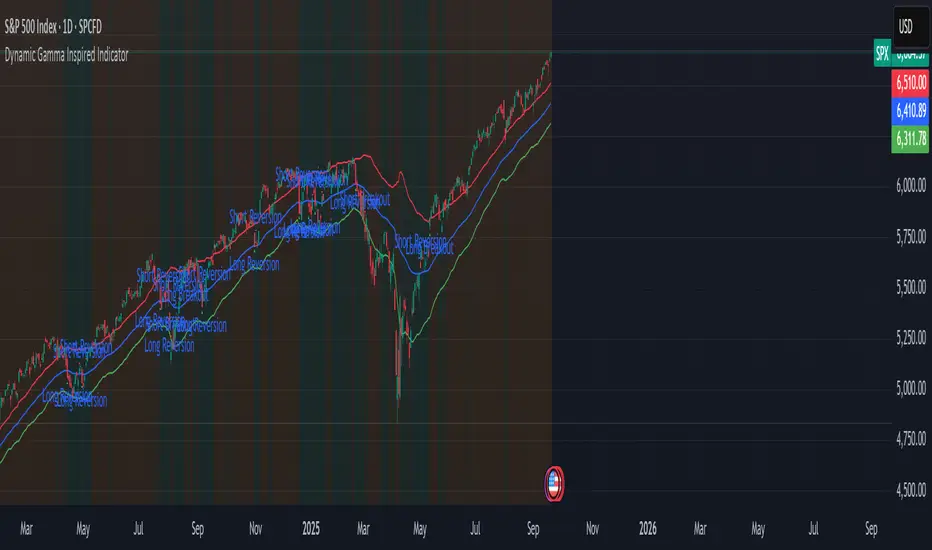
Dynamic Gamma Inspired IndicatorDynamic Gamma Inspired Indicator
This indicator identifies potential market regime shifts between low-volatility (mean-reverting) and high-volatility (trending) environments by using a dynamic, volatility-adaptive framework inspired by options market gamma exposure concepts.
Core Concepts
This indicator uses a volatility-based model that mimics how market maker hedging can influence price stability and volatility. While it's not possible to calculate true Gamma Exposure (GEX) in Pine Script without external options data, this script uses the Average True Range (ATR) as a proxy to create dynamic zones that adapt to current market conditions.
Positive Gamma Environment (Green Background) When price is contained within the upper and lower walls, it suggests a period of stability where market makers' hedging may suppress volatility. In this "mean-reversion" regime, prices tend to revert to the central pivot.
Negative Gamma Environment (Orange Background) When price breaks outside the walls, it signals a potential increase in volatility, where hedging can amplify price moves. This "trend-amplification" regime suggests the potential for strong breakout or trend-following moves.
How It Works
The indicator is built on three key components that dynamically adjust to market volatility:
Dynamic Pivot (Blue Line) An Exponential Moving Average (EMA) acts as the central "zero gamma" pivot point.
Dynamic Walls (Red & Green Lines) These upper and lower bands are calculated by adding or subtracting a multiple of the Average True Range (ATR) from the central EMA pivot. This is similar to how Keltner Channels use ATR to create volatility-based envelopes. The walls expand during high volatility and contract during low volatility.
How to Use This Indicator
The indicator automatically plots signals based on the current market regime:
Mean-Reversion Signals (Inside the Walls)
Long Reversion: Appears when the price crosses up through the central pivot, suggesting a potential move toward the upper wall.
Short Reversion: Appears when the price crosses down through the central pivot, suggesting a potential move toward the lower wall.
Breakout Signals (Outside the Walls)
Long Breakout: Appears when the price breaks and closes above the upper wall, signaling the start of a potential uptrend.
Short Breakout: Appears when the price breaks and closes below the lower wall, signaling the start of a potential downtrend.
Customization
You can tailor the indicator to different assets and timeframes by adjusting the following inputs:
Central Pivot EMA Length: Determines the period for the central moving average.
ATR Length for Walls: Sets the lookback period for the Average True Range calculation.
ATR Multiplier for Walls: Adjusts the width of the channel. A larger multiplier creates wider walls, filtering out more noise but providing fewer signals.
Disclaimer: This indicator is a tool for analysis and should not be used as a standalone trading signal. Always use proper risk management and combine it with other analysis methods. Past performance is not indicative of future results.
Implied Volatility RangeThe Implied Volatility Range is a forward-looking tool that transforms option market data into probability ranges for future prices. Based on the lognormal distribution of asset prices assumed in modern option pricing models, it converts the implied volatility curve into a volatility cone with dynamic labels that show the market’s expectations for the price distribution at a specific point in time. At the selected future date, it displays projected price levels and their percentage change from today’s close across 1, 2, and 3 standard deviation (σ) ranges:
1σ range = ~68.2% probability the price will remain within this range.
2σ range = ~95.4% probability the price will remain within this range.
3σ range = ~99.7% probability the price will remain within this range.
What makes this indicator especially useful is its ability to incorporate implied volatility skew. When only ATM IV (%) is entered, the indicator displays the standard Black–Scholes lognormal distribution. By adding High IV (%) and Low IV (%) values tied to strikes above and below the current price, the indicator interpolates between these inputs to approximate the implied volatility skew. This adjustment produces a market-implied probability distribution that indicates whether the option market is leaning bullish or bearish, based on the data entered in the menu:
ATM IV (%) = Implied volatility at the current spot price (at-the-money).
High IV (%) = Implied volatility at a strike above the current spot price.
High Strike = Strike price corresponding to the High IV input (OTM call).
Low IV (%) = Implied volatility at a strike below the current spot price.
Low Strike = Strike price corresponding to the Low IV input (OTM put).
Expiration (Day, Month, Year) = Option expiration date for the projection.
Once these inputs are entered, the indicator calculates implied probability ranges and, if both High IV and Low IV values are provided, adjusts for skew to approximate the option market’s distribution. If no implied volatility data is supplied, the indicator defaults to a lognormal distribution based on historical volatility, using past realized volatility over the same forward horizon. This keeps the tool functional even without implied volatility inputs, though in that case the output represents only an approximation of ATM IV, not the actual market view.
In summary, the Implied Volatility Range is a powerful tool that translates implied volatility inputs into a clear and practical estimate of the market’s expectations for future prices. It allows traders to visualize the probability of price ranges while also highlighting directional bias, a dimension often difficult to interpret from traditional implied volatility charts. It should be emphasized, however, that this tool reflects only the market’s expectations at a specific point in time, which may change as new information and trading activity reshape implied volatility.

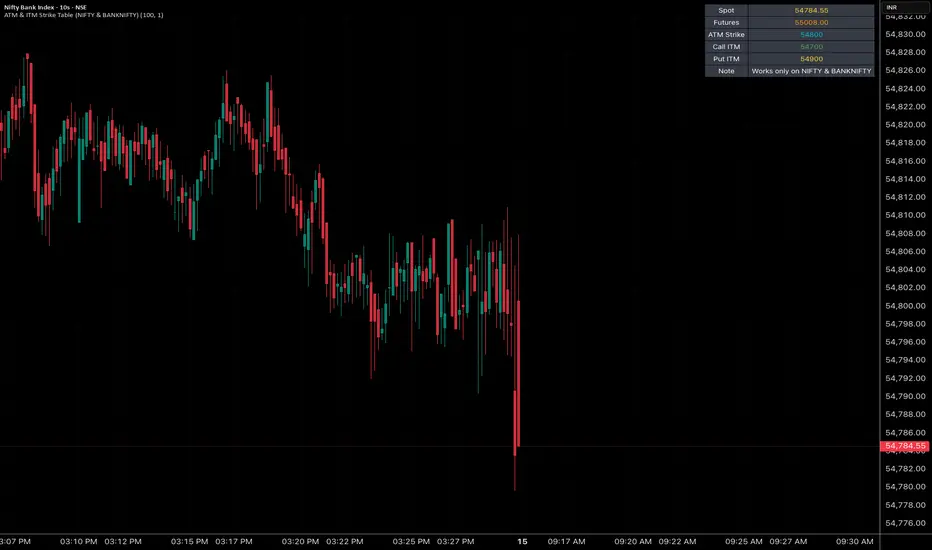
ATM & ITM Strike Table (NIFTY & BANKNIFTY)This script is like a cheat sheet for option traders.
When you put it on your chart, it shows you a small table with:
The current spot price (the real market price).
The futures price (another version of the same index that sometimes trades a bit higher or lower).
The ATM strike (the strike price closest to the market price).
Which call option and put option are “in the money” and most relevant right now.
A little note to remind you if you’re looking at the right chart.
In short:
It saves you from doing mental math every time by automatically pointing out the key option strike prices you should be aware of.
Multi Straddle-Strangle ChartThis powerful indicator is designed for options traders who want to visualize and track the combined premium of multiple straddle and strangle strategies in a single, dedicated pane.
Quickly analyze and compare up to five different options strategies at a glance, directly on your chart. This tool is perfect for monitoring volatility, tracking potential profits/losses on a position, and spotting key support and resistance levels based on option premiums.
Key Features:
Plot Up to 5 Strategies: Simultaneously plot any combination of up to 5 straddles or strangles.
Real-Time Data: Fetches live data for both Call and Put options to give you an up-to-the-second view of the combined price.
Dynamic Symbol Generation: Automatically detects the underlying symbol (e.g., NIFTY, BANKNIFTY, stocks) and builds the correct option symbols based on your input.
Customizable Inputs: Easily configure the expiry date, strike prices and line colors for each of the 5 lines.
In-Chart Summary Table: A clean and clear table in the corner of your chart provides a quick summary of each enabled strategy and its current price.
Important Note on Usage:
This tool requires you to input a strike price in all fields, even if you do not plan to use all five lines. This is necessary because of a fundamental rule in the Pine Script language: every input must have a constant, non-empty default value. The indicator is optimized to only fetch data for the lines you have explicitly enabled with the "Enable Line X" checkbox.

Tristan's Box: Pre-Market Range Breakout + RetestMarket Context:
This is designed for U.S. stocks, focusing on pre-market price action (4:00–9:30 AM ET) to identify key support/resistance levels before the regular session opens.
Built for 1 min and 5 min timelines, and is intended for day trading / scalping.
Core Idea:
Pre-market range (high/low) often acts as a magnet for price during regular hours.
The first breakout outside this range signals potential strong momentum in that direction.
Retest of the breakout level confirms whether the breakout is valid, avoiding false moves.
Step-by-Step Logic:
Pre-Market Range Identification:
Track high and low from 4:00–9:30 AM ET.
Draw a box spanning this range for visual reference and calculation.
Breakout Detection:
When the first candle closes above the pre-market high → long breakout.
When the first candle closes below the pre-market low → short breakout.
The first breakout candle is highlighted with a “YOLO” label for visual confirmation.
Retest Confirmation:
Identify the first candle whose wick touches the pre-market box (high touches top for short, low touches bottom for long).
Wait for the next candle: if it closes outside the box, it confirms the breakout.
Entry Execution:
Long entry: on the confirming candle after a wick-touch above the pre-market high.
Short entry: on the confirming candle after a wick-touch below the pre-market low.
Only the first valid entry per direction per day is taken.
Visuals & Alerts:
Box represents pre-market high/low.
Top/bottom box border lines show the pre-market high / low levels cleanly.
BUY/SELL markers are pinned to the confirming candle.
Added a "YOLO" marker on breakout candle.
Alert conditions trigger when a breakout is confirmed by the retest.
Strategy Type:
Momentum breakout strategy with confirmation retest.
Combines pre-market structure and risk-managed entries.
Designed to filter false breakouts by requiring confirmation on the candle after the wick-touch.
In short, it’s a pre-market breakout momentum strategy: it uses the pre-market high/low as reference, waits for a breakout, and then enters only after a confirmation retest, reducing the chance of entering on a false spike.
Always use good risk management.

Ajay Nayak - EMA ATR Trailinge strategy RSI aur RSI ke SMA ke crossover par CALL aur PUT signal generate karti hai.
Saath me ATR based stoploss aur crossover target bhi diya gaya hai.
Algo trading ke liye useful hai.

SESSIONS Golden Team SESSIONS — Multi-Session Forex Box & Range Analysis
This indicator displays the major Forex market sessions — London, New York, Tokyo, Sydney, and Frankfurt — directly on the chart. Each session is shown as a customizable colored box with optional Fibonacci levels and opening range markers.
It also calculates and displays the average pip range of each session over a user-defined number of past days, allowing traders to analyze volatility patterns for each trading period.
Key Features:
Configurable session times and time zones
Individual on/off toggle for each session
Custom colors, box transparency, and border styles
Optional Opening Range and Fibonacci retracement levels for each session
Average pip range table for quick volatility reference
Works on any intraday timeframe
How It Works:
The script identifies the start and end times of each session based on user settings.
A box is drawn around the high/low of the session period.
At the end of each session, the pip range is recorded, and an average is calculated over the last N sessions (default: 20).
The results are displayed in a statistics table showing average pips and whether the session is currently active.
Suggested Use:
Identify high-volatility sessions for breakout trading
Filter trades to active trading hours
Study historical volatility to refine entry timing

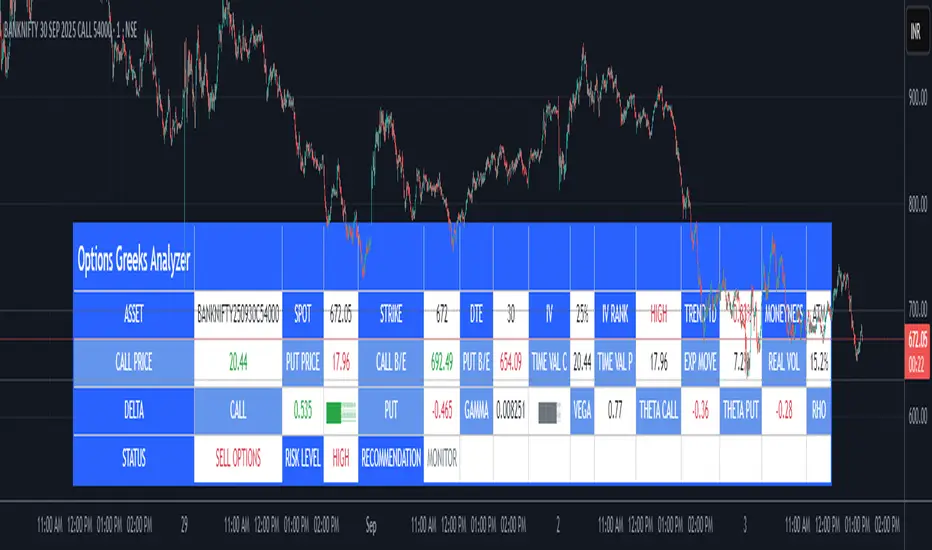
Options Greeks AnalyzerOptions Greeks Analyzer (Training & Learning Guide)
________________________________________
1. Introduction
Options trading is advanced compared to regular stock trading, and one of the most important aspects is Options Greeks. Greeks are mathematical values that measure how the price of an option will react to changes in various factors such as the underlying asset’s price, volatility, interest rates, and time to expiry.
This Options Greeks Analyzer tool is built using TradingView Pine Script v5. It serves as a real time training and analysis dashboard that helps learners visualize how options greeks behave, how option prices change, and how traders can make informed decisions.
📌 Educational Disclaimer:
This tool is only for training and learning purposes. It is not a financial advice tool nor to be used for live trading decisions. The data shown is theoretical Black Scholes model calculations, which may differ from actual option market prices.
________________________________________
2. How the Tool Works
The Options Greeks Analyzer is divided into different modules. Below is a step by step walkthrough:
________________________________________
Step 1: User Inputs
• Implied Volatility (IV%) — You can manually enter volatility, which is the most important factor in option pricing. Higher IV = higher option premium.
• Expiry Selection — Choose from preset durations like 7D, 14D, 30D etc. Days to expiry directly affect time decay (Theta).
• Strike Price Mode — You can select either:
o ATM (At-the-Money = Current price of stock/index)
o Custom strike (Enter your own strike price)
• Risk-Free Rate (%) — A small interest rate factor (like government bond yield) used for theoretical valuation.
• Table Customization — Choose table size, position, and whether to show price lines for easy visibility.
________________________________________
Step 2: Market Data & Volatility
• The tool takes the current market price (Spot Price) as input.
• It calculates realized volatility from historical price fluctuations (using past 30 bars/log returns).
• Implied Volatility (manual input) is then compared to realized vol:
o If IV > Historical Volatility → Market pricing is “expensive” (HIGH IV RANK).
o If IV < Historical Volatility → Market is “cheap” (LOW IV RANK).
o Otherwise, it’s MEDIUM.
📌 Why it matters?
Traders can decide whether buying or selling options is favorable. Beginners learn that timing entry with volatility is more critical than just looking at market direction.
________________________________________
Step 3: Black-Scholes Formula
The core engine uses the Black-Scholes model, a mathematical formula widely used to compute option fair prices.
It uses the following inputs:
• Current price (Spot)
• Strike Price
• Time to Expiry (T)
• Risk Free Rate (r)
• Implied Volatility (σ)
This produces:
• Call Option Price
• Put Option Price
📌 This teaches learners how premiums are derived theoretically and why the same strike can have different values depending on IV and time.
________________________________________
Step 4: Option Greeks Calculation
The tool computes the first order Greeks:
• Delta → Measures how much the option price changes when the underlying stock moves by 1 point.
(Call Delta ranges 0–1, Put Delta ranges -1 to 0).
• Gamma → Sensitivity of Delta to price change. A measure of volatility risk.
• Theta → Time decay. Shows how much value option loses as each day passes. Calls and Puts have negative Theta (decay).
• Vega → Measures how sensitive option price is to volatility changes.
• Rho → Interest rate sensitivity. Mostly minor in equity options but important for training.
📌 New traders learn how each factor impacts profits/losses. Instead of random guessing, they see mathematical impact in numbers.
________________________________________
Step 5: Dashboard & Visualization
The tool builds a professional dashboard table on the chart.
It shows categories such as:
1. Asset Info — Spot, Strike, DTE (days to expiry), IV%, IV Rank, 1-Day Trend, Moneyness (ATM/OTM/ITM).
2. Option Prices — Call, Put, Break-even levels, Time Value, Expected Move (%), Realized vs Implied Vol.
3. Greeks with Visual Progress Bars — Easily shows Delta, Gamma, Vega, Theta, Rho in intuitive graphical representations.
4. Status Bar — Suggests theoretical bias like:
o HIGH IV → Favor Option Selling
o LOW IV → Favor Option Buying
o MEDIUM → Neutral observation
5. Recommendation Line — Offers training-based suggestions like “Buy Straddles”, “Sell Call Spreads”, etc. These are not signals, but scenarios to learn strategies.
________________________________________
3. How It Helps Beginners
1. Learn Greeks in Action:
Beginners often memorize formulas but never see real-time changes. This dashboard updates every bar to show how Greeks change dynamically.
2. Compare Volatilities:
Traders understand difference between historical vs implied volatility and why option premiums behave differently.
3. Understand Risk Levels:
The tool highlights when Gamma risk is high (danger for sellers) or when Theta is most favorable.
4. Training Mode for Strategies:
Helps beginners experiment by changing IV, strike, expiry and seeing how straddles, spreads, naked options would behave theoretically.
5. Prepares Before Live Trading:
Safe environment to practice option analysis without risking capital.
________________________________________
4. Educational Use Cases
• Scenario 1: Change expiry from 7D to 30D — see how Theta becomes slower for longer expiries.
• Scenario 2: Increase IV from 25% to 80% — watch how option premiums inflate, and recommendation changes from “Buy” to “Sell”.
• Scenario 3: Select OTM vs ITM strikes — check how delta moves from near 0 to near 1.
By running these scenarios, learners understand why professional traders hedge Greeks instead of directional gambling.
________________________________________
5. Disclaimer
This Options Greeks Analyzer is built strictly for educational and training purposes.
• It uses theoretical formulas (Black-Scholes) that may not match actual option market prices.
• The recommendations are for learning strategy logic only, not real-world execution signals.
• Trading in options carries significant risks and may result in capital loss.
📌 Always consult with a financial advisor before applying real strategies.
________________________________________
✅ Summary
This Options Greeks Analyzer:
• Teaches how Greeks, IV, and premiums work.
• Provides a real-time interactive dashboard for training.
• Helps beginners practice option scenarios safely.
• Is meant strictly for learning and not live trading execution.
________________________________________
________________________________________
Disclaimer from aiTrendview
This script and its trading signals are provided for training and educational purposes only. They do not constitute financial advice or a guaranteed trading system. Trading involves substantial risk, and there is the potential to lose all invested capital. Users should perform their own analysis and consult with qualified financial professionals before making any trading decisions. aiTrendview disclaims any liability for losses incurred from using this code or trading based on its signals. Use this tool responsibly, and trade only with risk capital.
Support and Resistance levels from Options DataINTRODUCTION
This script is designed to visualize key support and resistance levels derived from options data on TradingView charts. It overlays lines, labels, and boxes to highlight levels such as Put Walls (gamma support), Call Walls (gamma resistance), Gamma Flip points, Vanna levels, and more.
These levels are intended to help traders identify potential areas of price magnetism, reversal, or breakout based on options market dynamics. All calculations and visualizations are based on user-provided data pasted into the input field, as Pine Script cannot directly fetch external options data due to platform limitations (explained below).
For convenience, my website allows users to interact with a bot that will generate the string for up to 30 tickers at once getting nearly real-time data on demand (data is cached for 15min). With the output string pasted into this indicator, it's a bliss to shuffle through your portfolio and see those levels for each ticker.
The script is open-source under TradingView's terms, allowing users to study, modify, and improve it. It draws inspiration from common options-derived metrics like gamma exposure and vanna, which are widely discussed in financial literature. No external code is copied without rights; all logic is original or based on standard mathematical formulas.
How the Options Levels Are Calculated
The levels displayed by this script are not computed within Pine Script itself—instead, they rely on pre-calculated values provided by the user (via a pasted data string). These values are derived from options chain data fetched from financial APIs (e.g., using libraries like yfinance in Python). Here's a step-by-step overview of how these levels are generally calculated externally before being input into the script:
Fetching Options Data:
Historical and current options chain data for a ticker (e.g., strikes, open interest, volume, implied volatility, expirations) is retrieved for near-term expirations (e.g., up to 90 days).
Current stock price is obtained from recent history.
Gamma Support (Put Wall) and Resistance (Call Wall):
Gamma Calculation: For each option, gamma (the rate of change of delta) is computed using the Black-Scholes formula:
gamma = N'(d1) / (S * sigma * sqrt(T))
where S is the stock price, K is the strike, T is time to expiration (in years), sigma is implied volatility, r is the risk-free rate (e.g., 0.0445), and N'(d1) is the normal probability density function.
Weighted gamma is multiplied by open interest and aggregated by strike.
The Put Wall is the strike below the current price with the highest weighted gamma from puts (acting as support).
The Call Wall is the strike above the current price with the highest weighted gamma from calls (acting as resistance).
Short-term versions focus on strikes closer to the money (e.g., within 10-15% of the price).
Gamma Flip Level:
Net dealer gamma exposure (GEX) is calculated across all strikes:
GEX = sum (gamma * OI * 100 * S^2 * sign * decay)
where sign is +1 for calls/-1 for puts, and decay is 1 / sqrt(T).
The flip point is the price where net GEX changes sign (from positive to negative or vice versa), interpolated between strikes.
Vanna Levels:
Vanna (sensitivity of delta to volatility) is calculated:
vanna = -N'(d1) * d2 / sigma
where d2 = d1 - sigma * sqrt(T).
Weighted by open interest, the highest positive and negative vanna strikes are identified.
Other Levels:
S1/R1: Significant strikes with high combined open interest and volume (80% OI + 20% volume), below/above price for support/resistance.
Implied Move: ATM implied volatility scaled by S * sigma * sqrt(d/365) (e.g., for 7 days).
Call/Put Ratio: Total call contracts divided by put contracts (OI + volume).
IV Percentage: Average ATM implied volatility.
Options Activity Level: Average contracts per unique strike, binned into levels (0-4).
Stop Loss: Dynamically set below the lowest support (e.g., Put Wall, Gamma Flip), adjusted by IV (tighter in low IV).
Fib Target: 1.618 extension from Put Wall to Call Wall range.
Previous day levels are stored for comparison (e.g., to detect Call Wall movement >2.5% for alerts).
Effect as Support and Resistance in Technical Trading
Options levels like gamma walls influence price action due to market maker hedging:
Put Wall (Gamma Support): High put gamma below price creates a "magnet" effect—market makers buy stock as price falls, providing support. Traders might look for bounces here as entry points for longs.
Call Wall (Gamma Resistance): High call gamma above price leads to selling pressure from hedging, acting as resistance. Rejections here could signal trims, sells or even shorts.
Gamma Flip: Where gamma exposure flips sign, often a volatility pivot—crossing it can accelerate moves (bullish above, bearish below).
Vanna Levels: Positive/negative vanna indicate volatility sensitivity; crosses may signal regime shifts.
Implied Move: Shows expected range; prices outside suggest overextension.
S1/R1 and Fib Target: Volume/OI clusters act as classic S/R; Fib extensions project upside targets post-breakout.
In trading, these are not guarantees—combine with TA (e.g., volume, trends). High activity levels imply stronger effects; low CP ratio suggests bearish sentiment. Alerts trigger on proximities/crosses for awareness, not advice.
Limitations of the TradingView Platform for Data Pulling
TradingView's Pine Script is sandboxed for security and performance:
No direct internet access or API calls (e.g., can't fetch yfinance data in-script).
Limited to chart data/symbol info; no real-time options chains.
Inputs are static per load; updates require manual pasting.
Caching isn't persistent across sessions.
This prevents dynamic data pulling, ensuring scripts remain lightweight but requiring external tools for fresh data.
Creative Solution for On-Demand Data Pulling
To overcome these limitations, users can use external tools or scripts (e.g., Python-based) to fetch and compute levels on demand. The tool processes tickers, generates a formatted string (e.g., "TICKER:level1,level2,...;TIMESTAMP:unix;"), and users paste it into the script's input. This keeps data fresh without violating platform rules, as computation happens off-platform. For example, run a local script to query APIs and output the string—adaptable for any ticker.
Script Functionality Breakdown
Inputs: Custom data string (parsed for levels/timestamp); toggles for short-term/previous/Vanna/stop loss; style options (colors, transparency).
Parsing: Extracts levels for the chart symbol; gets timestamp for "updated ago" display.
Drawing: Lines/labels for levels; boxes for gamma zones/implied move; clears old elements on updates.
Info Panel: Top-right summary with metrics (CP ratio, IV, distances, activity); emojis for quick status.
Alerts: Conditions for proximities, crosses, bounces (e.g., 0.5% bounce from Put Wall).
Performance: Uses vars for persistence; efficient for real-time.
This script is educational—test thoroughly. Not financial advice; past performance isn't indicative of future results. Feedback welcome via TradingView comments.

Shifa A+ (Lean tidy) — v1.5.1calls/puts indicator based on trend line, support based tp and resistance based sl
Momentum Signals – Real-time (Repainting)This indicator generates real-time BUY/SELL signals using a confluence of VWMA trend, 3-bar momentum, and volume, then filters them by a strength score.
⚠️ **WARNING:** This version **repaints**; signals can appear and disappear before the bar closes.

Momentum Signals – Real-time (Repainting)This indicator generates real-time BUY/SELL signals using a confluence of VWMA trend, 3-bar momentum, and volume, then filters them by a strength score.
⚠️ WARNING: This version repaints; signals can appear and disappear before the bar closes.

Fear & Greed Oscillator — LEAP Puts (v6, manual DMI/ADX)Fear & Greed Oscillator — LEAP Puts (v6, manual DMI/ADX) is a Puts-focused mirror of the Calls version, built to flag top risk and momentum rollovers for timing LEAP Put entries. It outputs a smoothed composite from −100 to +100 using slower MACD, manual DMI/ADX (Wilder), RSI and Stoch RSI extremes, OBV distribution vs. accumulation, and volume spike & direction, with optional Put/Call Ratio and IV Rank inputs. All thresholds, weights, and smoothing match the Calls script for 1:1 customization, and a component table shows what’s driving the score. Reading is simple: higher values = rising top-risk (red shading above “Top-Risk”); lower values = deep dip / bounce risk (green shading). Built-in alerts cover Top-Risk, Deep Dip, and zero-line crosses for clear, actionable cues.
LEAP Put Edge — Top Risk Oscillator (v6, divergences + HTF)Pinpoint market tops with precision — a composite oscillator built to spot exhaustion, bearish divergences, and high-probability LEAP Put entry zones.
The LEAP Put Edge — Top Risk Oscillator is designed specifically to help identify high-probability entry points for long-dated Put options (LEAPs) by highlighting exhaustion at market tops. Unlike generic overbought/oversold tools, it combines slower MACD and DMI/ADX for trend quality, RSI and Stochastic RSI for momentum extremes, volume spike and upper-wick exhaustion signals for capitulation risk, and optional bearish divergences in RSI and MACD to confirm weakening strength. The output is a smoothed composite score scaled from -100 to +100, where higher values indicate rising top-risk and bearish edge conditions. Clear thresholds, color-coded plots, and built-in alerts make it straightforward and practical for traders seeking simple, actionable signals to time Put entries with confidence.

Floating Dashboard + KDE (v6)Simple indicator that displays ADX, RSI, MACD, ATR, Average Volume and KDE with dynamic Table and Label.
