Open Interest Footprint IQ [TradingIQ]Hello Traders!
Th e Open Interest Footprint IQ indicator is an advanced visualization tool designed for cryptocurrency markets. It provides a granular, real-time breakdown of open interest changes across different price levels, allowing traders to see how aggressive market participation is distributed within each bar.
Unlike standard footprint charts that rely solely on volume, this indicator offers unique insights by focusing on the interaction between price action and changes in open interest (OI) — a leading metric often used to infer trader intent and positioning.
How it works
The Open Interest Footprint IQ processes lower timeframe price and open interest data to build a footprint-style chart that shows how traders are positioning themselves within each candle.
Here’s a breakdown of the process:
1. Granular OI & Price Sampling
The script retrieves lower-timeframe data (1-minute, 1-second, or 1-tick, based on your setting).
For each candle, it captures:
High and low prices
Price change direction
Change in open interest (OI)
2. Classifying Trader Behavior
For each lower-timeframe segment, the indicator determines the type of positioning occurring based on price movement and OI change:
If price is moving up and open interest is increasing, it suggests that long positions are being opened. This is considered a "Longs Opening" event, labeled as UU (Up/Up).
If price is moving up but open interest is decreasing, it indicates that short positions are being closed. This is referred to as UD (Up/Down), or "Shorts Closing."
If price is moving down and open interest is increasing, it signals that short positions are being opened. This is known as DU (Down/Up), or "Shorts Opening."
If price is moving down while open interest is also decreasing, it means that long positions are being closed. This is labeled as DD (Down/Down), or "Longs Closing."
These are stored in separate arrays and displayed at specific price levels.
It is particularly useful for identifying:
Where longs or shorts are opening/closing positions
Stacked imbalances (indicative of potential absorption or exhaustion)
Value area zones and POC (Point of Control) based on OI, not volume
This footprint runs on your choice of sub-bar granularity and is ideal for high-frequency trading, scalping, and entries based on order flow dynamics.
Key Features
Footprint Visualization
At each price level within a candle:
Long/short opening and closing behavior is broken down.
Delta (net open interest change) is displayed both numerically and color-coded.
Optional gradient coloring shows intensity and type of flow (longs/shorts opened/closed).
Cumulative or per-bar reset modes allow you to track OI evolution over time.
The image above explains the information that each Footprint box shows across a candlestick!
Each footprint box shows:
OI Delta
OI Delta %
Longs Opened (LO)
Longs Closed (LC)
Shorts Opened (SO)
Shorts Closed (SC)
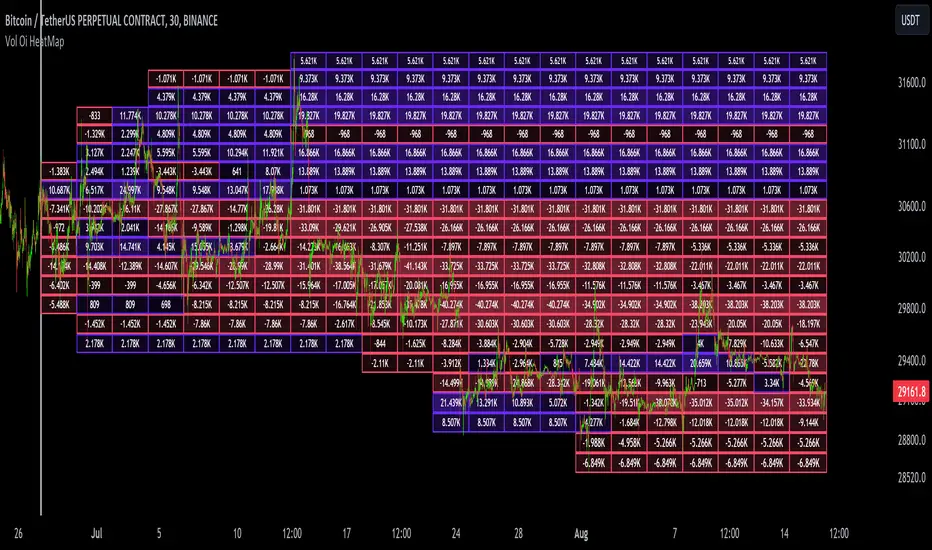
The image above explains the color-coding feature of the indicator.
Boxes are color coded to show which position action
dominated at the price area.
For this example:
Green boxes = Long positions being opened dominated
Purple boxes = Long positions being closed dominated
Red boxes = Short positions being opened dominated
Yellow boxes = Short positions being closed dominated
All colors are customizable.
Additionally, for traders who are only interested in whether OI increased/decreased, a "two-color" option is available in the settings.
For the two-color option, footprint boxes can be one of two colors. Showing whether OI increased or decreased at the level.
Cumulative Levels
Open Interest Footprint IQ contains a "Cumulative Levels" feature that tracks/stores open interest change at tick levels over time, rather than resetting per bar.
With the "Cumulative Levels" feature enabled, traders can see open interest changes persist across all candlesticks. This feature is useful for determining whether longs opening, longs closing, shorts opening, or shorts closing are dominating at particular price areas over time rather than on a single bar.
A useful feature to see if shorts/longs are favoring certain price throughout the day, week, month, etc.
Input Settings Explained
Granularity (Dropdown: Granularity)
Options: 1-Minute, 1-Second, 1-Tick
Determines how finely the script samples the lower timeframe data to construct the footprint.
For precision:
1-Tick = Highest accuracy, but more resource-intensive.
1-Second/1-Minute = Suitable for broader or more zoomed-out analysis.
Tick Level Distance (Tick Level Distance (0 = Auto))
Defines the vertical spacing between levels in the footprint chart.
If 0, the script uses an automatic calculation based on ATR to adapt to volatility.
Set a manual value (e.g., 5) to control the height granularity of each level in ticks.
Cumulative Levels (Toggle)
If enabled, the footprint builds cumulatively over time, rather than resetting per candle.
Use case: Visualize ongoing buildup of OI activity across a session or day.
Cumulative Levels Reset TF (Timeframe)
Sets the reset interval for the cumulative view (e.g., reset daily, hourly, etc.)
Works only when Cumulative Levels is enabled.
Delta Box Display Settings
Show Delta Percentage
Toggles the display of the percentage change in OI across the footprint level.
Helpful to gauge how aggressive positioning is relative to total OI at that level.
Show Longs/Shorts (Opened/Closed)
Show Longs Opened: Displays OI increase in up candles (price ↑, OI ↑).
Show Longs Closed: Displays OI decrease in down candles (price ↓, OI ↓).
Show Shorts Opened: OI increase in down candles (price ↓, OI ↑).
Show Shorts Closed: OI decrease in up candles (price ↑, OI ↓).
These behaviors are color-coded to give traders instant context:
Blue-green for longs opening.
Purple for longs closing.
Red for shorts opening.
Yellow for shorts closing.
Value Area & POC
Value Area % (Value Area %)
Controls how much cumulative open interest is used to define the value area.
Example: 70% means the smallest range of prices that contains 70% of total OI in that bar will be marked.
Helps identify zones of interest, support/resistance, and institutional levels.
The image above explains how to identify the VAH/VAL/POC shown by Open Interest Footprint IQ.
VAH = Upper 🞂
POC = ●
VAL = Lower 🞂
Imbalances
Imbalance Percentage
Defines the minimum delta % required at a level to be marked as an imbalance.
If the net open interest change at a level exceeds this threshold, a visual marker appears.
Stacked Imbalance Count
If the number of consecutive imbalance levels meets this count, a “Stacked Imbalance” alert will trigger.
This can signal aggressive buying or selling pressure, potential breakout zones, or institutional absorption.
Color Settings
Longs Opened / Closed, Shorts Opened / Closed
Customize the color palette for each order flow behavior.
These colors appear in the background gradient of the footprint boxes.
Up/Down Only Mode
Toggle to override all behavior-based colors with a single Up Color and Down Color.
Useful if you prefer a simple bull/bear view.
Up Color / Down Color
If "Up/Down Only" is enabled, these two colors are used to represent all net positive or negative deltas.
Special Notes
Crypto only: This script works only with crypto tickers on TradingView.
For other assets (stocks, futures), a warning message will appear instead.
OI data must be available from the exchange (many perpetual pairs support this).
If the footprint is too small or invisible, increase your tick level spacing in the settings.
Alerts
When a stacked imbalance is detected, an alert is fired ("Stacked Imbalance").
This feature is useful for automated systems, bots, or simply staying informed of potential trade setups.
And that's all for now!
If you have any questions or features you'd like to see feel free to share them in the comments below!
Thank you traders!
Openinterestdelta
Open Interest Inflows & Outflows [LuxAlgo]The Open Interest Inflows & Outflows indicator focuses on highlighting alterations in the overall count of active contracts associated with a specific financial instrument.
The indicator also includes an oscillator highlighting the price sentiment to use in conjunction with the open interest flow sentiment and also includes a rolling correlation of the open interest flow sentiment with a user-selected source.
🔶 USAGE
Open Interest (OI) indicates the total number of active contracts, encompassing both long and short positions, for a specific financial instrument at any given moment. This key indicator helps traders and analysts assess market activity and sentiment.
An increase in open interest generally indicates new money flowing into the market, suggesting increased activity and the potential for a trending market. Conversely, a decrease in open interest indicates that traders are closing their positions, suggesting less interest in that particular contract.
Open Interest Flow Sentiment assesses the correlation between the initiation of new positions (inflows) and the closure of existing positions (outflows) for a particular instrument. Positive values suggest a prevalence of inflows, while negative values signify a prevalence of outflows.
The magnitude of the deviation from zero reflects the extent of dominance, either in inflows or outflows.
Price Sentiment estimates the relationship between the strength of bulls (buyers) and bears (sellers) on an instrument. Positive values indicate higher bull power and negative values indicate higher bear power.
The correlation feature is a key component of the indicator and helps analyze the relationship between trading volume and Open Interest changes. If volume increases along with rising Open Interest, it supports the validity of the price trend.
A divergence between price movement, volume, and Open Interest may signal potential reversals.
🔶 DETAILS
This indicator, based on Dr. Alexander Elder's acclaimed Elder-Ray concept, aids traders in evaluating the strength of both bulls and bears by delving beneath the surface of the markets. It uncovers data not immediately apparent from a superficial glance at prices. The indicator comprises two components: Bull Power and Bear Power.
Considering that the high price of any candle signifies the maximum power of buyers and the low price represents the maximum power of sellers, Elder employs the 13-period Exponential Moving Average (EMA) to depict the average consensus of price value. Bull Power assesses whether buyers can drive prices above the average consensus of value, while Bear Power assesses whether sellers can push prices below this average.
Here are the formulas for Bull Power and Bear Power:
bull_power = high - ema(close, 13)
bear_power = low - ema(close, 13)
This concept is utilized to calculate Open Interest Flow Sentiment and Price Sentiment. The Open Interest Flow Sentiment estimates the relationship between new positions (inflows) and positions being closed (outflows), providing insights into market dynamics. The Price Sentiment, on the other hand, gauges the correlation between price movements and the Elder-Ray components, aiding traders in identifying potential shifts in market sentiment and momentum.
🔶 SETTINGS
🔹Open Interest Inflows & Outflows
OI Sentiment Correlation: toggles the visibility of Open Interest correlation with a variety of sources.
Money Flow Estimates: toggles the visibility of Money Flow Estimates calculated for the last bar.
🔹Style
OI Flow Sentiment: toggles the visibility of Open Interest Flow Sentiment, along with color customization options.
Price Sentiment: toggles the visibility of Price Sentiment, along with color customization options.
Correlation Colors: color customization option for the Correlation Area.
🔹Others
Smoothing: smoothing length applicable for Open Interest Flow Sentiment and Price Sentiment.
🔶 RELATED SCRIPTS
Open-Interest-Chart
Liquidation-Estimates
Thanks to our community for recommending this script. For more conceptual scripts and related content, we welcome you to explore by visiting >>> LuxAlgo-Scripts .
OI Visible Range Ladder [Kioseff Trading]Hello!
This Script “OI Visible Range Ladder” calculates open interest profiles for the visible range alongside an OI ladder for the visible period!
Features
OI Profile Anchored to Visible Range
OI Ladder Anchored to Visible Range
Standard POC and Value Area Lines, in Addition to Separated POCs and Value Area Lines for each category of OI x Price
Configurable Value Area Targets
Curved Profiles
Up to 9999 Profile Rows per Visible Range
Stylistic Options for Profiles
Up to 9999 volume profile levels (Price levels) can be calculated for each profile, thanks to the new polyline feature, allowing for less aggregation / more precision of open interest at price.
The image above shows primary functionality!
Green profiles = Up OI / Up Price
Yellow profiles = Down OI / Up Price
Purple profiles = Up OI / Down Price
Red profiles = Down OI / Down Price
The image above shows POCs for each OI x Price category!
Profiles can be anchored on the left side for a more traditional look.
The indicator is robust enough to calculate on “small price periods”, or for a price period spanning your entire chart fully zoomed out!
That’s about it :D
This indicator is Part of a series titled “Bull vs. Bear” - a suite of profile-like indicators.
Thanks for checking this out!
If you have any suggestions please feel free to share!
Zig-Zag Open Interest Footprint [Kioseff Trading]Hello!
This script "Zig Zag Open Interest Footprint" calculates open interest x price values for zig zag trends!
Features
Open interest footprints anchored to zig zag trends
Summed OI x price level footprints
Total OI (for each category) for the entire trend shown
Standard POC lines, in addition to separated POC lines for each category of open interest x price possibility
Up to 9999 profile rows per zigzag trend
Stylistic options for profiles
Configurable zig zag - footprints generated for small to large trends
The zigzag indicator is configurable as normal; minor and major trend volume footprints are calculable. This indicator can be thought of as "Open Interest Footprint for Trends''.
Up to 9999 open interest levels (price levels) can be calculated for each profile, thanks to the new polyline feature, allowing for less aggregation / more precision of open interest at price.
Zig Zag OI Footprints
The image above shows primary functionality!
Green = Higher OI + Higher Price
Yellow = Lower OI + Higher Price
Purple = Higher OI + Lower Price
Red = Lower OI + Lower Price
Profiles are generated for each trend identified by the zigzag indicator.
The image above shows the indicator calculating open interest x price for specific price blocks on the footprint. Aggregate open interest for the identified trend is displayed over the profile!
Neon highlighted values correspond to the highest open interest change for the category. This is a configurable option :D
The image above shows POC lines for each category of open interest x price!
Additionally, you can select to show a single POV for footprint - the single level the greatest amount of OI change occurred.
The indicator is robust enough to calculate on "long zig zags" and "short zig zags"; curved profiles can also be used!
The image above shows key levels, each OI footprint, and summed OI values for the current trend!
That's about it :D
This indicator is part of a series titled "Bull vs. Bear" - a suite of profile-like indicators I will be releasing over the coming days. Thanks for checking this out!
If you have any suggestions please feel free to share!
Dynamic Liquidity Map [Kioseff Trading]Hello!
Just a quick/fun project here: "Dynamic Heatmap".
This script draws a volume delta or open interest delta heatmap for the asset on your chart.
The adjective "Dynamic" is used for two reasons (:
1: Self-Adjusting Lower Timeframe Data
The script requests ~10 lower timeframe volume and open interest data sets.
When using the fixed range feature the script will, beginning at the start time, check the ~10 requested lower timeframes to see which of the lower timeframes has available data.
The script will always use the lowest timeframe available during the calculation period. As time continues, the script will continue to check if new lower timeframe data (lower than the currently used lowest timeframe) is available. This process repeats until bar time is close enough to the current time that 1-minute data can be retrieved.
The image above exemplifies the process.
Incrementally lower timeframe data will be used as it becomes available.
1: Fixed range capabilities
The script features a "fixed range" tool, where you can manually set a start time (or drag & drop a bar on the chart) to determine the interval the heatmap covers.
From the start date, the script will calculate the calculate the sub-intervals necessary to draw a rows x columns heatmap. Consequently, setting the start time further back will draw a heat map with larger rows x columns, whereas, a start time closer to the current bar time will draw a more "precise" heatmap with smaller rows x columns.
Additionally, the heatmap can be calculated using open interest data.
The image above shows the heatmap displaying open interest delta.
The image above shows alternative settings for the heatmap.
Delta values have been hidden alongside grid border colors. These settings can be replicated to achieve a more "traditional" feel for the heatmap.
Thanks for checking this out!
Open interest flow / quantifytools- Overview
Open interest flow detects inflows (positions opening) and outflows (positions closing) using open interest and estimates delta (net buyers/sellers) for the flows. Users are able to choose any open interest source available on Tradingview, by default set to BTCUSDT OI fetched from Binance. Using historical open interest flows, bands depicting typical magnitude of flows are formed for benchmarking intensity of flows. On the inflow side, +1 represents average inflows while +2 represents 2x above average inflows, a level considered an extreme. In a vice versa manner, -1 represents average outflows while -2 represents 2x above average outflows. Extreme inflows indicate aggressive position opening, in other words exuberance. Extreme outflows on the other hand indicate forced exiting of positions, in other words liquidations.
- Concept
Open interest flow is calculated using position of OI source relative to its moving average (by default set to SMA 10), referred to as relative open interest from hereon. When relative OI is positive (open interest is above its moving average), new positions are considered to enter the market. When relative OI is negative (open interest is below its moving average), existing positions are considered to exit the market. Open interest delta (side opening/closing positions, either net buyers/sellers) is calculated using relative price in a similar fashion to relative OI, but using close of viewed symbol as source. Price is considered to be up when relative price is positive, down when relative price is negative. Using relative OI and relative price in tandem, the following assumptions are applied:
Price up, open interest up = longs entering market
Price down, open interest up = shorts entering market
Price down, open interest down = longs exiting market
Price up, open interest down = shorts exiting market
Bands depicting magnitude of open interest flows are calculated using average turning points in relative OI. +1 and -1 represent levels where flows on average turn towards mean rather than continue to increase/decrease. These levels are then multiplied up to +2 and -2, representing two times larger deviations from the normal. When inflows are above 1, positions opening have reached a point where flows historically turn down. Therefore, anything above 1 would be abnormal amount of open interest entering, an extreme stretch being at 2 or above. Same logic applies to outflows, but in a vice versa manner (below -1 abnormal, extreme at -2)
Flow bursts further refine indications of aggressive inflows/outflows by taking into account change in open interest flows. Burst indications are activated when open interest is above its average turning point, coupled with a sufficient increase/decrease in flows simultaneously. Bursts are essentially a filtered version of abnormal flows and therefore a more reliable indication of exuberance/liquidations. Burst sensitivity can be adjusted via input menu, available in 5 settings. 1 sets OI burst requirements to loosest (more signals, more noise) while 5 sets OI burst requirements to strictest (less signals, less noise). Exact criteria applied to bursts can be viewed via input menu tooltip.
- Features
Users can opt for OI source auto-select for CRYPTO/USDT pairs. When auto-select is enabled and another chart is opened, corresponding open interest source is automatically selected as long as requirements mentioned above are met.
Open interest flows can be visualized as chart color, available separately for flow states and flow bursts.
Relative price line and flow guidelines (reminders for flow interpretation) can be enabled via input menu. All colors are customizable.
- Alerts
Available alerts are the following:
- Abnormal long inflows/outflows
- Abnormal short inflows/outflows
- Abnormal inflows/outflows from either side
- Aggressive longs/shorts (flow burst up)
- Liquidated longs/shorts (flow burst down)
- Aggressive or liquidated longs/shorts
- Practical guide
Open interest as a standalone data point does not reveal which side is likely opening/exiting positions and how extreme the participant behavior is. Using the additional data provided by open interest flows, moments of greed and fear can be detected. Smart money does not short into dips and buy into rips. When buyers or sellers have participated in a large move and continue to show interest even when efforts are not rewarded at an already overextended price, participants are asking for trouble.
Similar events can be observed when extreme outflows take place, indicating forced exits such as stop-losses triggering. When enough participants are forced out, price is likely to take the path of least resistance which is to the opposite direction.
Volume Profile Volume Delta OI Delta [Kioseff Trading]Hello!
This script serves to distinguish volume delta for any asset and open interest delta for Binance perpetual futures.
The image above provides further explanation of functionality and color correspondence.
The image above shows the indicator calculating volume at each tick level and displaying the metric.
The label color outline (neon effect) is configurable; the image above is absent the feature.
The image above shows Open Interest (OI) Delta calculated - similar to how the script calculates volume delta - for a Binance Perpetual Future pair.
This feature only works for Binance Futures pairs; the script will not load when trying to calculate OI Delta on other assets.
Additionally, a heatmap is displayable should you configure the indicator to calculate it.
The image above shows a heatmap using volume delta calculations.
The image above shows a heatmap using OI delta calculations.
Of course, these calculations - when absent requisite data - require some assumptions to better replicate calculations with access to requisite data.
The indicator assumes a 60/40 split when a tick level is traded at and only one metric - "buy volume" or "sell volume" is recorded. This means there shouldn't be any levels recorded where "buy volume" is greater than 0 and "sell volume" equals 0 and vice versa. While this assumption was performed arbitrarily, it may help better replicate volume delta and OI delta calculations seen on other charting platforms.
This option is configurable; you can select to have the script not assume a 60/40 split and instead record volume "as is" at the corresponding tick level.
The script also divides volume and open interest if a one-minute bar violates multiple tick levels. The volume or open interest generated on the one-minute bar will be divided by the number of tick levels it exceeds. The results are, subsequently, appended to the violated tick levels.
Further, the script can be set to recalculate after a user-defined time threshold is exceeded. You can also define the percentage or tick distance between levels.
Also, it'd be great if this indicator can nicely replicate volume delta indicators on other charting platforms. If you've any ideas on how price action can be used to better assume volume at the corresponding price area please let me know!
Thank you (:
Open Interest Delta with MAs[Binance Perpetuals]!!!!! This indicator only shows Binance Perpetuals Open Interest Delta !!!!!
!!!!! When Binance Spot pair charts is selected, It still shows the perpetual contract Open Interest, if the pair on the chart is tradeble on perpetual contracts. I assume you know what Open Interest is. !!!!!
ZLEMA , Tillson, VAR MAs codes are coming from @KivancOzbilgic => SuperTrended Moving Averages
KAMA code is coming from @HPOTTER => Kaufman Moving Average Adaptive ( KAMA )