Heavy Weight Stocks for Bank NiftyHeavy Weight Stocks for Bank Nifty
Stocks which are part of Bank Nifty are displayed in the table.
If the %Change > 1 then bold green
If the %Change <1 and >0, then light green
If the %Change < -1 then bold red
If the %Change > -1 and <0 then light green
NSE:BANKNIFTY
NSE:HDFCBANK
NSE:ICICIBANK
NSE:AXISBANK
NSE:KOTAKBANK
NSE:SBIN
NSE:NIFTY
NSE:RELIANCE
NSE:HDFC
NIFTY

TradeWithAB Signal IndicatorThis indicator specifically designed for Momentum trading by an Intraday trader on index( Nifty , BankNifty ) and Equity stocks. This indicator works with DMI and PRICE ACTIONS which gives automated Buy and Sell signals along with Stop loss and Trailing Stop loss when certain criteria are met. It is not a Holy Grail system that gives you continuous profits and it has some limited downfalls also which can be controlled by proper risk Management and position sizing. This is a premium invite only indicator which can be use after given access to you by us. There are some guidelines on how to use this indicator which are given below and you have to follow these guidelines very strictly to get the maximum results.
Guidelines :-
1. Timeframe - 5 min
2. Period should be changed on daily basis(if required) for index trading.
3. Period value would be basically derived from IND VIX value (closest integer) divided by 2.
Ex 1. If the VIX value is 23.56, then it will be consider as 24. So the period value will be 24/2= 12.
Ex 2. If the VIX value is 23.10, then it will be considered as 24. So the period value will be 24/2= 12.
Ex 3. If the VIX value is 22.88, then it will be considered as 22. So the period value will be 22/2= 11.
4. Period value should be fixed at 20 for equity stocks.
5. DO NOT take any SWING or POSITIONAL trade with this indicator.
6. You have to take almost all the trade generated by this indicator on a particular stock/index for better results.
7. Signal confirmation is required for enter the trade as it will give you maximum profits.
8. GREEN TRIANGLE is represented as BUY Signal whereas RED TRIANGLE is represented as SELL Signal.
9. GREEN ARROW is considered as BUY TRAILING STOP LOSS as well as BUY RE-ENTRY for some scenarios.
10. RED ARROW is considered as SELL TRAILING STOP LOSS and SELL RE-ENTRY for some scenarios.
11. You have to avoid entering a trade on a round level zone. Eg- Banknifty 37000,35500,40000 etc etc.
BUY Trade Management :-
1. Trade should be initiated if and only if there is a buy signal(Green Triangle) is generated with confirmation of its respective indices (Recent candle of respective index should be similar to the signal candle).
*in case of BankNifty , Nifty will be its respective index and vice-versa.
2. You should only enter the trade at the CLOSE of the signal generated candle.
3. Your Stop loss should be placed at the LOW of the signal generated candle.
4. There is a trailing Stop loss signal (Green Arrow) after the buying signal is generated.
5. You should trail your Stop loss at the LOW of the trailing Stop loss signal generated candle.
6. You should trail your Stop loss repeatedly until your trailing Stop loss got hit and hence Exit your buy trade.
7. After Exiting the trade you have always option to re-enter at the next trailing Stop loss signal(green arrow) generated candle CLOSE and put your Stop loss at LOW of that candle and repeat the same trailing stop loss procedures.
SELL Trade Management :-
1. Trade should be initiated if and only if there is a sell signal(Red Triangle) is generated with confirmation of its respective indices (Recent candle of respective index should be similar to the signal candle).
*in case of BankNifty , Nifty will be its respective index and vice-versa.
2. You should only enter the trade at the CLOSE of the signal generated candle.
3. Your Stop loss should be placed at the HIGH of the signal generated candle.
4. There is a trailing Stop loss signal (Red Arrow) after the selling signal is generated.
5. You should trail your Stop loss at the HIGH of the trailing Stop loss signal generated candle.
6. You should trail your Stop loss repeatedly until your trailing Stop loss got hit and hence Exit your sell trade.
7. After Exiting the trade you have always option to re-enter at the next trailing Stop loss signal(red arrow) generated candle CLOSE and put your Stop loss at HIGH of that candle and repeat the same trailing stop loss procedures.
Disclaimer :-
*I am not a SEBI Registered Analyst and shall not be liable for any profit, loss or liability resulting, directly or indirectly from the use and results of the indicator. This is not a Holy Grail setup, sometimes the traders hit Stop loss and sometimes it gives amazing results as well.
Instructions to access to this invite-only script:-
*Send us a message if you wish to gain access to this indicator. The subscribers will get benefits of any future development or updates in the current script without any extra charges. Other trading style like swing and positional trading will also available in future updates.

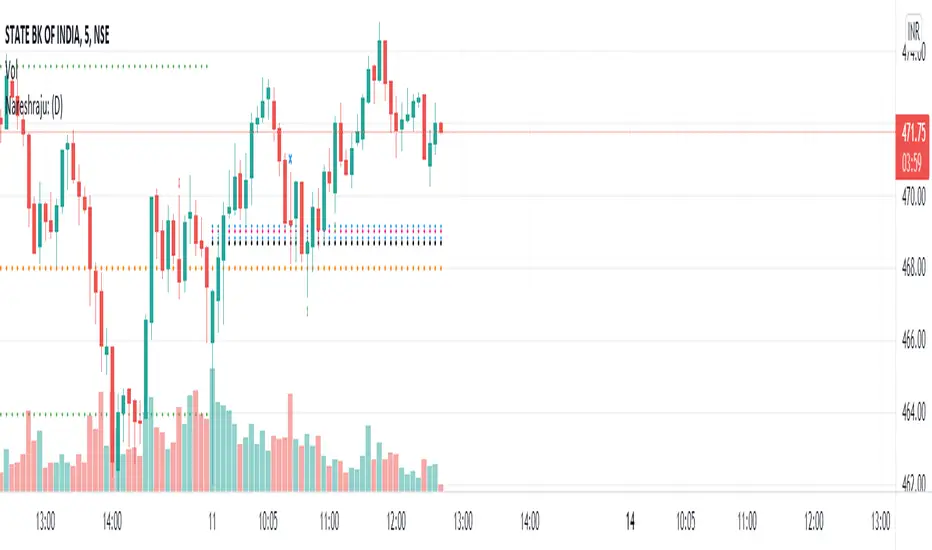
Nareshraju CPRHi friends this is Cpr indicator which means central pivot range. it contains supports and resistances to take perfect entry.
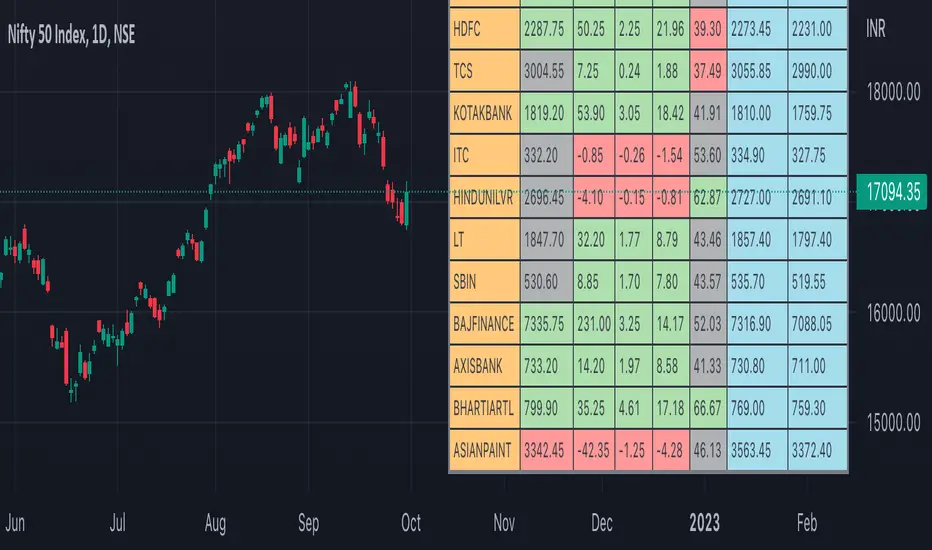
Nifty / Banknifty Dashboard by RiTzNifty / Banknifty Dashboard :
Shows Values of different Indicators on current Timeframe for the selected Index & it's main constituents according to weightage in index.
customized for Nifty & Banknifty (You can customize it according to your needs for the markets/indexes you trade in)
Interpretation :-
VWAP : if LTP is trading above VWAP then Bullish else if LTP is trading below VWAP then Bearish.
ST(21,1) : if LTP is trading above Supertrend (21,1) then Bullish , else if LTP is trading below Supertrend (21,1) then Bearish.
ST(14,2) : if LTP is trading above Supertrend (14,2) then Bullish , else if LTP is trading below Supertrend (14,2) then Bearish.
ST(10,3) : if LTP is trading above Supertrend (10,3) then Bullish , else if LTP is trading below Supertrend (10,3) then Bearish.
RSI(14) : Shows value of RSI (14) for the current timeframe.
ADX : if ADX is > 75 and DI+ > DI- then "Bullish ++".
if ADX is < 75 but >50 and DI+ > DI- then "Bullish +".
if ADX is < 50 but > 25 and DI+ > DI- then "Bullish".
if ADX is above 75 and DI- > DI+ then "Bearish ++".
if ADX is < 75 but > 50 and DI- > DI+ then "Bearish+".
if ADX is < 50 but > 25 and DI- > DI+ then "Bearish".
if ADX is < 25 then "Neutral".
MACD : if MACD line is above Signal Line then "Bullish", else if MACD line is below Signal Line then "Bearish".
PDH-PDL : "< PDH > PDL" means LTP is trading between Previous Days High(PDH) & Previous Days Low(PDL) which indicates Rangebound-ness.
"> PDH" means LTP is trading above Previous Days High(PDH) which indicates Bullish-ness.
"< PDL" means LTP is trading below Previous Days Low(PDL) which indicates Bearish-ness.
Alligator : If Lips > Teeth > Jaw then Bullish.
If Lips < Teeth < Jaw then Bearish.
If Lips > Teeth and Teeth < Jaw then Neutral/Sleeping.
If Lips < Teeth and Teeth > Jaw then Neutral/Sleeping.
Settings :
Style settings :-
Dashboard Location: Location of the dashboard on the chart
Dashboard Size: Size of the dashboard on the chart
Bullish Cell Color: Select the color of cell whose value is showing Bullish-ness.
Bearish Cell Color: Select the color of cell whose value is showing Bearish-ness.
Neutral Cell Color: Select the color of cell whose value is showing Rangebound-ness.
Cell Transparency: Select Transparency of cell.
Columns Settings :-
You can select which Indicators values should be displayed/hidden.
Rows Settings :-
You can select which Stocks/Symbols values should be displayed/hidden.
Symbol Settings :-
Here you can select the Index & Stocks/Symbols
Dashboard for Index : select Nifty/Banknifty
if you select Nifty then Nifty spot, Nifty current Futures and the stocks with most weightage in Nifty index will be displayed on the Dashboard/Table.
if you select Banknifty then Banknifty spot, Banknifty current Futures and the stocks with most weightage in Banknifty index will be displayed on the Dashboard/Table.
You can Customise it according to your needs, you can choose any Symbols you want to use.
Note :- This is inspired from "RankDelta" by AsitPati and "Nifty and Bank Nifty Dashboard v2" by cvsk123 (Both these scripts are closed source!)
I'm not a pro Developer/Coder , so if there are any mistakes or any suggestions for improvements in the code then do let me know!

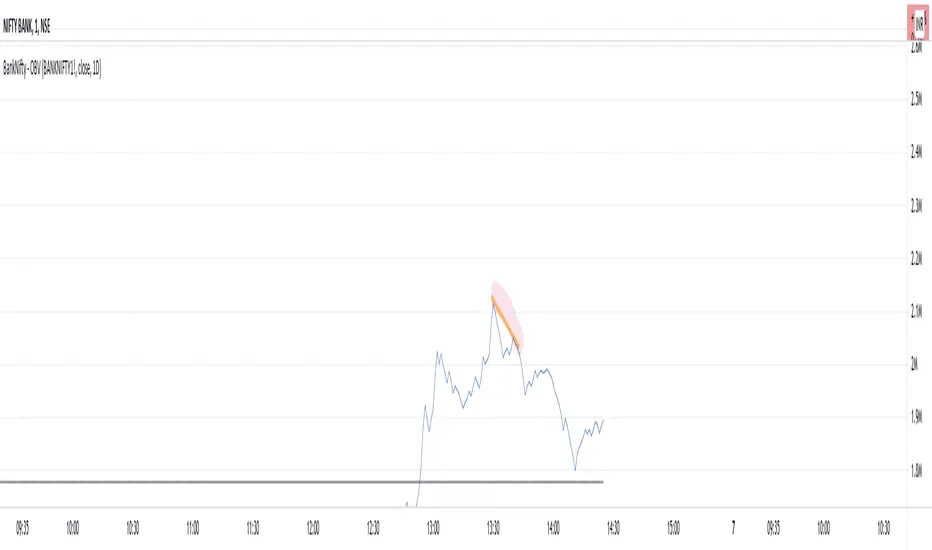
BankNifty - OBVThis script tries to draw OBV for BankNifty using Futures Volume along with Average OBV. For Nifty50 just change the Futures Volume symbol in settings. Look at devations in Price vs OBV or Average OBV breakout.
NSE:NIFTY
NSE:BANKNIFTY
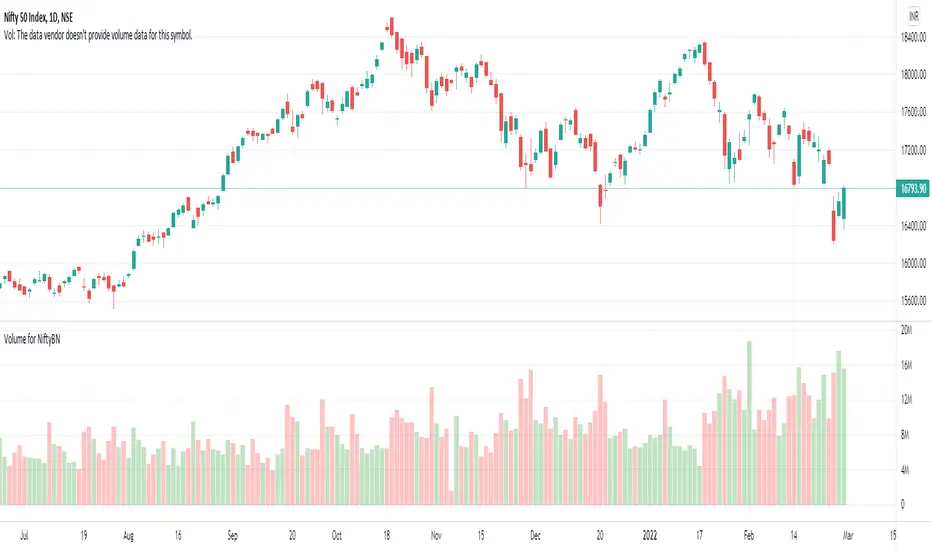
Volume for NiftyBNTo see the volume of Nifty and Banknifty indices we often refer to their Futures chart. With the help of this script, you can directly plot the volume of Nifty Futures over the Nifty chart and Bank Nifty Futures over the Bank Nifty chart.
If the scrip entered is other than Nifty or Bank Nifty it will plot the default volume of that scrip.
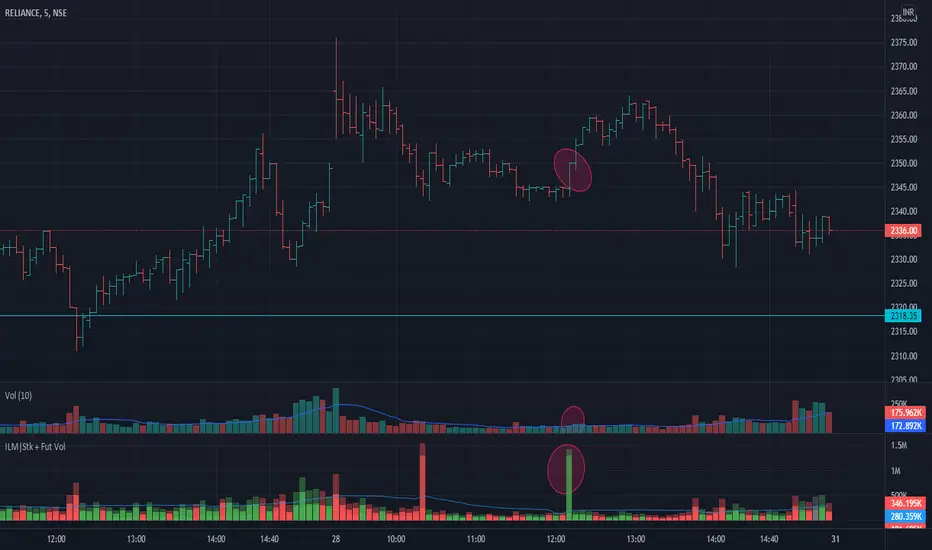
Volume Indicator NSE + BSE + Future Current & Next MonthThis indicator combines all the volumes from both the NSE & BSE exchanges as well as Future volumes ( Current Month & Next Month) if the symbol is available in FnO
Indicator shows 3 volumes
Total Volume = NSE + BSE + Current Month + Next Month
Stock Volume = NSE + BSE
Future volume = Current Month + Next Month
Benefits
As shown in the chart above, price shot up as the volume appeared in BSE but not NSE. These conditions can be caught easily and right decisions can be made
Since Future volumes are also combined, it gives an accurate picture of volumes on any given instrument during last of week of monthly expiries when contract rollovers happen
BANKNIFTY Expiry Price v1.0This indicator will predict the BankNifty Expiry price for the last 30 min.
Use this indicator on a 1 min chart on BankNifty index as shown above. The orange line is the predicted price.
BankNifty closing price is calculated based on the Weighted Average Price of its constituents in the last 30 min and will vary from the actual index price.
Last 30 min on expiry day is very volatile in Banknifty and option premiums are mis-priced due to the underlying moves.
This indicator helps in estimating the actual Banknifty weighted avg closing price.
The weights of the constituents need to be updated constantly on a weekly basis to keep the error rate to minimum.
The prediction is normally off by +/- 10 points to the actual closing price.

Nifty50 Participants - Top 25Nifty50 Index is calculated based on the movements of its participants. Every time you think of why is Index going up/down, who is actively dragging the index either ways, this Indicator gives you answer for the same in realtime!
This indicator will help you in pre-planning your trades based on the movements shown by different stocks of various sectors in Index calculation.
RSI column is an add-on to the participation table which will help you in getting RSI values of different stocks of Nifty 50 at a glance. You will see values getting updated in realtime in live market.
Checkout for customisations in indicator settings.
Note:
1. Participants present in this indicator and their participation percentage is taken from the official NSE website.
2. Table shows Top 25 participants by default. If you want to see less than 25 rows, you can update the input via indicator settings.
Feel free to contribute/comment changes if any! Comment in case of any suggestions :)
- Published by Soham Dixit
Nifty and Bank Nifty Dashboard V2This shows a performance glance of Dow and major Constituents of NSE:NIFTY or NSE:BANKNIFTY . This is an enhancement to the Bank nifty dashboard published earlier.
Usage
• Customizable Table and Style settings
• Customizable Indicator Settings
• Customizable Time frame of Indicators in Table. Can change to higher or lower TF other than the chart time frame
• Customizable Input symbols. Can modify with the Scripts you want to track.
• The Last row will be the current script viewed in charts.
• Can enable or disable indicators on the chart like ST, SMA, VWAP.
• Strong Volume Indication at bottom based on the average volume inputs for Nifty, Bank Nifty and for other stocks volume > 20 ma(volume)
• Displays bank nifty stocks if Bank nifty is the open chart else it will display top Nifty Stocks.
• This will help to monitor the performance of various scripts.
• Can change the stock list according to usage/Index.
• It will show all the symbols if Additional Symbols is selected.
Buy-Sell Signal
• Volume > Average Volume, it Shows #
• ST – Buy - Price > Super trend (10,2) and vice versa
• SMA – Buy - Price > MA and vice versa
• RSI – Buy – RSI > 50, Sell – RSI < 40
• ADX: Buy - ADX > 25, DMI+ Above DMI - and vice versa
• Previous day High low is not considered for buy or sell score calculation. This is just for additional observation.
• ATR will be highlighted when change > 0.75 of the average true range of daily price.
Strong colours will be shown for respective boxes when some additional conditions satisfy.
Style settings
Dashboard Location: Location of the dashboard on the chart
Dashboard Size: The size of the dashboard on the chart
Text/Frame Color: Determines the colour of the frame grid as well as the text colour
Bullish Cell Color: Determines the colour of cell associated with a rising indicator direction
Bearish Cell Color: Determines the colour of cell associated with a decreasing indicator direction
Cell Transparency: Transparency of each cell

TEWY - Magic Strength Indicator (SI)Detail about this indicator
1. This indicator is used to identify the trend based on the momentum of the counter selected.
2. This indicator is calculated three different metrics for selected script and it's Parent/Main Index as NSE:NIFTY (default) and Sector Index. Keep in mind below point
a) Parent/Main index is set to default NSE:NIFTY, though there is option to provide your own custom parent index e.g. US30, US 100'
B) Sector Index is identified automatically for set to predefined stocks and rest ate set to default NIFTY 500. Again you have option to change it to your preference
3. I have used the rate of change and RSI of it to calculate momentum for script, it's parent index and sector index.
4. I would typically use this indicator to see momentum on the Monthly and Weekly first and daily timeframe to get proper entry.
5. Also please try to stay in the long position only unless you understand the consequences for shorting a stock . why? because the imminent nature of the market is to go upward only.
6. Please try to keep base inputs as defaults, though it allows you to change input parameters
Let's understand this indicator
• On the tor right corner you would see three different numbers. 1st number is SI of the underlying Ticker. 2nd number is SI for the Sector Index and 3rd is for Parent Index SI.
• If selected ticker is outperforming it's parent index the you see one green "▲" and if ticker is also outperforming it's sector index then you would see two green "▲▲". Same on the downside.
• I would only take long position if selected ticker is at least outperforming Parent index, that means at least one green "▲".
• I would take exit from the position if I see no more green "▲".
Always respect RISKS and follow stop loss. In market stop loss is the only friend of yours.
I have given a sample illustrational image below, which should help you understand this indicator.
Best of luck

Bank Nifty ParticipantsBankNifty Index is calculated based on the movements of its participants. Every time you think of why is Index going up/down, who is actively dragging the index either ways, this Indicator gives you the answer for the same in realtime!
For example : You see HDFCBank and Kotak Bank significantly up while all other banks going down but index reacting in a bullish mode, the answer lies in which Bank is contributing how much to the index! This will help you in pre-planning your trades based on the movements shown by different banks in Index calculation. Or on the other hand, you see HDFCBank on verge of breakout and you have target of 10 points, this indicator will help you in identifying how much the index will react to the 10 points movement shown by HDFC Bank which is the leading participant in Bank Nifty.
RSI column is an add-on to the participation table which will help you in getting RSI values of different banks at a glance. You will see values getting updated in realtime in live market. Checkout for customisations in indicator settings.
Note : Participants present in this indicator and their participation percentage is taken from the official NSE website.
Feel free to contribute/comment changes if any!
- Published by Soham Dixit

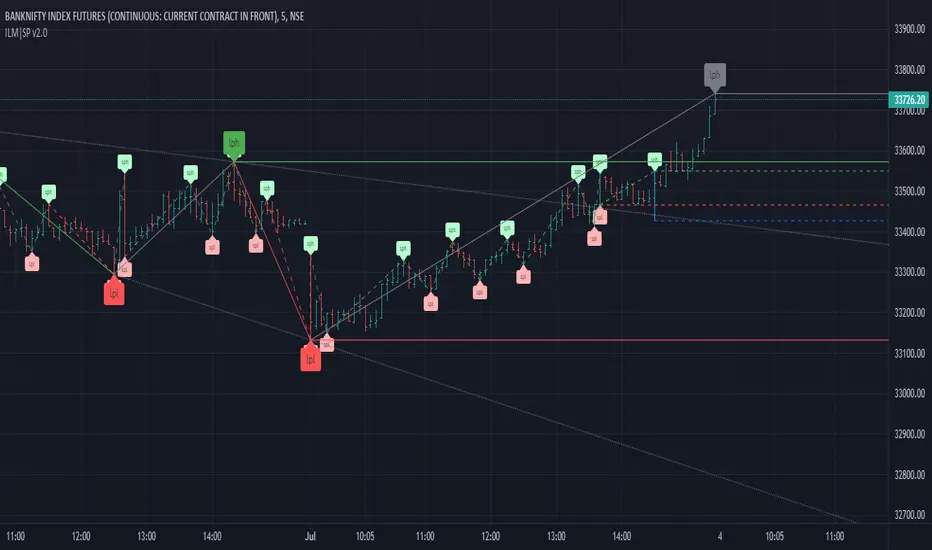
ILM | Structural Pivots v1This script will mark the structural pivots based on some rules.
Solid green/red lines are for major trend to mark LPH (Large Pivot High) and LPL (Large Pivot Low).
Dotted green/red lines are for minor trend SPH (Small Pivot High) and SPL (Small Pivot Low). SPH and SPL are not marked as labels to reduce congestion on the chart.
Gray lines are to identify temporary large pivots before they get promoted to LPH / LPL
Blue lines are to identify temporary small pivots before they get promoted to SPH / SPL
Couple of common trading strategies
- Go Long above LPH
- Go Short below LPL
- Go Long above SPH after LPH
- Go Short below SPL after LPL
Mean Reversion
- Go Long above SPH after LPL
- Go Short below SPL after LPH
This is the initial version and I am making it as public beta to iron out any issues. I might make this script private in future - FYI
TEWY - Breadth Based Bar ColorNSE:BANKNIFTY1!
⚠ Important: Before going into details of this script, in order to best use this indicator it is VERY VERY important to make some changes to the chart settings as mentioned below.
• REMOVE CANDLE BORDERS from Symbol settings
• CHANGE WICK COLOR to white/black/gray based on the chart theme you use, from Symbol settings
Make sure you have these settings done.
Detail about this indicator
1. This indicator is used to identify the trend based on the momentum of the counter selected.
2. This indicator is calculated differently for indices NSE:NIFTY and NSE:BANKNIFTY. As I take high weightage stock under these indices to get overall indices momentum.
3. I have used the rate of change and RSI of it to calculate momentum.
4. I would typically use this indicator to see momentum on the Monthly and Weekly first and daily timeframe to get proper entry.
5. Also please try to stay in the long position more than the short position as we all know that, the imminent nature of the market is to go upward only.
6. Please try to keep base inputs as defaults, though it allows you to change input parameters like changing the length of momentum indicator or bar color options. Below is the description of each input
• Smoothen: It changes source from CLOSE to OHLC4.
• Signal Length: It's the length(no of candles) for which the momentum is calculated. Like for RSI the default period/length is 14 or for Moving Average indicator default period/length is 9, I simply use 20 as the default length
• Timeframe: If you want to calculate momentum based on the momentum of different time frames.
• Change bar Color: Use the toggle to change the color of the bar. You can uncheck it so that no bar color is changed if you need so
• Set Bar Color Dynamically: With this even though the oscillator is in opposite direction to the trend it takes the candle close into consideration and sets bar color accordingly.
Always respect RISKS and follow stop loss.
Let's understand how to take a position using this indicator
• Long position:-
• If the latest candle color is GREEN and its preceding candle color is RED, then go long in the counter with the strict stop loss(SL) 1% below the preceding RED colored candle.
• Once you are in a long position, trail stop loss(SL) below each red candle you see on the chart.
• Exit strictly if initial SL or trailing SL is hit. And re-create long positions once you see the next green candle.
• Short Position:-
• If the latest candle color is RED and its preceding candle color is GREEN, then go short IF RED COLORED CANDLE LOW IS TAKEN OUT. Exit short once you see a green colored candle.
• Exit strictly if you see a GREEN-colored candle and create a long position.
If you are really interested and need access to this indicator please DM me.
I have given a sample illustrational image below, which should help you understand this indicator.
Best of luck

Fibonaci Opening Range Candle
Fibonacci Opening Range it is 50% and 0.61% of 5 min or 30min or 1 hour opening candle
search buying opportunities below 0.61
and selling opportunities above 0.50
Also acts as good support and resistance in intraday
BEST RESULTS IN INDEXES
Thanks & Best Regards
Marella Ganesh

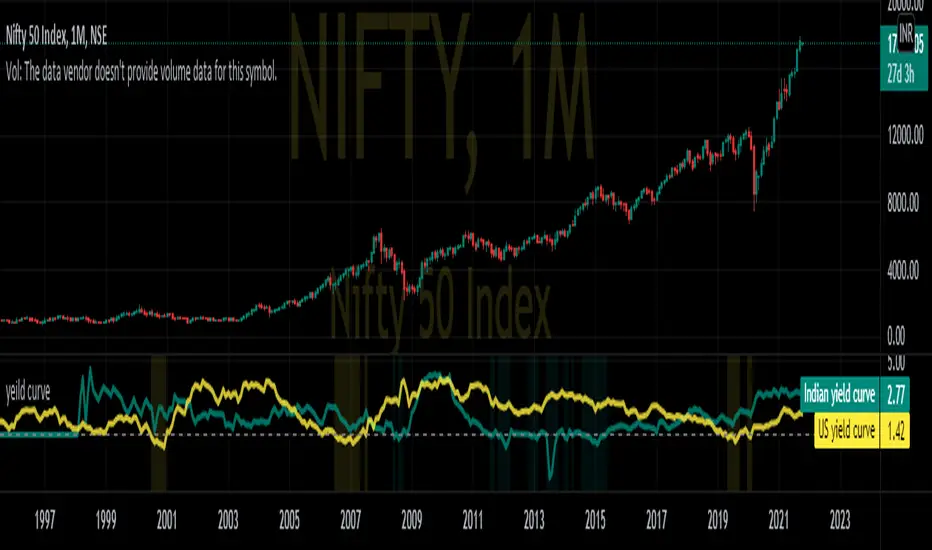
Nifty yield curveREAL-CASE SCENARIO:-
IN10Y(10yr yield t- bill) are govt. backed bonds provide basic interest or coupon rate. If the coupon rate falls below (yield =(1/price) the coupon rates of 3 month bond IN03MY(3m yield t- bill), investors are pessimistic about future growth of the economy.
This pessimistic behavior can be seen in the graph when change in background color.
While optimistic behavior scenario when investors no longer interested in long-term bonds and dumping 10Y T-bills causing yields to raise above short term 3m T-bill .
QuantAnna: Nifty VIX CorrelationNSE:NIFTY
Simple correlation indicator which oscillates around zero
Shows default correlation with NSE:IndiaVix
You can use it to check correlation with any other trading symbol or indices by simply selecting it in the settings.

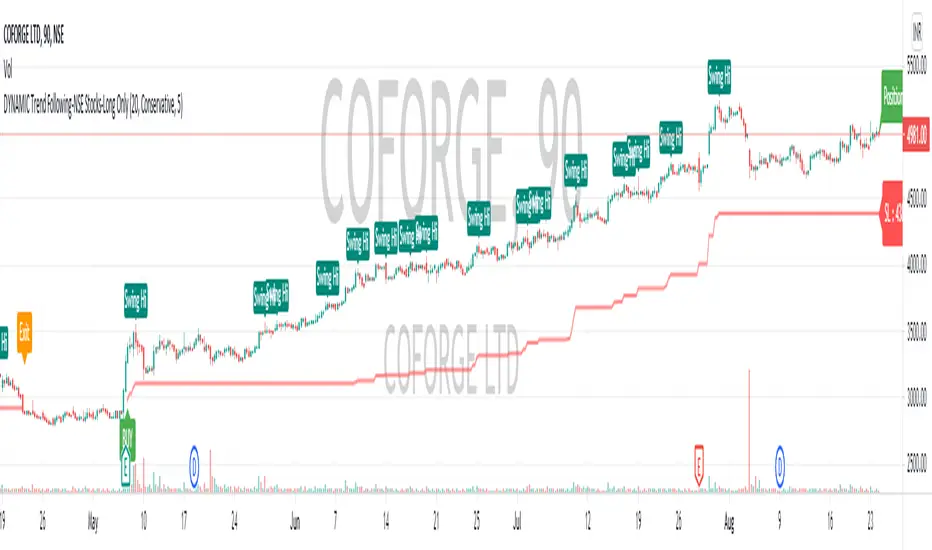
DYNAMIC Trend Following-NSE Stocks-Long OnlyMotivation
The momentum feature is well known and researched in the market. Momentum trades/signals often result in out sized positive returns when trades go well in their favor. At the same time, almost all momentum methods/signals suffer from frequent, small and multiple losses.
Dynamic indicator/system is a proprietary systematic method designed to capture momentum on Indian Indices of NIFTY and BANKNIFTY . It aims to identify bullish / bearish patterns in a systematic manner and uses volatility adjusted entry levels and trailing points. The method employs a proprietary method to filter out market noise from an underlying trend to ensure whipsaws arising from a trend-following method are removed. These patterns can be found in several well known books such as those of LA Little and Market Wizards series. We have combined well known existing patterns into a proprietary pattern that improves the performance. It is similar to combining Moving Average and RSI to get confirmations into a single system.
The current indicator is a Long-Only investment strategy for NSE(INDIA) Stocks.
Trade Usage
The indicator can be used either as a standalone indicator/method or can be used as an additional confirmation to your stock analysis. If you have a knack of picking stocks or if you deploy any other system to pick stocks, this can add systematic entry and exits to your Stock Analysis.
Time Frame
This indicator can work best if you use a bit of Multi-Time Frame analysis. Depending on your expected holding period, here are a few suggestions:
Investing - Holding period of a few Weeks to Months - Use Daily Charts and 2-Hr Charts
Swing Trading - Holding period of a few Days to Weeks - Use 90-Minute Charts and 30-Minute Charts
You can use any other time frame combinations that may suit your style.
Elements of the indicator
BUY - They depict the BUY Signal at the open of that bar.
Scale-In (Optional) - If your risk appetite permits, you can potentially scale-in at these times. These are signals which come only when a prior Buy signal is on.
Stop Loss - Anytime the system generates a Buy Signal, it will also generate an initial SL level. This SL level is updated at close of each bar and adapts to volatility and trend in the market.
Customizable Parameters
Here are a few things that can be customized:
Input Parameters:
Volatility Lookback - The lookback period that affects the trailing SL and entry exit signals. Default value is 20 Bars, but you may want to edit on the basis of your time frame.
Risk Mode - This comes with three options - Conservative, Moderate, Aggressive. It is a good idea to Enter Positions on Conservative Mode and then trail it on Moderate. Aggressive should rarely be used.
Colors - All labels and plots on the chart can be customized for colors. Look under 'Style' settings.
How to obtain access?
Please PM the publisher of script to request access or refer to details in signature below.
Banknifty & Nifty50 ScalperWhy this indicator?
There are full time traders who watch their screens during live market and make good amount of money by actively managing their positions.
There are full time employees also who want to trade but can not do so because they can not monitor their active positions while they are at job.
This indicator helps you execute your trades through third party platforms by generating Buy/Sell messages in a broker-compliant format.
You just need to "Enter Your API Key” in indicator settings and the indicator will generate pop-up messages which can be captured with Google Chrome extension and passed on to your third party platform for execution.
How this indicator works?
The indicator generates trades with 03 type of formulas:
1. It calculates Zeta Force values for Bank Nifty & Nifty based upon our proprietary formula. On reaching certain threshold limits, these values trigger Buy/Sell signals.
2. It calculates 5 type of moving averages along with change in volume and deviation from mean price and when the threshold limit set is crossed, Buy/Sell signals are generated.
3. On 1 min. Time frame, it generates scalping trades when there is sudden spurt in price and volume.
Additionally, indicator also generates automatic Support/Resistance lines based upon pivot points + behaviour of price at certain levels (whether price repeatedly bounces off or sails through a certain area).
What are other features of the indicator
A label displayed at the last bar gives you following information:
(a) Value of India VIX
(b) jump in India VIX (compared to yesterday’s close)
(c) Zeta Fore value (current candle)
(d) V+ and V- which stand for number of bank nifty stocks trading above or below their respective VWAP
(e) Zeta TP, an oscillator whose value varies from -100 to +100
On what stocks or Indices it can be used?
As described above, it specifically tracks volume and price of Bank Nifty & Nifty50 (Indian indices). Hence, it is suitable for both these indices and should not be used on anything else.
Also, when this indicator formulae were back-tested using a strategy, 5 min and 15 min time frames produced best-results.
Support/Resistance lines and over-sold, over-bought indication can be used together to exit your open positions.

IPB_MA_Market_Breadth_NIFTYThis is a very powerful index to guage the market breadth of an index.
By default it is configured for the top 18 stocks of Nifty.
This indicator calculates the momentum (RSI) of the no. of stocks above and below MA difference.
Divergence of shorter momentum with price gives reversal caution.
Crossing of shorter momentum over / under longer momentum provides a bullish stance / bearish stance.
It also has a MACD of no. the stocks above and below MA difference.
As usual it is better to use this indicator along with other indicators.

IPB_MA_MARKET_BREADTH (MAMB)This is a powerful indicator to guage the strength of the market.
1) By default it plots the momentum of the number of stocks in Bank Nifty that are above 20 period MA. You can change the MA number if you desire.
2) It also has other features like plotting the above along with the weights allocated in index / MACD of the number of stocks above and below index / cumulative raw index with respect to number of stocks above / below MA.
3) You can use it to other indices as well but can add only 12 stocks participating in any index.
How to use it?
If you see the price moving up (down) but the index (Item no. 1 above) falling (rising), it indicates higher chance of reversal.
If shorter momentum crosses longer momentum from below, it usually signals bullish and vice versa.
As always use this indicator in tandem with other indicators.

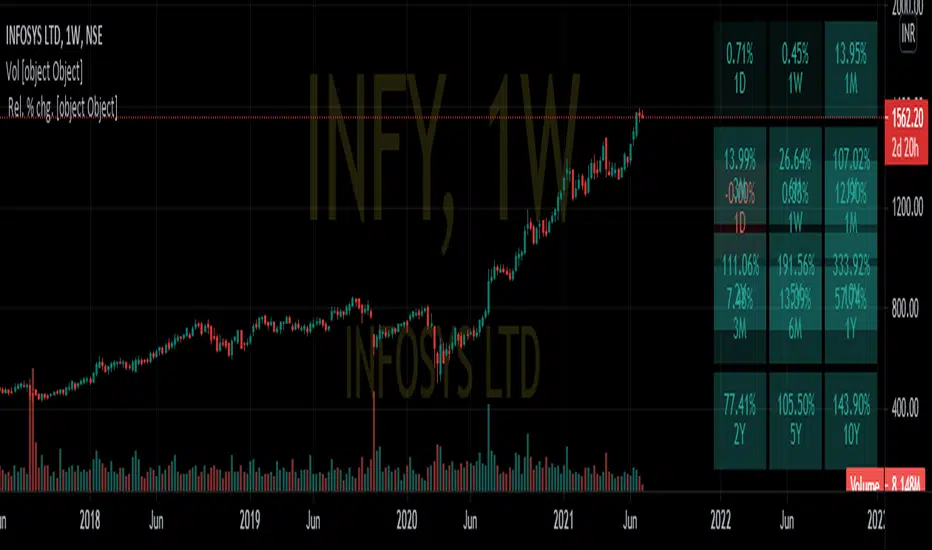
Nifty Relative PerformanceDISCRIPTION:-
This indicator is used to determine relative performance of a stock based on different time intervals as well as compared to benchmark indices as Nifty 50,Nift IT, Nifty auto etc.
USE CASE SCENARIO:-
The top right table provide performance of stock based on different interval
while the bottom table depicts its relative performance compared to an index
eg:-
INFY compared to Nifty 50
&
INFY compared to Nifty IT
DISCLAIMER:-
if using an android device kindly toggle full-screen mode and view it horizontally
In desktop full screen mode may provide better comprehensive view
BankNifty - VWAP + StdDev Bands- By Default the script draws Daily VWAP for Bank Nifty based on Futures Volume or underlying Index Stocks based on user input
- Optionally one may Anchor it to Week/Month etc or anchor it from a particular Time.
- It also draws 3 Standard Deviation Bands from the VWAP based on User Input.
- Optionally draws Previous VWAP Close for and Bullish or Bearish Move.
- It works with NIFTY 50 as well but only using Futures Volume(Pine limitation to number of security calls) . Please change the Symbol and Futures Volume symbol to "NSE:NIFTY" and "NSE:NIFTY1!" NSE:BANKNIFTY NSE:NIFTY
