Nifty VolumeWhy this Script : Nifty 50 does not provide volume and some time it is really useful to understand the volume .
This is the pine script which calculate the nifty 50 volume .
Logic :
Take each stock contribute to nifty 50 and find it's volume .
Multiply the same with contribution percentage of the same on Nifty 50
Add up all of them and find the total volume .
There is a similar script by @daytraderph which is built for Bank Nifty (custom volume) . I took the same and built for Nfity.
Nifty has 50 stocks and you cant call security method more than 40 times from one Pine script, so this is the limitation of this script. It consider top 40 stocks and find the volume (which contribute pretty much around 95% of the volume) and convert the same to 100 %
NIFTY
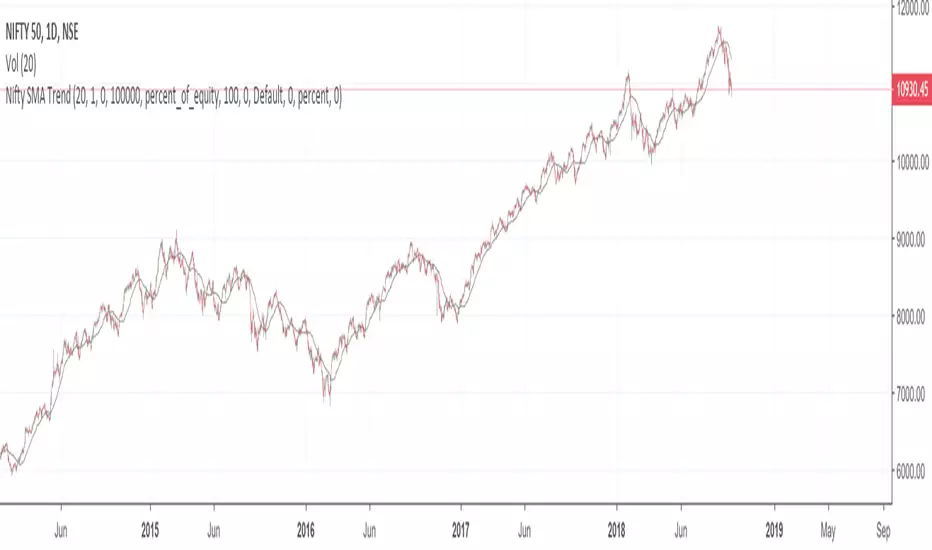
SIMPLE MOVING AVG 10,20,50,100,200 with RESOLUTIONThis indicator is the best than all other sma indicators.Because in just one click you can change all the resolution /time frames for all the sma .
Multitime frame analysis can be done in just one click. just change the resolution to
15 min/30 min/1hr- if you intraday trader
1D- LONG TERM INVESTORS.
Multi-timeframe analysis (MTF) is a process in which traders can view the same ticker/indicator using a higher time frame than the chart’s, for example, displaying a daily moving average on a one-hour chart in just two clicks.
How to Use this to Buy Stocks ?
The technical indicator known as the Death cross occurs when the 50-day SMA crosses below the 200-day SMA => Bearish Signal.
An opposite indicator, known as the Golden cross, occurs when the 50-day SMA crosses above the 200-day SMA => Bullish Signal.
Crossovers are one of the main moving average strategies.
1st Strategy is the first type is a price crossover, which is when the price crosses above the sma => Buy signal
when the price crosses below the sma => Sell signal
2nd Strategy is to apply two moving averages to a chart: one longer and one shorter.
When the shorter-term MA (100) crosses above the longer-term MA (200), it's a buy signal, indicates trend is shifting up.
This is known as a "Golden cross."
Meanwhile, when the shorter-term MA (100) crosses below the longer-term MA (200), it's a sell signal, indicates trend is shifting down.
This is known as a "Dead/death cross."
The time frame or length you choose for a moving average, also called the "look back period," can play a big role in how effective it is.
An MA with a short time frame will react much quicker to price changes than an MA with a long look back period. In the figure below, the 20-day moving average more closely tracks the actual price than the 100-day moving average does.
A 20-day MA = more beneficial to a shorter-term trader, since it follows the price more closely.
A 100-day MA = more beneficial to a longer-term trader.
Moving averages work quite well in strong trending conditions but poorly in choppy or ranging conditions.
use this indicator along with Price action theory and not alone.
Moving average crossovers are a popular strategy for both entries and exits. MAs can also highlight areas of potential support or resistance
Happy Trading

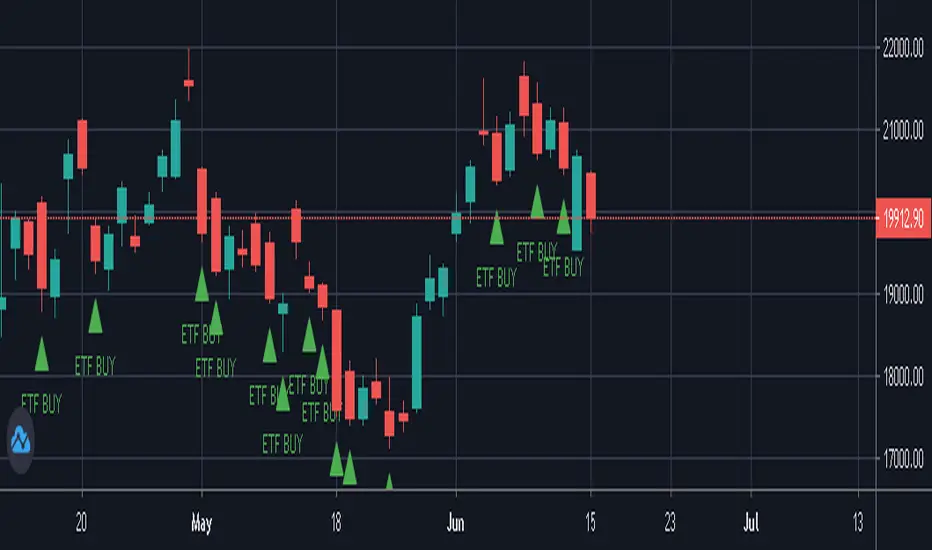
NIFTY / BANKNIFTY ETF SIP NOTIFIERNIFTY / BANKNIFTY - ETF SIP NOTIFIER
STUDY concept -
- As a market investor, one cannot time the market.
- Specailly, working professionals and job holders don't have time for market tracking.
- The idea of the script is - When Nifty closes below 2% previous day high, market has corrected and it's available at a discount w.r.t. previous day
- One can then invest in NIFTY / BANKNIFTY via ETF option on same or next day.
- If you like this idea, Save this script and add alert condition of this script in NIFTY / BANKNIFTY chart.
- One can get notification on TradingView mobile app or via email when the criteria is met.
- Logic can be applied to investing in INDEXES , NIFTY, BANKNIFTY.
Logic may be improved later.
NOTE - Investing is a serious and risky business. Profit / Loss from this investing idea is sole responsibility of the investor. This script is for education and learning purpose.
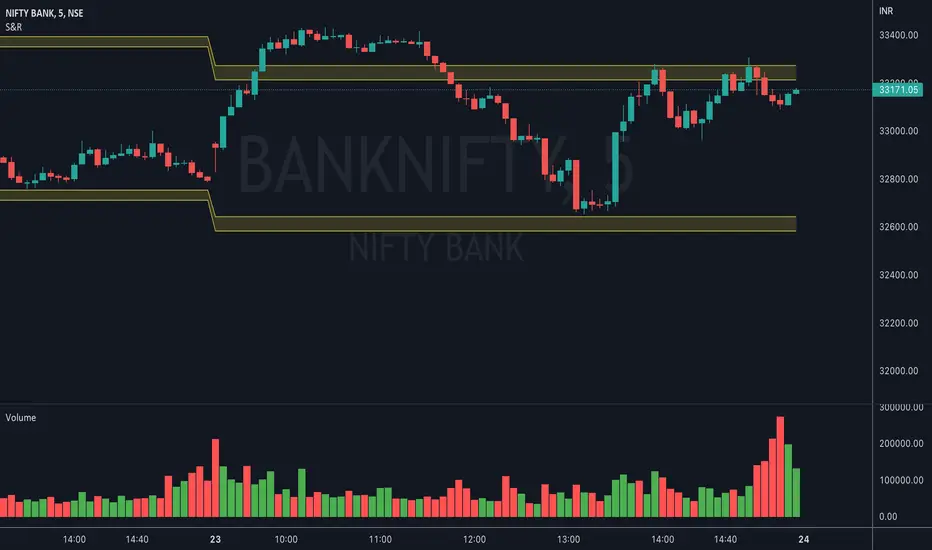
BNF VWAP & MAThe script picks up Bank nifty stocks with their current respective weights and plots a Volume Weighted Average Price ( VWAP ) line along with 2 EMAs of your choice and an alert when the EMAs cross over and also when price crosses VWAP .
You can customize the script for MA type and lengths and to remove alert. Basic utility of the script is to analyse volumes driving the Bank Nifty index.
Credits to @daytraderph and his script (Custom Volume ) who's code I used to build this script. Also thanks to my friend @Varun who helped me code it.

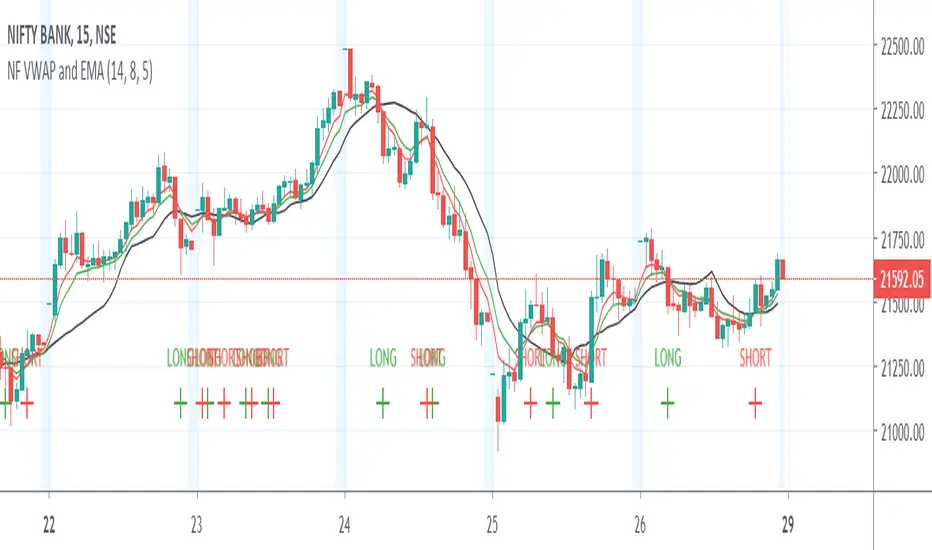
Nifty Volume profile + VWAP + EMA The script picks up nifty stocks with their current respective weights and plots a Volume Weighted Average Price line along with 2 EMAs and an alert when the EMAs cross over.
You can customize the script for EMA lengths and to remove alert. Basic utility of the script is to analyse volumes driving the Nifty 50 index.
Credits to @daytraderph and his script (Custom Volume) who's code I used to build this script. Also thanks to my friend @Varun who helped me code it.
RVC-Weekly-Pivots-GANN-LevelsPurpose:
Weekly - Fibonacci pivot levels and Gann levels calculation and marking on Chart automatically.
Mainly expected to use for trading on NIFTY and BankNifty
Kindly share your comments and suggestions to improve

DeltaMause it for identifing trend of nifty and banknifty, green for long red for short. below 0 must sell ...

Price Action + Bollinger Strategy Simple Price Action + Bollinger Band Strategy
Buy Setup --------
- Price closes below Bollinger Band
- Last candle closes in green, confirming bulls have returned
- Buy trade is taken
Short Setup --------
- Price closes above Bollinger Band
- Last candle closes in red , confirming bears have returned
- Short trade is taken
Strategy open for suggestions and updation

Dhananjay Volatility stop strategy v1.0
Sharing one more strategy after getting good feedback on my earlier published strategy.
This is simple volatility stop strategy where in we are using VStop as entry and exit point.
Again smart traders can add MA to decide the trend and can avoid trading in opposite direction of trend which will help them to minimize loss making trades.
There are more than 1 parameters which traders can use/change to make this strategy compatible to their instrument.
To understand what is VStop use google.com :-)
Looking forward to receiving feedback from all of you.

HL MovingAvg2Line Cross Dhananjay
Sharing the simple trend following trading strategy, traders can add their own rules in this, to minimise the losses and maximise the profits. Like below.
1. Go long only if price is above 189 days EMA/SAM
2. Exit position when high or low of previous candle is breached in the opposite direction of the trend.
3. Go long only if price is in up trend on higher time frame charts and go short when price is down trend of higher time frame charts.
Stop loss, target and other things can also be decided by the trader.
Idea is to capture the short term trend to trade in FnO or 2/3 days position in underlying instrument.
Traders can optimise the length of the Moving average so that your traded is set for maximum profit giving settings for this strategy. Different instruments responds to different moving averages because of different volatility.
Idea is to go long when price closes above 9 days EMA of Highs and exit and go short whenever price closes below 9 days EMA of lows, exit short when first condition meets after short trade.
I ma not that good with scripts, have many such ideas, interested script writers can get in touch with me so that we can create trading systems which have grater success rate .

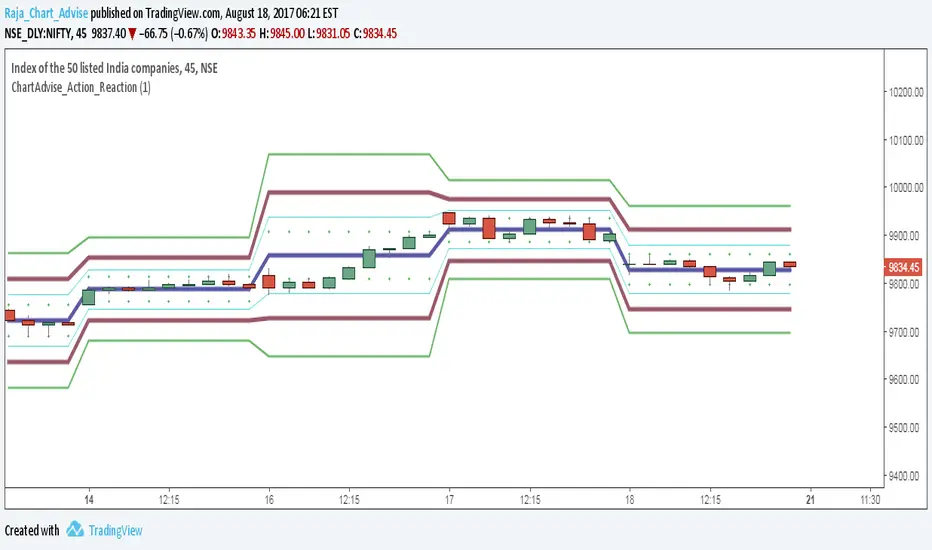
ChartAdvise_Action_ReactionThis script has finetuned the dynamic shifting of prices seen in the previous script.

NIFTY Trend OverlayThis will be useful to check with other NSE stocks and give real time updates on NIFTY trend on top of your stock of interest. The percentage change from previous day and a 3 bar immediate trend has been aggregated to show the trend

