PCP Arbitrage Monitor (Math by Thomas)Live monitor for Put–Call Parity (C + PV(K) = P + S) showing drift, arbitrage direction, and opportunity strength.
The PCP Arbitrage Monitor helps traders visualize and quantify deviations from the Put–Call Parity (PCP) relationship:
𝐶+𝐾𝑒−𝑟𝑇 = 𝑃+𝑆
When this equation drifts, it indicates a potential arbitrage opportunity between call, put, and underlying (spot or future).
This indicator plots the left-hand side (LHS) and right-hand side (RHS) of the PCP equation on your chart, computes the drift, and automatically highlights and displays actionable trade combinations when the deviation exceeds a set threshold.
⚙️ How It Works
Inputs
Call & Put Symbols – Select matching call and put options (same strike & expiry).
Strike (K) – The strike price for those options.
Expiry (UTC) – Option expiry date/time (used to calculate 𝑇 and PV(K)).
Risk-free Rate (r) – Annualized rate used for discounting the strike.
Lot Size / Tick Value – Used to calculate profit in INR.
Arbitrage Threshold – Minimum drift (in points) to trigger signals (default 200).
Displayed Data
LHS = C + PV(K) (Call + discounted Strike)
RHS = P + S (Put + Spot/Future)
Drift = LHS – RHS
Bookable Profit (INR)
Action Suggestion (only when |drift| ≥ threshold)
Background Highlight
🟩 Green – Call side expensive → Sell Call + Buy Put + Buy Fut
🟥 Red – Call side cheap → Buy Call + Sell Put + Sell Fut
Table
Displays all key values live in the top-right corner:
Option prices
LHS, RHS
Drift (points)
Time to expiry
Lot size
Bookable profit (INR)
Trade action (only if |drift| ≥ threshold)
📈 How to Use
Open a NIFTY Spot or Futures chart (works on both).
Enter the exact option symbols (e.g., NSE:NIFTY24DEC21900CE and NSE:NIFTY24DEC21900PE).
Adjust Strike (K) and Expiry to match those options.
Observe:
The green/red background highlights large deviations (≥ threshold).
The Action cell displays the arbitrage combination and expected profit.
A drift beyond the threshold suggests a potential risk-free arbitrage if executed simultaneously across all legs.
Hold positions till expiry if margin allows; the profit is theoretically locked in.
💡 Tips
Works on both Spot and Futures charts — the script auto-uses the chart’s close as 𝑆
Set smoothing to 0 to see raw parity values.
Adjust threshold based on costs and margin — e.g., 150–200 points for NIFTY is practical.
Only valid when options are European (no early exercise risk).
Ensure both option symbols are liquid and from the same expiry.
⚠️ Disclaimer
This tool is for educational and analytical purposes.
Real arbitrage execution depends on liquidity, bid-ask spread, slippage, and margin requirements.
Always validate prices with your broker before trading.
NIFTY

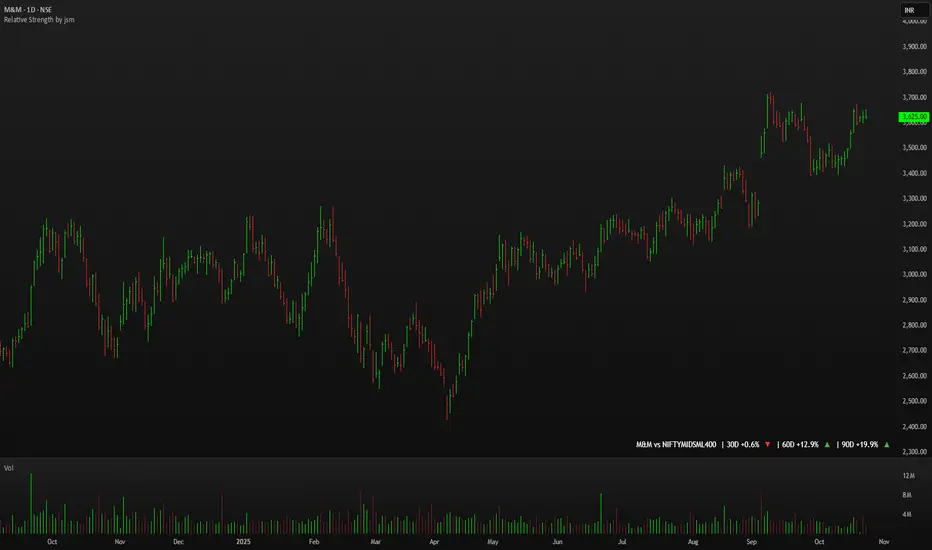
Relative Strength by jsm
1) Compare any stock against an Indian sector/index quickly and clearly.
2) Quickly gauge if your stock is outperforming or lagging its sector.
3) Instant relative strength tracker for Indian stocks & indices.
4) See 30D / 60D / 90D returns vs NIFTY, BANKNIFTY & more.
5) Smart visual tool to spot sector outperformance at a glance.
What it shows
A compact one-line readout (top-right by default):
TICKER vs INDEX | 30D +x.x% ▲ | 60D +y.y% ▼ | 90D +z.z% ▲
- +x.x% → stock return over the past 30 trading days (always uses daily bars).
- Arrow indicates relative performance vs the selected index: green ▲ = stock outperformed, red ▼ = stock underperformed, - = neutral (within tolerance).
- Percent values are shown with one decimal and a leading + for positives (e.g. +3.4%, -1.2%).
How it works
Apply the indicator to the stock chart (bottom chart in a dual-chart layout).
Choose the sector/index to compare from the “Compare with any Indian Index / Sector” dropdown. The indicator immediately calculates:
- Stock % change over 30 / 60 / 90 daily bars
- Index % change over the same periods
- Displays an arrow that reflects stock% − index% (colored only on the arrow to keep the numbers readable).
Inputs
- Pick Sector : preset list of Indian indices/sectors (no free-text by default).
- Box placement : Top/Bottom × Left/Right.
- Box Size : Tiny / Small / Normal / Large / Huge (controls font size).
- Dark Mode : toggles text color for dark/light charts.
- Show 30D / Show 60D / Show 90D : enable/disable individual periods.
- Equality tolerance (%) : small tolerance window to treat values as “equal” (shows neutral symbol).
Behavior & design choices
- Uses daily series for lookbacks (so 30D/60D/90D = 30/60/90 trading days) — works correctly on intraday charts too.
- Arrow only is colored (green/red/gray) for quick visual scanning; numbers remain neutral for readability.
- No intrusive background box by default — flat overlay that blends with your chart.
- Defaults: Bottom-right placement, Normal size, Light mode = off (so dark charts show white text).
Limitations / notes
- Not financial advice — use as a quick comparative visual, not a trade signal.
- The indicator calculates using the preset index symbols; if your broker/data feed lacks a symbol, the cell shows n/a.
- Due to TradingView table rendering, a tiny pixel gap may appear between a percent and its colored arrow (kept minimal on purpose).
Example
On SMSPHARMA chart with NSE:NIFTY selected:
SMSPHARMA vs NIFTY | 30D +13.0% ▲ | 60D +18.5% ▲ | 90D +13.5% ▲
— stock has outperformed NIFTY in all periods.
Friday & Monday HighlighterFriday & Monday Institutional Range Marker — Know Where Big Firms Set the Trap!
🧠 Description
This indicator automatically highlights Friday and Monday sessions on your chart — days when institutional players and algorithmic firms (like Citadel, Jane Street, or Tower Research) quietly shape the upcoming week’s price structure.
🔍 Why Friday & Monday matter
Friday : Large institutions often book profits or hedge into the weekend. Their final-hour moves reveal the next week’s bias.
Monday : Big players rebuild positions, absorbing liquidity left behind by retail traders.
Together, these two days define the range traps and breakout zones that often control price action until midweek.
> In short, the Friday–Monday high and low often act as invisible walls — guiding scalpers, option sellers, and swing traders alike.
🧩 What this tool does
✅ Highlights Friday (red) and Monday (green) sessions
✅ Adds optional day labels above bars
✅ Works across all timeframes (best on 15min to 1hr charts)
✅ Helps you visually identify where institutions likely built their positions
Use it to quickly spot:
* Range boundaries that trap traders
* Gap zones likely to get filled
* High–low sweeps before reversals
⚙️ Recommended Use
1. Mark Friday’s high–low → Watch for liquidity sweeps on Monday.
2. When Monday holds above Friday’s high , breakout continuation is likely.
3. When Monday fails below Friday’s low , expect a reversal or trap.
4. Combine this with OI shifts, IV crush, and FII–DII flow data for confirmation.
⚠️ Disclaimer
This indicator is for **educational and analytical purposes only**.
It does **not constitute financial advice** or a trading signal.
Markets are dynamic — always perform your own research before trading or investing.

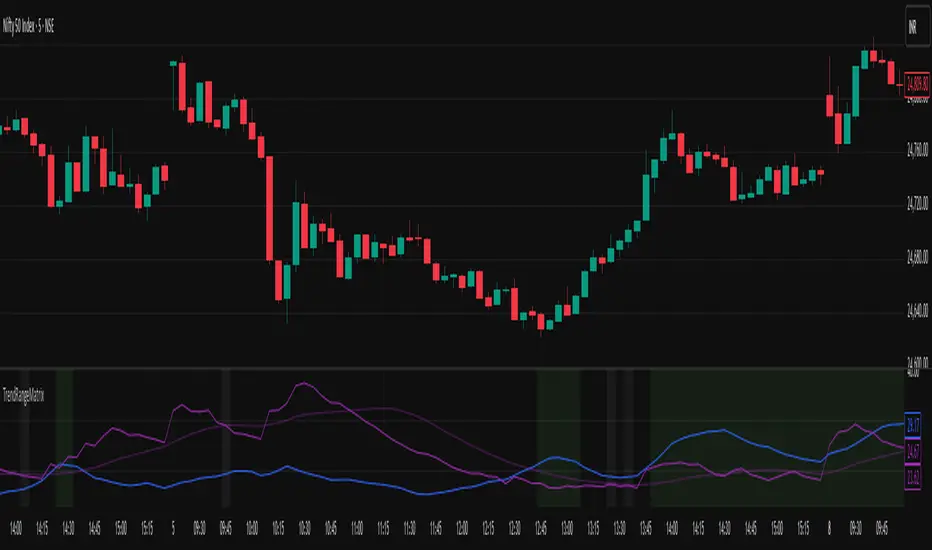
Nifty Trend vs Range (Final)This indicator is designed to help you quickly identify whether the Nifty market is trending, ranging, or preparing for a breakout by combining three volatility and trend-strength measures:
India VIX (Volatility Index)
ADX (Average Directional Index)
ATR (Average True Range)
It creates a Trend vs Range Decision Matrix that categorizes the market into actionable states such as Range – Quiet, Breakout Watch, Trend – Smooth, Trend – Confirmed, Trend – Volatile, or Choppy / Noisy.
🔑 How it Works
India VIX (Market Volatility)
Pulled directly from NSE:INDIAVIX (or your chosen symbol).
VIX thresholds are defined:
Below VIX Low → Calm market (often ranges).
Between VIX Low & High → Neutral/moderate volatility.
Above VIX High → High volatility (potential big moves or choppiness).
VIX can be scaled and plotted in the same pane with ADX/ATR, or shown separately with a companion script.
ADX (Trend Strength)
Custom calculation (Wilder’s smoothing, not built-in ta.adx), to ensure more consistent results.
Thresholds (auto-tuned by timeframe if enabled):
Low ADX → Weak/no trend, sideways.
High ADX → Strong directional trend.
ATR (Volatility Expansion)
ATR compared to a moving average of ATR detects whether volatility is rising or flat.
Used as confirmation for breakouts or fading moves.
🧠 Market State Logic
The script combines the three signals into an interpretable market state:
Range – Quiet → VIX low, ADX low, ATR flat
Trend – Smooth → VIX low, ADX high
Breakout Watch → VIX neutral, ADX low, ATR rising
Trend – Confirmed → VIX neutral, ADX high, ATR rising
Choppy / Noisy → VIX high, ADX low, ATR rising
Trend – Volatile → VIX high, ADX high, ATR rising
Neutral → fallback if conditions don’t match
Each state is color-coded with background shading and displayed as a persistent label with key metrics (VIX, ADX, ATR).
⚙️ Features
✅ Intraday Auto-Tuning
ADX/ATR thresholds automatically adjust depending on chart timeframe (5m, 15m, etc.).
✅ Scalable VIX Plotting
Option to overlay a scaled VIX line in the same pane or hide it if you use a separate VIX pane.
✅ Persistent State Label
Shows the current regime, timeframe, and key values. Updates every bar without stacking multiple labels.
✅ Alerts Ready
Alerts for each market regime can be set directly in TradingView.
✅ Background Coloring
Quick at-a-glance identification of current state.
🎯 How to Use
Ranging markets (low VIX, low ADX, flat ATR): Favor mean-reversion strategies like option selling, iron condors, or scalping.
Smooth trends (low VIX, high ADX): Favor directional trades with futures/options spreads.
Breakout Watch: Stay alert for possible trend initiation.
Confirmed trends (neutral VIX, high ADX, rising ATR): Ideal for momentum trading.
Volatile trends (high VIX, high ADX): Use caution, hedge positions, or trade with wider stops.
Choppy/Noisy (high VIX, low ADX): Avoid overtrading, expect false signals.
Intraday Buy/Sell/Average Zones by Chaitu50cIntraday Buy/Sell/Average Zones by chaitu50c
Timeframe:
Tested on the 5-minute chart.
Recommended timeframe: 5-minute
What it does
This indicator marks intraday Buy (green) and Sell (red) zones made by strong close-confirmed breakouts. These zones act as support/resistance. If price later closes through a zone, the zone changes color from that bar forward (support ↔ resistance). It can flip more than once.
How zones form
Single breakout: an opposite-type candle closes beyond the previous candle’s high/low.
Double breakout: a base candle, then two opposite-type candles, and the second one closes beyond the base high/low.
Zone size
Buy zone: from the combo lowest low up to the nearest open/close of the combo.
Sell zone: from the combo highest high down to the nearest open/close of the combo.
Color shift (optional)
If price closes through a zone, it flips color at that bar and behaves as the other side (support ↔ resistance). Flips can happen again later.
Overlap control
When a new zone overlaps an existing same-color zone in the same session, choose:
Merge (combine), or
Suppress (ignore the new one).
Flipped zones use their current color for this.
Right edge & session
All zones extend to the right (your offset). Detection is limited to your chosen session, and you can show only the last N sessions.
---
How to trade (simple)
A) Initial breakout trade
When a new zone forms, that breakout itself can be a trade idea in the breakout direction, The stoploss will be the zone.
B) Zone breakout trade (flip)
If price later closes out of a zone and it changes color, that breakout is another trade opportunity in the new direction.
C) Retrace & average trade
When price retests a zone, wait for a confirmation candle in the zone’s favor
— bullish close for a green zone, bearish close for a red zone — then average entries inside/near the zone.
Place stops just beyond the opposite edge of the zone.
If the zone flips color, stop averaging; bias changed.
---
Key settings
Breakout type: Single and/or Double
Confirm on Close: strict mode (no intrabar preview) or allow intrabar preview that auto-removes if fail
Color Shift on Breaks: on/off
Same-Type Overlap: Merge/Suppress
Session, Sessions to Display, Right Offset, Colors, Max Zones
Reminder: Best results on the 5-minute timeframe (tested and recommended).

SmartPlusSmartPlus
Overview
The SmartPlus indicator is a complete framework for intraday traders. It combines key market reference points (VWAP, moving averages, and the first 15-minute high/low range) with predictive levels based on historical daily moves. Together, these elements allow traders to build directional bias, spot breakouts, and manage risk throughout the session.
Key Features
1. VWAP (Volume-Weighted Average Price)
- Plots the intraday VWAP in real time.
- VWAP acts as a central “fair value” reference point for institutional order flow.
- Price trading above VWAP generally suggests bullish bias, while below VWAP leans bearish.
2. Exponential Moving Averages (EMAs)
- Two configurable EMAs are included:
- Fast EMA (default: 21 periods)
- Slow EMA (default: 34 periods)
- Each EMA is plotted with a single, user-selectable color for clarity.
- Crossovers or alignment between price, VWAP, and EMAs help define market structure.
3. Smart Bar Coloring
- Candles automatically change color when conditions align:
- Bull Zone: Price above VWAP, Fast EMA, and Slow EMA.
- Bear Zone: Price below VWAP, Fast EMA, and Slow EMA.
- Fluorescent bar coloring helps highlight momentum zones visually without additional analysis.
4. First 15-Minute High/Low/Mid (Automatic)
- Automatically detects the first 15 minutes of each new trading day (no manual input required).
- Plots horizontal lines for:
- First 15-Minute High (green)
- First 15-Minute Low (red)
- Midpoint of that range (gray)
- Once the initial 15-minute window ends, these levels remain projected throughout the session as breakout or support/resistance zones.
- Alerts trigger when price breaks above the high or below the low after the window.
5. Daily Support/Resistance Forecast
- Uses a rolling lookback of recent daily ranges (default: 126 days).
- Tracks average up moves and down moves from the daily open.
- Optionally incorporates standard deviation for wider confidence bands.
- Plots forecast levels above/below the current day’s open for reference.
Trading Logic (How to Use)
- Bullish Bias:
- Price is above VWAP, above both EMAs, and ideally above the first 15-minute high.
- This setup suggests trend continuation or breakout opportunities on the long side.
- Bearish Bias:
- Price is below VWAP, below both EMAs, and ideally below the first 15-minute low.
- This setup suggests downward pressure or breakout opportunities on the short side.
- Neutral / Caution Zone:
- Price caught between VWAP, EMAs, or inside the 15-minute range often signals indecision.
- Best to wait for confirmation or breakout before committing to trades.
Expectations After Using It
- The script provides context and structure, not trading signals.
- It highlights where price is relative to meaningful market levels so traders can act with greater confidence.
- Combining VWAP, EMAs, and the 15-minute breakout framework helps traders stay aligned with the market’s natural rhythm.
Disclaimer
This script is a tool for market analysis and educational purposes only.
It does not constitute financial advice, trading recommendations, or guaranteed profitability.
Markets are inherently risky, and past patterns do not ensure future results.
Always combine this tool with sound risk management, personal research, and professional guidance before making any trading decisions.

Straddle Charts - Live (Enhanced)Track options straddles with ease using the Straddle Charts - Live (Enhanced) indicator! Originally inspired by @mudraminer, this Pine Script v5 tool visualizes live call, put, and straddle prices for instruments like BANKNIFTY. Plotting call (green), put (red), and straddle (black) prices in a separate pane, it offers real-time insights for straddle strategy traders.
Key Features:
Live Data: Fetches 1-minute (customizable) option prices with error handling for invalid symbols.
Price Table: Displays call, put, straddle prices, and percentage change in a top-left table.
Volatility Alerts: Highlights bars with straddle price changes above a user-defined threshold (default 5%) with a yellow background and concise % labels.
Robust Design: Prevents plot errors with na checks and provides clear error messages.
How to Use: Input your call/put option symbols (e.g., NSE:NIFTY250814C24700), set the timeframe, and adjust the volatility threshold. Monitor straddle costs and volatility for informed trading decisions.
Perfect for options traders seeking a simple, reliable tool to track straddle performance. Check it out and share your feedback!

Nifty Smart Zones & Breakout Bars(5min TF only) by Chaitu50cNifty Smart Zones & Breakout Bars is a purpose-built intraday trading tool, tested extensively on Nifty50 and recommended for Nifty50 use only.
All default settings are optimised specifically for Nifty50 on the 5-minute timeframe for maximum accuracy and clarity.
Why Last Bar of the Session Matters
The last candle of a trading session often represents the final battle between buyers and sellers for that day.
It encapsulates closing sentiment, influenced by end-of-day positioning, profit booking, and institutional activity.
The high and low of this bar frequently act as strong intraday support/resistance in the following sessions.
Price often reacts around these levels, especially when combined with volume surges.
Core Features
Session Last-Candle Zones
Plots a horizontal box at the high and low of the last candle in each session.
Boxes extend to the right to track carry-over levels into new sessions.
Uses a stateless approach — past zones reappear if relevant.
Smart Suppression System
When more than your Base Sessions (No Suppression) are shown, newer zones overlapping or within a proximity distance (in points) of older zones are hidden.
Older zones take priority, reducing chart clutter while keeping critical levels.
Breakout Bar Coloring
Highlights breakout bars in four categories:
Up Break (1-bar)
Down Break (1-bar)
Up Break (2-bar)
Down Break (2-bar)
Breakouts use a break buffer (in ticks) to filter noise.
Toggle coloring on/off instantly.
Volume Context (User Tip)
For best use, pair with volume analysis.
High-volume breakouts from last-session zones have greater conviction and can signal sustained momentum.
Usage Recommendations
Instrument: Nifty50 only (tested & optimised).
Timeframe: 5-minute chart for best results.
Approach:
Watch for price interaction with the plotted last-session zones.
Combine zone breaks with bar color signals and volume spikes for higher-probability trades.
Use suppression to focus on key, non-redundant levels.
Why This Tool is Different
Unlike standard support/resistance plotting, this indicator focuses on session-closing levels, which are more reliable than arbitrary highs/lows because they capture the final market consensus for the session.
The proximity-based suppression ensures your chart stays clean, while breakout paints give instant visual cues for momentum shifts.

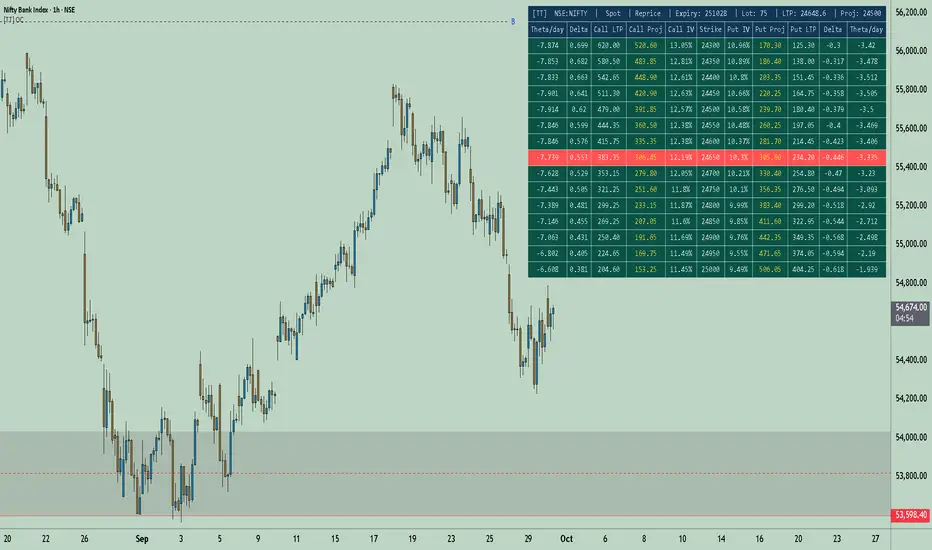
[TT] Option Chain✅Option Geeks for NSE India
Option Geeks is a powerful tool designed for options traders on the NSE (National Stock Exchange of India). It provides real-time visualization and insights based on key option greeks such as Delta, Gamma, Theta, and Implied Volatility (IV) — enabling traders to make more informed decisions when analyzing option chains and positions.
✅What This Script Does:
Calculates and displays the main option greeks for both Call and Put options.
Highlights sensitivity of option prices to changes in:
Underlying price (Delta, Gamma)
Time decay (Theta)
Implied Volatility Calculation.
Tracks live changes in IV and allows comparison across strikes and expiries.
Helps identify favorable option setups and hedging opportunities.
Designed for Bank Nifty, Nifty 50, and top NSE FnO stocks.
✅ How It Works (Conceptually):
Uses a simplified Black-Scholes model adapted for Indian markets.
Takes into account underlying price, strike, days to expiry, interest rate, and volatility to compute the Greeks. Plots real-time values on chart
Manually You need to input the ATM Strike and nearest expiry to update Greeks accordingly.
✅ Who Should Use It:
Options traders seeking deeper insight beyond price charts.
Scalpers and positional traders looking to understand how their trades react to time, price, and volatility.
Anyone trading on NSE’s F&O segment who wants to make smarter trades based on calculated risk metrics
IVRS 5.0Unlock smarter trading decisions with IVRS 5.0, a cutting-edge indicator designed for Pine Script users. IVRS 5.0 offers enhanced insights into price action and momentum shifts, giving you early warnings of trend reversals and optimal entry/exit points. Built with the latest algorithmic techniques, this premium tool is ideal for traders seeking both reliability and innovation.
Key Features:
Sophisticated reversal detection logic for timely buy/sell signals.
Dynamic adaptability for all chart timeframes and asset classes.
Clean, customizable visualization to match your trading style.
Optimized performance, ensuring seamless integration into your workflow.
Take your chart analysis to the next level with IVRS 5.0 — elevate your trading with precision and confidence!

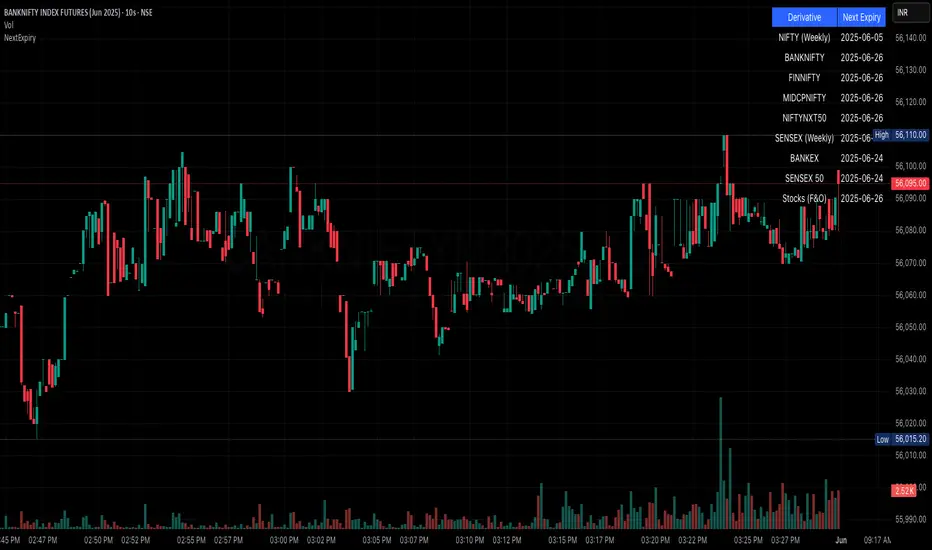
NSE/BSE Derivative - Next Expiry Date With HolidaysNSE & BSE Expiry Tracker with Holiday Adjustments
This Pine Script is a TradingView indicator that helps traders monitor upcoming expiry dates for major Indian derivative contracts. It dynamically adjusts these expiry dates based on weekends and holidays, and highlights any expiry that falls on the current day.
⸻
Key Features
1. Tracks Expiry Dates for Major Contracts
The script calculates and displays the next expiry dates for the following instruments:
• NIFTY (weekly expiry every Thursday)
• BANKNIFTY, FINNIFTY, MIDCPNIFTY, NIFTYNXT50 (monthly expiry on the last Thursday of the month)
• SENSEX (weekly expiry every Tuesday)
• BANKEX and SENSEX 50 (monthly expiry on the last Tuesday of the month)
• Stocks in the F&O segment (monthly expiry on the last Thursday)
2. Holiday Awareness
Users can input a list of holiday dates in the format YYYY-MM-DD,YYYY-MM-DD,.... If any calculated expiry falls on one of these holidays or a weekend, the script automatically adjusts the expiry to the previous working day (Monday to Friday).
3. Customization Options
The user can:
• Choose the position of the expiry table on the chart (e.g. top right, bottom left).
• Select the font size for the expiry table.
• Enable or disable the table entirely (if implemented as an input toggle).
4. Visual Expiry Highlighting
If today is an expiry day for any instrument, the script highlights that instrument in the display. This makes it easy to spot significant expiry days, which are often associated with increased volatility and trading volume.
⸻
How It Works
• The script calculates the next expiry for each index using built-in date/time functions.
• For weekly expiries, it finds the next occurrence of the designated weekday.
• For monthly expiries, it finds the last Thursday or Tuesday of the month.
• Each expiry date is passed through a check to adjust for holidays or weekends.
• If today matches the adjusted expiry date, that row is visually emphasized.
⸻
Use Case
This script is ideal for traders who want a quick glance at which instruments are expiring soon — especially those managing options, futures, or expiry-based strategies.
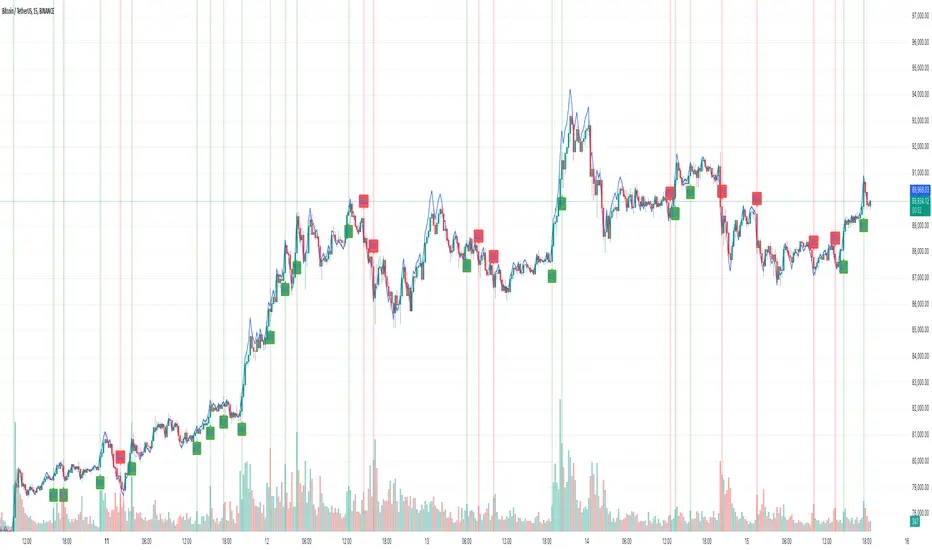
Reversal Strength Meter – Adib NooraniThe Reversal Strength Meter is an oscillator designed to identify potential reversal zones based on supply and demand dynamics. It uses smoothed stochastic logic to reduce noise and highlight areas where momentum may be weakening, signaling possible market turning points.
🔹 Smooth, noise-reduced stochastic oscillator
🔹 Custom zones to highlight potential supply and demand imbalances
🔹 Non-repainting, compatible across all timeframes and assets
🔹 Visual-only tool — intended to support discretionary trading decisions
This oscillator assists scalpers and intraday traders in tracking subtle shifts in momentum, helping them identify when a market may be preparing to reverse — always keeping in mind that trading is based on probabilities, not certainties.
📘 How to Use the Indicator Efficiently
For Reversal Trading:
Buy Setup
– When the blue line dips below the 20 level, wait for it to re-enter above 20.
– Look for reversal candlestick patterns (e.g., bullish engulfing, hammer, or morning star).
– Enter above the pattern’s high, with a stop loss below its low.
Sell Setup
– When the blue line rises above the 80 level, wait for it to re-enter below 80.
– Look for bearish candlestick patterns (e.g., bearish engulfing, inverted hammer, or evening star).
– Enter below the pattern’s low, with a stop loss above its high.
🛡 Risk Management Guidelines
Risk only 0.5% of your capital per trade
Book 50% profits at a 1:1 risk-reward ratio
Trail the remaining 50% using price action or other supporting indicators

Reversal Scalping Ribbon - Adib NooraniThe Reversal Scalping Ribbon is a trend-following overlay tool designed to visually identify potential reversal zones based on price extremes and dynamic volatility bands. It calculates adaptive upper and lower bands using price action and custom ATR logic, helping traders quickly assess market direction and possible turning points
🔹 Volatility-adjusted bands based on price highs/lows
🔹 Color-coded ribbons to indicate trend bias and potential reversal shifts
🔹 No repainting, works on all timeframes and assets
🔹 Visual-only display, no trade signals — supports discretion-based entries
This ribbon is designed for scalpers and intraday traders to spot reversal setups with clarity. It enhances your trading by showing real-time market bias without unnecessary distractions. By focusing on probabilities, it helps to improve decision-making in fast-paced environments
How to use the indicator efficiently
For Reversal Trading:
Buy: When price closes below the green ribbon with a red candle, then re-enters with a green candle. Enter above the high of the green candle with a stop loss below the lowest low of the recent green/red candles
Sell: When price closes above the red ribbon with a green candle, then re-enters with a red candle. Enter below the low of the red candle with a stop loss above the highest high of the recent red/green candles
Risk Management:
Limit risk to 0.5% of your capital per trade
Take 50% profit at a 1:1 risk-reward ratio
For the remaining 50%, trail using the lower edge of the green band for buys and the upper edge of the red band for sells

Combined Options IndicatorCombined Options Indicator
Indicator combines 2 option charts value with an operator.In the example, It combines 48600 strike call and put of banknifty, effectievely giving straddle price.
Features:
Combine any two option instruments (calls or puts) with customizable parameters
Support for different underlying instruments (NIFTY, BANKNIFTY, etc.)
Apply various operators: addition, subtraction, multiplication, division, or exponentiation
Visualize results as either candlesticks or a line chart
Customizable colors for bullish and bearish movements
Information panel displaying individual and combined values
Usage:
Input all components of each option symbol separately including instrument name, expiry details (year, month, day), option type (call/put), and strike price. The indicator automatically constructs the symbols, retrieves their data, and applies your selected operation to display the combined values.
Ideal for option traders looking to track custom spreads, analyze volatility, or create tailored trading indicators based on option price relationships.

JJ Highlight Time Ranges with First 5 Minutes and LabelsTo effectively use this Pine Script as a day trader , here’s how the various elements can help you manage trades, track time sessions, and monitor price movements:
Key Components for a Day Trader:
1. First 5-Minute Highlight:
- Purpose: Day traders often rely on the first 5 minutes of the trading session to gauge market sentiment, watch for opening price gaps, or plan entries. This script draws a horizontal line at the high or low of the first 5 minutes, which can act as a key level for the rest of the day.
- How to Use: If the price breaks above or below the first 5-minute line, it can signal momentum. You might enter a long position if the price breaks above the first 5-minute high or a short if it breaks below the first 5-minute low.
2. Session Time Highlights:
- Morning Session (9:15–10:30 AM): The market often shows its strongest price action during the first hour of trading. This session is highlighted in yellow. You can use this highlight to focus on the most volatile period, as this is when large institutional moves tend to occur.
- Afternoon Session (12:30–2:55 PM): The blue highlight helps you track the mid-afternoon session, where liquidity may decrease, and price action can sometimes be choppier. Day traders should be more cautious during this period.
- How to Use: By highlighting these key times, you can:
- Focus on key breakouts during the morning session.
- Be more conservative in your trades during the afternoon, as market volatility may drop.
3. Dynamic Labels:
- Top/Bottom Positioning: The script places labels dynamically based on the selected position (Top or Bottom). This allows you to quickly glance at the session's start and identify where you are in terms of time.
- How to Use: Use these labels to remind yourself when major time segments (morning or afternoon) begin. You can adjust your trading strategy depending on the session, e.g., being more aggressive in the morning and more cautious in the afternoon.
Trading Strategy Suggestions:
1. Momentum Trades:
- After the first 5 minutes, use the high/low of that period to set up breakout trades.
- Long Entry: If the price breaks the high of the first 5 minutes (especially if there's a strong trend).
- Short Entry: If the price breaks the low of the first 5 minutes, signaling a potential downtrend.
2. Session-Based Strategy:
- Morning Session (9:15–10:30 AM):
- Look for strong breakout patterns such as support/resistance levels, moving average crossovers, or candlestick patterns (like engulfing candles or pin bars).
- This is a high liquidity period, making it ideal for executing quick trades.
- Afternoon Session (12:30–2:55 PM):
- The market tends to consolidate or show less volatility. Scalping and mean-reversion strategies work better here.
- Avoid chasing big moves unless you see a clear breakout in either direction.
3. Support and Resistance:
- The first 5-minute high/low often acts as a key support or resistance level for the rest of the day. If the price holds above or below this level, it’s an indication of trend continuation.
4. Breakout Confirmation:
- Look for breakouts from the highlighted session time ranges (e.g., 9:15 AM–10:30 AM or 12:30 PM–2:55 PM).
- If a breakout happens during a key time window, combine that with other technical indicators like volume spikes , RSI , or MACD for confirmation.
---
Example Day Trader Usage:
1. First 5 Minutes Strategy: After the market opens at 9:15 AM, watch the price action for the first 5 minutes. The high and low of these 5 minutes are critical levels. If the price breaks above the high of the first 5 minutes, it might indicate a strong bullish trend for the day. Conversely, breaking below the low may suggest bearish movement.
2. Morning Session: After the first 5 minutes, focus on the **9:15 AM–10:30 AM** window. During this time, look for breakout setups at key support/resistance levels, especially when paired with high volume or momentum indicators. This is when many institutions make large trades, so price action tends to be more volatile and predictable.
3. Afternoon Session: From 12:30 PM–2:55 PM, the market might experience lower volatility, making it ideal for scalping or range-bound strategies. You could look for reversals or fading strategies if the market becomes too quiet.
Conclusion:
As a day trader, you can use this script to:
- Track and react to key price levels during the first 5 minutes.
- Focus on high volatility in the morning session (9:15–10:30 AM) and **be cautious** during the afternoon.
- Use session-based timing to adjust your strategies based on the time of day.

Market Anomaly Detector (MAD)Market Anomaly Detector (MAD) Indicator - Detailed Description:
The Market Anomaly Detector (MAD) Indicator is a unique tool designed to identify potential market anomalies by combining several price action-based and momentum indicators. This indicator is especially useful for traders who seek to identify significant market shifts and anomalies before they become visible in conventional technical indicators.
Key Features of the MAD Indicator:
1. Z-Score Threshold for Anomaly Detection:
• The Z-Score measures how far a current price is from its average over a defined period, normalized by standard deviation. This allows the MAD indicator to detect outliers or anomalies in price movements.
• By adjusting the Z-Score Threshold, traders can tune the sensitivity of the indicator to capture only the most significant price deviations, filtering out noise and reducing false signals.
2. Volume and Liquidity Filter:
• Volume is a key indicator of market participation and sentiment. The MAD Indicator uses a volume multiplier to assess when price movements are supported by sufficient trading volume.
• A volume spike is identified when the current volume exceeds the average volume by a certain multiplier. This ensures that only high-confidence signals are generated, particularly useful for spotting trend reversals and breakout opportunities.
3. Signal Cooldown Period:
• To prevent overfitting and reduce false signals, a signal cooldown period is implemented. Once a buy or sell signal is triggered, the indicator waits for a specified number of bars (e.g., 5) before triggering another signal, even if the price action meets the criteria for a new signal. This helps maintain a cleaner trading environment and avoids confusion when the market is volatile.
4. Upper and Lower Bands for Trend Confirmation:
• The MAD Indicator uses bands based on the mean price and standard deviation, similar to Bollinger Bands. These upper and lower bands help to define the expected price range for a given period, indicating overbought or oversold conditions.
• The combination of Z-Score, volume, and band analysis helps pinpoint when the price breaks out of expected ranges, providing early warning signs for potential market shifts.
5. Trend Confirmation from Higher Timeframes:
• The MAD Indicator includes a multi-timeframe approach to trend confirmation, using the 50-period EMA on a higher timeframe (e.g., 1-hour chart). This ensures that signals are aligned with the overall market trend, enhancing the reliability of buy and sell signals.
How It Works:
• The MAD Indicator continuously monitors price action, volume, and statistical anomalies, using the Z-Score to determine when the price is significantly deviating from its historical average.
• When the price breaks above the upper band and a bullish anomaly is detected, a buy signal is generated. (Green Background)
• Similarly, when the price breaks below the lower band and a bearish anomaly is detected, a sell signal is triggered. (Red Background
• By filtering signals based on volume and using the cooldown period, the MAD Indicator ensures that only high-quality trades are signaled.
How to Use the MAD Indicator:
• Buy Signal: Occurs when the price breaks above the upper band and there is a significant deviation from the mean (bullish anomaly).
• Sell Signal: Occurs when the price breaks below the lower band and there is a significant deviation from the mean (bearish anomaly).
• Volume Confirmation: Ensure that the buy/sell signals are supported by a volume spike, indicating strong market participation.
• Signal Cooldown Period: After a signal is triggered, the indicator waits for the cooldown period to avoid triggering multiple signals in quick succession.
Why It’s Worth Paying For:
The MAD Indicator combines advanced statistical analysis (Z-Score), price action, and volume analysis to identify market anomalies and breakouts before they are visible on standard indicators. By leveraging the power of mean reversion and statistical anomalies, this tool provides traders with high-confidence signals that can lead to profitable trades, especially in volatile markets. The integration of a multi-timeframe trend filter ensures that signals are aligned with the overall market trend, reducing the likelihood of false breakouts.
This indicator is ideal for trend-following traders looking for high-probability entries and mean-reversion traders aiming to capture price deviations. The signal cooldown period and volume filter provide an additional layer of precision, ensuring that you only act on the strongest market signals.

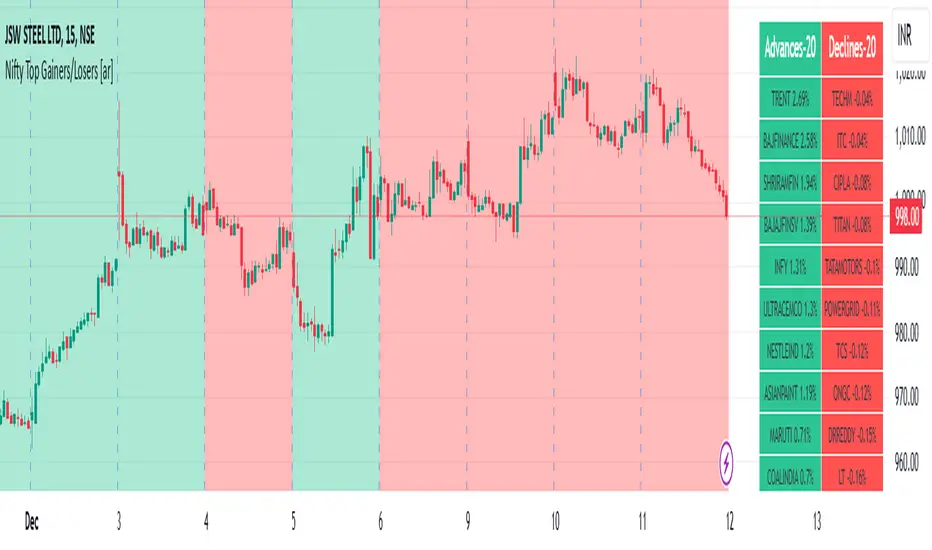
Nifty Top Gainers/Losers [ar]Nifty Top Gainers/Losers - Real-time Market Performance Tracker
A powerful indicator that monitors and displays real-time performance of 40 major Nifty stocks in a clean, organized table format. Perfect for traders seeking instant market breadth insights.
Key Features:
• Dynamic advances/declines counter at the top
• Real-time percentage change calculations
• Color-coded display (green for gainers, red for losers)
• Customizable reference points (Previous Day Close/Today's Open)
• Optional background color based on market breadth
• Flexible top gainers/losers limit setting
Customization Options:
- Adjust colors for gainers and losers
- Set transparency for background
- Modify the number of top performers to display
- Add/remove symbols from the watchlist
- Choose calculation reference (Previous Day Close/Today's Open)
Ideal for:
- Day traders monitoring market momentum
- Investors tracking sector rotation
- Analysts studying market breadth
- Portfolio managers seeking quick market overview
This indicator helps identify market leaders and laggards at a glance, making it an essential tool for informed trading decisions.
Adaptive Range Breakout (ARB) IndicatorTitle: Adaptive Range Breakout (ARB) Indicator – Enhanced Mean Reversion with Dynamic Support/Resistance
Overview: The Adaptive Range Breakout (ARB) Indicator is designed to help traders identify potential mean reversion and breakout opportunities by leveraging a dynamic range based on recent price action and volatility. This script combines key elements such as Volume Profile analysis, ATR-based volatility adjustments, and an EMA trend filter to create a robust and adaptive trading tool. It aims to capture both trend continuations and reversals while filtering out noise in choppy markets.
Justification for Combining Components:
HVN (High Volume Node):
The core of this indicator is built around a custom VWAP calculation over a defined lookback period, which serves as the HVN line (High Volume Node). The HVN represents a volume-weighted average price, highlighting key levels where significant trading activity has occurred. These levels often act as areas of support or resistance, providing a reliable reference point for traders.
ATR-Based Dynamic Support and Resistance:
The Average True Range (ATR) is used to adjust the adaptive support and resistance levels around the HVN line. This ensures that the levels dynamically respond to changes in market volatility. The use of ATR helps filter out insignificant price movements and focuses on significant shifts in momentum, making the indicator adaptive to different market conditions.
EMA Trend Filter:
An Exponential Moving Average (EMA) is applied as a trend filter to distinguish between trending and range-bound market conditions. This filter helps in identifying whether the price movement is in line with the overall trend or if a potential reversal is more likely. By using the EMA crossover signals, the indicator can provide additional confirmation before generating buy or sell signals.
Adaptive Breakout and Mean Reversion Signals:
The indicator generates buy and sell signals based on the interaction between the price and the adaptive support/resistance levels. It incorporates a volatility filter to ensure that signals are only triggered when the market is sufficiently volatile, reducing the likelihood of false signals during low-volatility periods. Additionally, a cooldown period is implemented to prevent consecutive signals in quick succession, enhancing signal reliability.
Key Features:
Dynamic Range Levels: The adaptive support and resistance levels adjust based on recent price action and volatility, providing reliable areas for potential reversals or breakouts.
Volume-Weighted Analysis: The HVN line, derived from a custom VWAP calculation, highlights key price levels with significant trading activity, helping identify zones of support/resistance.
Trend Confirmation: The EMA trend filter helps differentiate between trend-following and mean-reversion signals, providing context for the generated buy and sell signals.
Volatility Filtering: The indicator uses ATR to gauge market volatility, ensuring signals are only generated during active market conditions.
Signal Cooldown: A customizable cooldown period reduces noise by spacing out signals, especially in choppy market environments.
Use Case:
The Adaptive Range Breakout (ARB) Indicator is suitable for traders looking to capitalize on both breakouts and mean-reversion opportunities. It is particularly useful in:
Range-Bound Markets: The adaptive support and resistance levels help capture reversals in range-bound conditions.
Trending Markets: The trend filter and breakout logic allow traders to follow momentum when the price breaks through key adaptive levels.
Intraday and Swing Trading: The dynamic nature of the indicator makes it applicable across different timeframes, catering to both intraday and swing traders.
Important Considerations:
This indicator does not guarantee future performance or provide an infallible prediction of price movements. It is a tool intended to support traders in their decision-making process based on historical price action and market conditions.
The effectiveness of the signals may vary depending on the asset, market conditions, and timeframe used. It is recommended to backtest the indicator and use it alongside other analysis techniques.
Always exercise caution and use appropriate risk management strategies when trading based on signals generated by this indicator.
Alerts: The indicator includes built-in alerts for:
Buy Signal Alert: Triggered when the price crosses above the adaptive support level, suggesting a potential reversal or continuation in an uptrend.
Sell Signal Alert: Triggered when the price crosses below the adaptive resistance level, indicating a potential reversal or continuation in a downtrend.
EMA Crossover Alerts: Alerts for EMA crossover signals, providing additional trend confirmation.
This script is a comprehensive tool designed to adapt to market conditions dynamically, combining multiple techniques to create a well-rounded approach to identifying trading opportunities. We encourage users to integrate it into their broader trading strategy and apply it with caution, understanding its strengths and limitations.

TimeFlow Momentum IndicatorThe “TimeFlow Momentum Indicator” is a thoughtfully crafted tool that integrates multiple analytical components to deliver a unique perspective on market momentum. It is not a mere combination of existing indicators, but rather a purposeful integration where each element plays a specific role, enhancing the overall functionality and reliability of the script. The primary aim is to provide traders with a more comprehensive and accurate analysis by leveraging time-based divergence, volume validation, and trend filtering.
1. Time-Based Momentum Divergence: The Core Innovation
• The heart of the indicator is the Time Divergence Line, which introduces a unique approach to analyzing momentum by focusing on the time spent in uptrends versus downtrends. Unlike traditional momentum indicators that rely purely on price movements (e.g., RSI, MACD), the Time Divergence Line captures the duration of market trends, offering a different perspective on momentum shifts.
• This method counts consecutive bars where the price closes higher (uptrend) or lower (downtrend) and calculates the difference between these counts. By measuring the time spent in different trend directions, the indicator can detect early signs of trend exhaustion or potential reversals, which are often missed by price-based indicators.
2. EMA Smoothing: Enhancing Signal Clarity
• The raw time divergence data is smoothed using an Exponential Moving Average (EMA) to filter out noise and provide a clearer, more reliable signal. The EMA helps to capture the underlying trend in the divergence data, making it easier for traders to identify meaningful shifts in momentum without being misled by short-term price fluctuations.
• This smoothing technique is crucial because it reduces false signals, ensuring that the divergence line reflects the true momentum of the market.
3. Overlay Plotting for Better Visualization
• The smoothed Time Divergence Line is directly plotted on the main price chart, offering traders a visual overlay that correlates directly with price action. This design choice enhances the usability of the indicator by allowing traders to see the divergence line’s relationship with the price in real-time, making it easier to spot potential buy and sell signals.
• By overlaying the divergence line on the main chart, the indicator provides a visual representation of momentum divergence, which is more intuitive and actionable compared to separate oscillators.
4. Trend Confirmation Using VWAP and EMA
• To increase the reliability of signals, the indicator incorporates a trend filter using both VWAP (Volume Weighted Average Price) and EMA (50-period). This filter ensures that signals are generated only when they align with the prevailing market trend:
• The VWAP is used to gauge the average price considering the volume, acting as a dynamic support/resistance level. It helps to confirm whether the market sentiment is bullish or bearish.
• The EMA (50-period) acts as a trend-following indicator, smoothing out price action and providing a clear signal of the overall trend direction.
• This dual-filter approach helps to eliminate false signals that may occur during choppy or sideways market conditions, ensuring that the generated signals are more aligned with the broader market trend.
5. Volume Correlation for Signal Validation
• The indicator integrates a volume filter to confirm the validity of momentum signals. It checks whether the current volume exceeds a threshold based on the average volume, ensuring that signals are only generated when there is strong market participation.
• This volume correlation check is vital because it validates price movements by confirming that they are backed by significant trading activity, reducing the likelihood of false signals in low-volume conditions.
6. Cooldown Mechanism: Controlling Signal Frequency
• To prevent excessive signals, especially during volatile or sideways market conditions, the indicator implements a cooldown period. This feature enforces a minimum number of bars between consecutive signals, reducing noise and preventing traders from being overwhelmed by frequent alerts.
• The cooldown mechanism enhances the signal quality, ensuring that each buy or sell signal is meaningful and not just a result of short-term fluctuations.
How the Components Work Together
The TimeFlow Momentum Indicator is a cohesive tool where each component plays a specific and complementary role:
1. Time Divergence Line identifies shifts in market momentum by analyzing the duration of trends.
2. EMA Smoothing refines the divergence data, providing a clearer signal by filtering out noise.
3. Trend Filter (VWAP + EMA) ensures that signals are generated in alignment with the prevailing market trend, reducing the risk of false signals.
4. Volume Filter validates signals based on trading activity, confirming that price movements are backed by strong volume.
5. Cooldown Mechanism controls the frequency of signals, preventing overtrading and reducing noise.
Conclusion
The “TimeFlow Momentum Indicator” is an innovative tool that offers a new way of analyzing market momentum by focusing on time-based divergence. It combines this original approach with trend and volume filters to create a reliable, user-friendly indicator that can help traders identify high-probability entry and exit points. This is not a simple mashup of existing indicators but a well-designed integration where each component enhances the overall functionality, providing traders with a unique edge in market analysis.
Directional Sentiment IndicatorThe Directional Sentiment Indicator is a versatile tool designed to capture price movements by combining several key technical elements, providing traders with actionable insights in volatile and trending markets. This script intelligently integrates price action analysis with the Average True Range (ATR) for precise target zones and directional signals.
Key Components & Their Roles:
1. Moving Averages and ATR Zones: The script utilizes custom high, low, open, and close averages over the selected period to gauge directional bias. By combining these averages with ATR, we define potential high and low targets dynamically, making it easier to visualize potential reversals.
2. Buy/Sell Signals Based on Price Proximity to Extremes: Using calculated price distances from highest/lowest points, the indicator identifies long and short signals when prices reach statistically significant deviations. This is designed to capture trend reversals or continuations at critical junctures, reducing noise from insignificant movements.
3. Highlighting Price Crossovers and Zones: The script plots boxes when price crosses above or below critical ATR levels, providing clear visual zones where price may experience increased resistance or support. This functionality helps users identify areas where market direction may shift.
4. Dynamic Plotting of Highs/Lows: With options to plot crossover and undershoot signals, traders can visually assess momentum shifts with green and red arrows for bullish and bearish crossovers respectively. This visual overlay enhances the trader’s ability to make quicker decisions.
This unique combination not only marks direction and key reversal areas but also provides context with ATR-based range boxes, making it an essential tool for traders seeking both clarity and precision in market movements.

Dynamic Linear CandlesDynamic Linear Candles is a unique and versatile indicator that reimagines traditional candlestick patterns by integrating customizable moving averages directly into candle structures. This dynamic approach smooths the appearance of candlesticks to better highlight trends and suppress minor market noise, allowing traders to focus on essential price movements.
Key Features:
1. Dynamic Candle Smoothing: Choose between popular smoothing types (SMA, EMA, WMA, HMA) to apply directly to each candle’s Open, High, Low, and Close values. This adaptive smoothing reveals hidden trends by refining price action into simplified, flowing candles, ideal for spotting subtle changes in market sentiment.
2. Signal Line Overlay: The signal line provides an additional layer of trend confirmation. Select from SMA, EMA, WMA, or HMA smoothing to match your trading style. The line dynamically changes color based on the price’s relative position, helping traders quickly identify bullish or bearish shifts.
3. Enhanced Candle Visualization: Candles adjust in color and opacity based on bullish or bearish trends, providing immediate visual cues about market momentum. The customized color and opacity settings allow for clearer distinction, especially in noisy markets.
Why This Combination?
This script is more than just an aesthetic adjustment; it’s a purposeful combination of moving averages and candle smoothing designed to enhance readability and actionable insights. Traditional candles often suffer from excessive noise in volatile markets, and this mashup addresses that by creating a smooth, flowing chart that adapts to the underlying trend. The Signal Line adds confirmation, acting as a filter for potential entries and exits. Together, these elements serve as a concise toolset for traders aiming to capture trend-based opportunities with clarity and precision.
