(LES/SES) Compliment Net Volume(LES/SES) Compliment Net Volume
(LES/SES) Compliment Net Volume is a volume-based confirmation tool designed to show whether buyers or sellers are truly in control behind the candles. It acts as a compliment to the Long Elite Squeeze (LES) and Short Elite Squeeze (SES) frameworks, giving traders a clearer view of momentum strength.
Note! {Short Elite Squeeze (SES) Will be released in the Future}
-Designed to take shorts opposite of the long trades from LES
🔹 Core Logic
Net Volume Calculation – Positive volume when price closes higher, negative when price closes lower.
Cumulative Smoothing – Uses a rolling SMA of cumulative differences to remove noise.
Color Coding –
Green → Buyer dominance
Red → Seller dominance
Gray → Neutral pressure
🔹 How to Use
Above zero (green) → Buyers dominate → supports long setups (LES).
Below zero (red) → Sellers dominate → supports short setups (SES).
Flat/gray → No clear pressure → signals caution or chop.
This makes it easier to confirm when market participation aligns with a potential entry or exit.
🔹 Credit
The Compliment Net Volume was developed by Hunter Hammond (Elite x FineFir) as part of the LES/SES system.
The concept builds on classic Net Volume and cumulative volume analysis principles shared by the TradingView community, but has been uniquely adapted into the LES/SES framework.
⚠️ Disclaimer: This is a framework tool, not financial advice. Use with proper risk management.
Netvolume

Signalgo S&DSignalgo S&D
Signalgo S&D is a next-generation indicator designed for traders who want to harness the true power of supply and demand (S&D) in their trading decisions. Unlike traditional S&D indicators, it leverages proprietary multi-timeframe net volume analysis, trend confirmation, and adaptive trade management.
How Signalgo S&D Works
Multi-Timeframe Net Volume Analysis
Net Volume Calculation: At the heart of Signalgo S&D is a unique net volume engine. It doesn’t just look at price or raw volume, but calculates a net volume value for each bar, factoring in both price movement and the true range of the candle. This is done across multiple timeframes—from 1 minute to 3 months—giving a layered, real-time view of market pressure.
Trend Measurement: The indicator tracks changes in net volume over a customizable trend length, identifying when buying or selling pressure is truly shifting.
Intelligent Signal Generation
Directional Shifts: Buy and sell signals are only considered when net volume flips from negative to positive (or vice versa) and the net volume trend confirms the move.
Multi-Timeframe Confirmation: Strong signals require agreement across several timeframes, filtering out noise and dramatically increasing reliability.
Volume & Momentum Filters: Each signal is further filtered using volume spikes, EMA alignment, and RSI momentum, ensuring that only high-quality, high-probability setups are flagged.
One-Time Event Detection: Signals are triggered only once per event, preventing repeated entries on the same move.
Adaptive Trade Management
Automated Entry/Exit Logic: Every trade signal is paired with a fully automated take-profit (TP), stop-loss (SL), and trailing stop system, all dynamically adjusted to current volatility.
Risk-Reward Scaling: Three profit targets (TP1, TP2, TP3) allow for scaling out or partial exits, while trailing stops lock in gains as the trade progresses.
Visual Feedback: All trade events—entries, exits, TPs, SLs—are clearly marked on the chart for transparency and review.
Inputs & User Controls
Preset Parameters:
Trend Length: Controls how sensitive net volume trend detection is.
Show Labels/Table: Visual toggles for displaying signal and trade management information.
Trade Management:
Show TP/SL Logic: Toggle to display or hide trade management levels.
ATR Length & Multipliers: Fine-tune how SL and TP levels adapt to market volatility.
Enable Trailing Stop: Activate or deactivate dynamic stop movement after TP1.
Entry & Exit Strategy
Entry Logic
Long (Buy) Entry: Triggered when net volume flips positive across multiple timeframes, the trend confirms, and all momentum/volume filters align.
Short (Sell) Entry: Triggered when net volume flips negative across multiple timeframes, with trend and momentum confirmation.
Exit & Trade Management
Stop Loss (SL): Automatically set based on recent volatility (ATR), adapting to the current market environment.
Take Profits (TP1, TP2, TP3): Three profit targets at increasing reward multiples, allowing for flexible trade management.
Trailing Stop: After TP1 is hit, the stop loss moves to breakeven and a trailing stop is activated to lock in further gains.
Event Markers: Each time a TP or SL is hit, a visual label is placed on the chart for full transparency.
Multi-Timeframe Synchronization: Instead of focusing on a single timeframe, this indicator requires confirmation across several, providing a market-wide perspective and filtering out false signals.
Dynamic, Adaptive Management: The built-in TP/SL and trailing logic is not static—it adapts to volatility and market conditions, providing a disciplined, automated approach to exits and risk.
Event-Driven, Not Static: Signals are only generated when all conditions align, and each event is marked only once, eliminating repetitive or redundant signals.
Advanced Filtering: Signals are filtered by volume spikes, EMA and RSI momentum, and trend alignment, ensuring only the highest-quality trades are considered.
Visual & Alert Integration: Every signal and trade event is visually marked and can trigger TradingView alerts, keeping you informed in real time.
Trading Strategy Application
Versatility: Suitable for scalping, day trading, swing trading, and even longer-term positions thanks to its multi-timeframe logic.
Systematic Execution: By automating entries, exits, and risk management, Signalgo S&D helps you trade with discipline and confidence, minimizing emotional bias.
Noise Reduction: The advanced, layered filtering logic means you only see the highest-probability setups, helping you avoid common S&D “fakeouts” and overtrading.

Volume Footprint Voids [BigBeluga]Volume Footprint Voids is a unique tool that uses lower timeframe calculation to plot different styles of single candle POC.
This indicator is very powerful for scalping and finding very precise entry and exits, spotting potential trapped traders, and more.
Unlike many other volume profiles, this aims to plot single candle profiles as well as their own footprints.
🔶 FEATURES
The script includes the following settings:
Windows: Plotting style and calculations
Coloring modes
Display modes
lower-timeframe calculations
🔶 CALCULATION
In the image above we can see how the script calculates each level position that will serve as a calculation process to see how much volume/closes there are within the levels.
In the image above, we can have a more clear example of how we count each candle close.
We use the prior screenshot as an example, after setting each level we will use the lower-timeframe input to measure the amount of closes within the ranges.
Depending on the lot size, the box will be larger or smaller, usually the POC will always have the highest box size.
NOTE: Size is the starting point, always from the low of the candle.
To find more voids, select a closer LTF to the current one you're using.
To find fewer voids, select a timeframe away from your current one.
Due to Pine Script limitations, we are only able to plot a certain amount of footprints, and we can't plot the whole history chart.
POC will be the largest block displayed, indicating the time point of control
Gray areas are closes above the average
Black are Void or imbalance that price will fill in the future, like FVG
The image above shows an incorrect size input that will lead to bad calculations, while on the other side, a correct size input that will lead to a clear vision and better calculation.
🔶 WINDOWS
The "▲▼" Mode will display delta buyers and delta sellers coloring with voids as black.
It also offers a gradient mode for a beautier visualization
The "Total Volume" mode will display the net volume within the lot size (closes within the levels).
This is useful to spot possible highest net volume within the same highest lot size.
The "POC + Gaps" will show both POC and Gaps as the highest block while all the rest will be considered as the smaller block.
This is useful to see where the highest lot were and if there are higher or lower imbalances within the candle
The last option "Gaps" will simply display the gaps as the highest block, while the POC as the lowest block.
This is useful to have a better view of the gaps areas
🔶 EXAMPLE
This is one of the most basic examples of how this script can be used. POC at the bottom creating a strong support area as price holds and creates higher voids gap that price fills while rising.
🔶 SETTINGS
Users have full control over the script, from colors to choosing the lower-timeframe inputs to disabling the lot size.

Directional Volume EStimate from Price Action (RedK D_VESPA)The "Directional Volume EStimate from Price Action (RedK D_VESPA)" is another weapon for the VPA (Volume Price Analysis) enthusiasts and traders who like to include volume-based insights & signals to their trading. The basic concept is to estimate the sell and buy split of the traded volume by extrapolating the price action represented by the shape of the associated price bar. We then create and plot an average of these "estimated buy & sell volumes" - the estimated average Net Volume is the balance between these 2 averages.
D_VESPA uses clear visualizations to represent the outcomes in a less distracting and more actionable way.
How does D_VESPA work?
-------------------------------------
The key assumption is that when price moves up, this is caused by "buy" volume (or increasing demand), and when the price moves down, this is due to "selling" volume (or increasing supply). Important to note that we are making our Buy/sell volume estimates here based on the shape of the price bar, and not looking into lower time frame volume data - This is a different approach and is still aligned to the key concepts of VPA.
Originally this work started as an improvement to my Supply/Demand Volume Viewer (V.Viewer) , I ended up re-writing the whole thing after some more research and work on VPA, to improve the estimation, visualization and usability / tradability.
Think of D_VESPA as the "Pro" version of V.Viewer -- and please go back and review the details of V.Viewer as the root concepts are the same so I won't repeat them here (as it comes to exploring Balance Zone and finding Price Convergence/Divergence)
Main Features of D_VESPA
--------------------------------------
- Update Supply/Demand calculation to include 2-bar gaps (improved algo)
- Add multiple options for the moving average (MA type) for the calculation - my preference is to use WMA
- Add option to show Net Volume as 3-color bars
- Visual simplification and improvements to be less distracting & more actionable
- added options to display/hide main visuals while maintaining the status line consistency (Avg Supply, Avg Demand, Avg Net)
- add alerts for NetVol moving into Buy (crosses 0 up) or Sell (crosses 0 down) modes - or swing from one mode to the other
(there are actually 2 sets of alerts, one set for the main NetVol plot, and the other for the secondary TF NetVol - give user more options on how to utilize D_VESPA)
Quick techie piece, how does the estimated buy/sell volume algo work ?
------------------------------------------------------------------------------------------
* per our assumption, buy volume is associated with price up-moves, sell volume is associated with price down-moves
* so each of the bulls and bears will get the equivalent of the top & bottom wicks,
* for up bars, bulls get the value of the "body", else the bears get the "body"
* open gaps are allocated to bulls or bears depending on the gap direction
The below sketch explains how D_VESPA estimates the Buy/Sell Volume split based on the bar shape (including gap) - the example shows a bullish bar with an opening gap up - but the concept is the same for a down-bar or a down-gap.
I kept both the "Volume Weighted" and "2-bar Gap Impact" as options in the indicator settings - these 2 options should be always kept selected. They are there for those who would like to experiment with the difference these changes have on the buy/sell estimation. The indicator will handle cases where there is no volume data for the selected symbol, and in that case, it will simply reflect Average Estimated Bull/Bear ratio of the price bar
The Secondary TF Est Average Net Volume:
---------------------------------------------------------
I added the ability to plot the Estimate Average Net Volume for a secondary timeframe - options 1W, 1D, 1H, or Same as Chart.
- this feature provides traders the confidence to trade the lower timeframes in the same direction as the prevailing "market mode"
- this also adds more MTF support beyond the existing TradingView's built-in MTF support capability - experiment with various settings between exposing the indicator's secondary TF plot, and changing the TF option in the indicator settings.
Note on the secondary TF NetVol plot:
- the secondary TF needs to be set to same as or higher TF than the chart's TF - if not, a warning sign would show and the plot will not be enabled. for example, a day trader may set the secondary TF to 1Hr or 1Day, while looking at 5min or 15min chart. A swing/trend trader who frequently uses the daily chart may set the secondary TF to weekly, and so on..
- the secondary TF NetVol plot is hidden by default and needs to be exposed thru the indicator settings.
the below chart shows D_VESPA on a the same (daily) chart, but with secondary TF plot for the weekly TF enabled
Final Thoughts
-------------------
* RedK D_VESPA is a volume indicator, that estimates buy/sell and net volume averages based on the price action reflected by the shape of the price bars - this can provide more insight on volume compared to the classic volume/VolAverage indicator and assist traders in exploring the market mode (buyers/sellers - bullish/bearish) and align trades to it.
* Because D_VESPA is a volume indicator, it can't be used alone to generate a trading signal - and needs to be combined with other indicators that analysis price value (range), momentum and trend. I recommend to at least combine D_VESPA with a variant of MACD and RSI to get a full view of the price action relative to the prevailing market and the broader trend.
* I found it very useful to take note and "read" how the Est Buy vs Est Sell lines move .. they sort of "tell a story" - experiment with this on your various chart and note the levels of estimate avg demand vs estimate avg supply that this indicator exposes for some very valuable insight about how the chart action is progressing. Please feel free to share feedback below.

[VWMA] Net Volume LibraryLibrary " Net Volume Library"
TODO: The underlying logic and function that calculates the net volume for the Net Volume indicator. Exposes the nv function and nvPoint fields for use.
nv(src, length, useVwma, offset, sigma, multHigh, multMed, multLow)
Parameters:
src : (float) The source price value
length : (int) The lookback length
useVwma : (bool) To use VWMA in the calculation or not
offset : (float) The ALMA offset value
sigma : (int) The ALMA sigma value
multHigh : (float) The multiplier high band
multMed : (float) The multiplier medium band
multLow : (float) The multiplier low band
Returns: Returns the calculated net volume for each band in an nvPoint object
nvPoint
Fields:
h2
h1
h
n
l
l1
l2

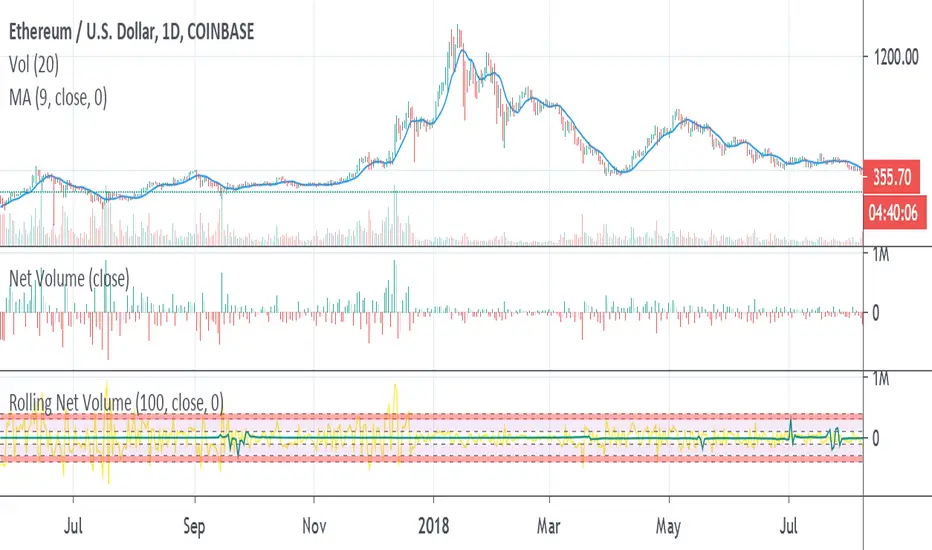
Rolling Net VolumeMay still make changes, the current study should be helpful as is. Looking to highlight potential relative trend exhaustion in net volume. Should be most effective for stable supply assets. We're looking at an 100 day moving average of net volume essentially. The values of the RNV are slightly exaggerated to help with visibility PLEASE bear this in mind. Never the less, you can look at many commodities and notice moderate and extreme trend exhaustion on the positive and negative side using the transparent bands above and below. The less transparent red band perhaps suggests an opportunity to open a position against the current direction. It's not perfect, I may try to improve it. I am definitely open to feedback and appreciate it very much in advance.
[Xzhi] Net VolumeUse net volume to find areas of reversal. This is not meant to be used on its own, and requires others tools, but it is helpful in identifying possible points of entry. Area's with lots of market participants could signify a reversal, depending on the positions entered.
Edit the source code to suit the currency pair you are trading.

