Pine Script® göstergesi
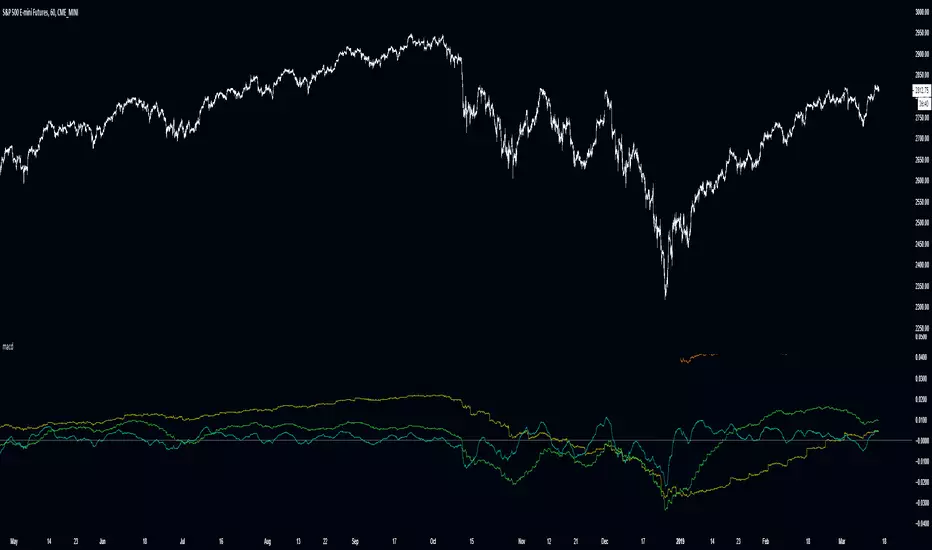
N-macd
Pine Script® göstergesi
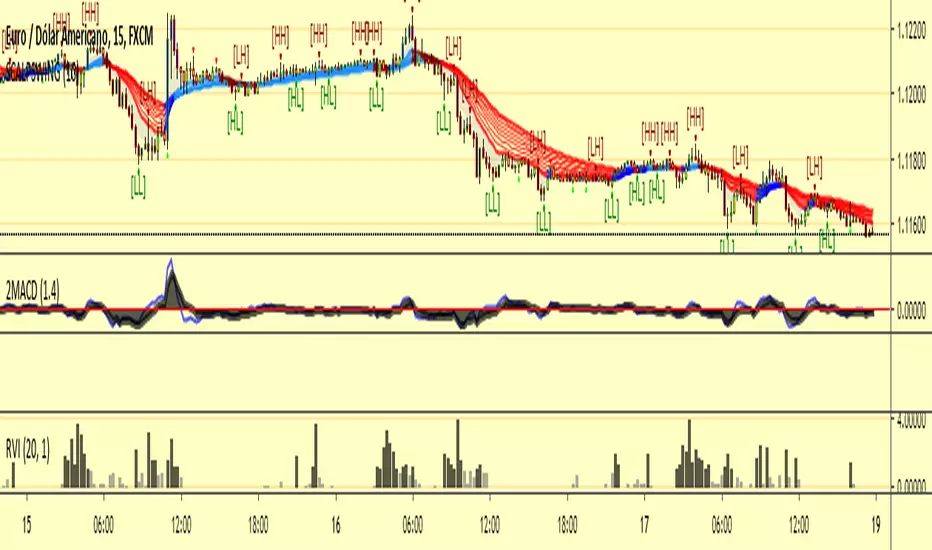
2 MACDGrato ao LazyBear, pela base do indicador, que modifiquei para facilitar o entendimento dos movimentos.
Pine Script® göstergesi

BOSS Zero-Lag Dynamic MACDTHE BEST FOREX, BINARY OPTIONS, AND CRYPTO INDICATORS FOR TRADINGVIEW.COM
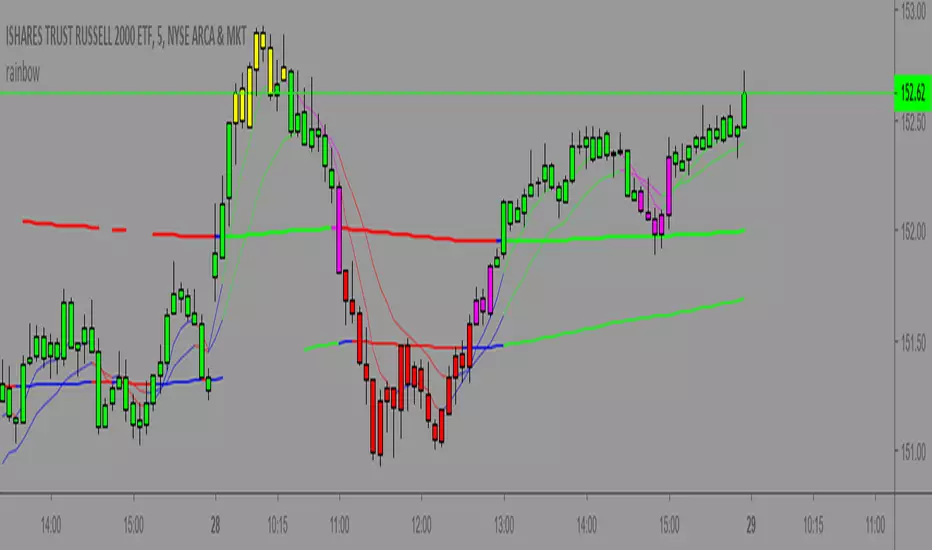
Our MACD is a Zero-Lag (well near zero-lag) We make this claim because MACD utilizes Moving Averages and as you know moving averages are lagging indicators.
For our MACD we utilize The McGinley Dynamic which looks like a moving average line yet it is a smoothing mechanism for prices that turns out to track far better than any moving average.
The McGinley Dynamic minimizes price separation, price whipsaws and hugs prices much more closely.
The McGinley Dynamic does this automatically as this is a factor of the formula.
Because of the calculation, the Dynamic Line speeds up in down markets as it follows prices yet moves more slowly in up markets.
As traders we want to be quick to sell in a down market, yet ride an up market as long as possible.
Source: Investopedia.com
Chart Image shows conventional MACD on Bottom and BOSS Zero-Lag Dynamic MACD on top
Available at: bosscripts.com
Pine Script® göstergesi

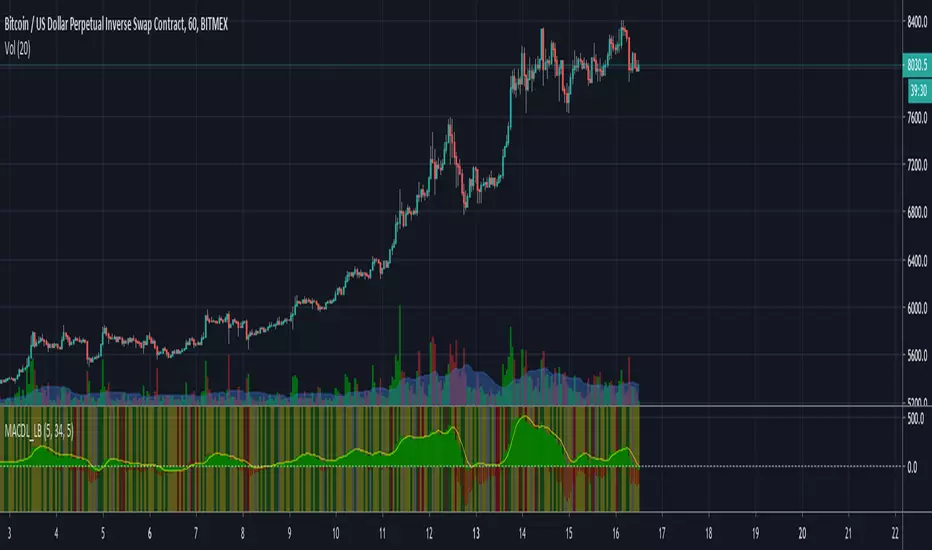
MACD LB MFIThis script includes MACD histogram plus MFI in four states
All backgrounds are compared to previous bar in +/- 10%
1. Green (green) + Volume + Range (++)
2. Fading (yellow) - Volume - Range (--)
3. False (gray) - Volume + Range (-+)
4. Crouching (red) + Volume - Range (+-)
Pine Script® göstergesi
Koba_MACD indicator-ver1This is "Kobayashi's Moving Average Convergence Divergence" indicator.
The short name is "Koba_MACD".
Custom MACD based on KobaMA.
Pine Script® göstergesi

MACD phi³Esse script possui 6 MACD configurados com o Phi³ e um sistema para encontrar as divergências em cada linha sendo impresso na vela o H1, H2, H3, H4, H5 e H6, os tempos de 17 velas até 610, já ajustado para mostrar em 72 minutos, pode por em qualquer tempo, mas tempos menores ele irá duplicar a impressão dos dados, ex: se por em 17 ou 15 minutos, irá aparecer 4 velas com os avisos, pois irá dividir o tempo.
Foi testado com o BTCUSD, não sei a eficiência com outras moedas, fiquem a vontade pra comentar e criticar.
OBS: Não me responsabilizo por eventuais falhas do script ou perdas, é uma ferramenta em fase de teste.
Pine Script® göstergesi

Pine Script® göstergesi

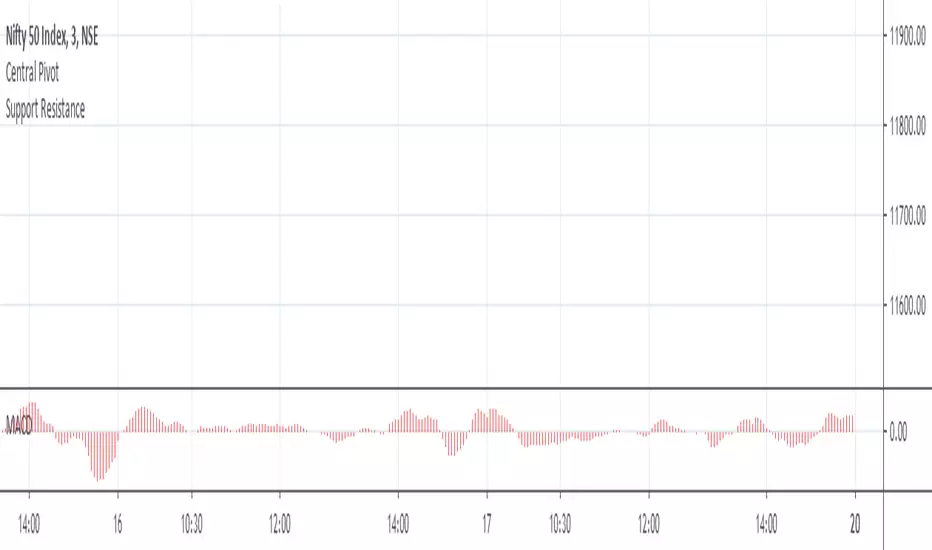
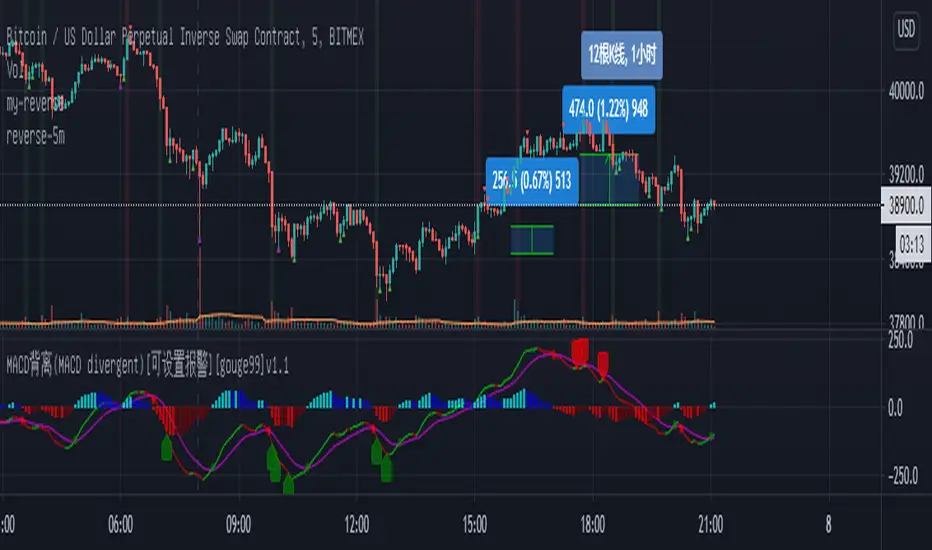
MACD背离(MACD divergent)[公开版][gouge99]注意:背离意味着做反转交易,所以入场要求很高,但是背离一般的收益风险比很大
MACD背离:收盘价创造新高或者新低,但是macd却没有出新高或者新低
计算原理:根据历史K线长度(默认90根K线)来判断收盘价的高低极值和macd的高低极值来进行比较判断
建议使用:
1.在震荡调整行情中,在支撑和压力位附近出现的突然的趋势K线,一般是假突破
2.在趋势末端,一般还会有一次缓慢的测试趋势极点的行情,一般这是趋势反转进入震荡的开始
3.结合其他形态如双顶,头肩,pin bar
4.结合其他指标如stoch随机指标做反转
5.推荐在1h, 30m, 15m级别中使用,5m也可以使用,但是最好背离计算长度设置大一点 比如150
Pine Script® göstergesi
Linear Quadratic Convergence Divergence OscillatorIntroduction
I inspired myself from the MACD to present a different oscillator aiming to show more reactive/predictive information. The MACD originally show the relationship between two moving averages by subtracting one of fast period and another one of slow period. In my indicator i will use a similar concept, i will subtract a quadratic least squares moving average with a linear least squares moving average of same period, since the quadratic least squares moving average is faster than the linear one and both methods have low-lag this will result in a reactive oscillator.
LQCD In Details
A quadratic least squares moving average try to fit a quadratic function (parabola) to the price by using the method of least squares, the linear least squares moving average try to fit a line. Non-linear fit tend to minimize the sum of squares in non-linear data, this is why a quadratic method is more reactive. The difference of both filters give us an oscillator, then we apply a simple moving average to this oscillator to provide the signal line, subtracting the oscillator and its signal line give us the histogram, those two last steps are the same used in the MACD.
Length control the period of the quadratic/linear moving average. While the MACD use a signal line for plotting the histogram i also added the option to plot the momentum of the quadratic moving average instead, the result is smoother and reduce irregularities, in order to do so just check the differential option in the parameter box.
The period of the signal line and the momentum are both controlled by the signal parameter.
A predictive approach can be made by subtracting the histogram with the signal line, this process make the histogram way more predictive, in order to do so just check the predictive histogram option in the parameter box.
Predictive histogram with simple histogram option. The differential mode can also be used with the predictive parameter, this result in a smoother but less reactive prediction.
Information Interpretation
The amount of information the MACD can give us is high. We can use the histogram as signal generator, or the if the oscillator is over/under 0, combine the oscillator/signal line with histogram, combinations can provide various systems. Some traders use the histogram as signal generator and use the cross between the histogram and the signal line as a stop signal, this method can avoid some whipsaw trades. The study of divergences with the price is also another method.
Conclusion
This oscillator aim to show the same amount of information as the MACD with a similar calculation method but using different kind of filters as well as eliminating the need to use two separates periods for the moving averages calculation, its still possible to use different periods for the quadratic/linear moving average but the results can be less accurate. This indicator can be used like the MACD.
Pine Script® göstergesi

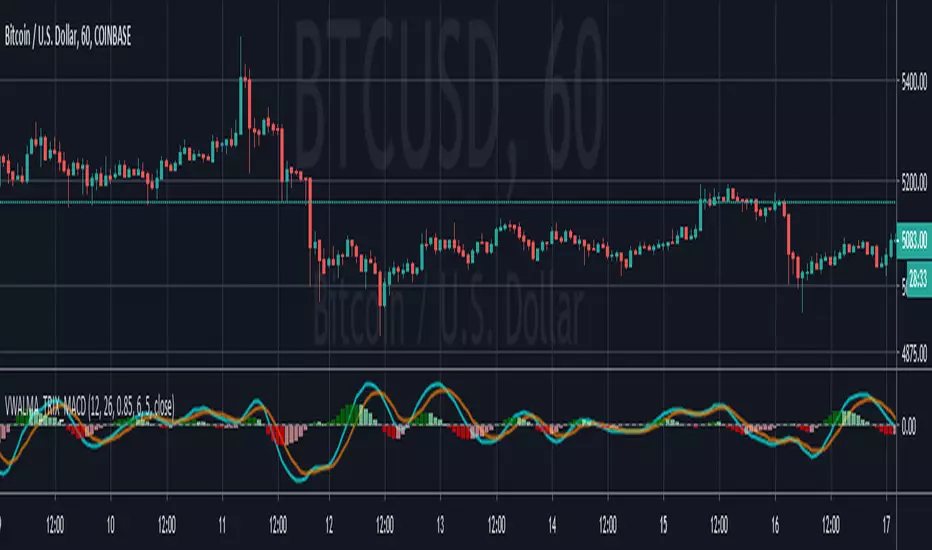
Volume Weighted ALMA TRIX MACDMACD constructed using volume weighted(optional) ALMA TRX
---------------------------------------
If you find it useful please consider a tip/donation :
BTC - 3BMEXEDyWJ58eXUEALYPadbn1wwWKmf6sA
Pine Script® göstergesi
Awesome Oscillator and MACD Histogram by SierraPilot (Lemrin)This is an indicator I stole from Lemrin. I added the plots for the MACD line and the Signal line and also changed the AO and MACD histo to an area plot. MACD = red and green. AO = blue and yellow. Green over top of Blue = possible reversal. Green overlaid over blue = uptrend. Yellow over top of Red = downside reversal possible. Yellow overlaid over Red = downtrend in progress. MACD and Signal line behave normally. Thanks to Lemrin for the majority of the code.
Pine Script® göstergesi

Pine Script® göstergesi
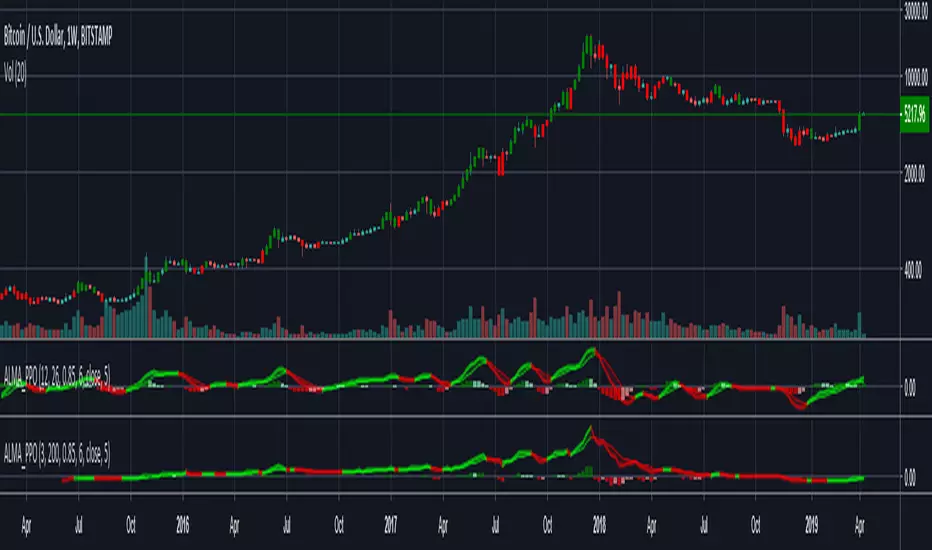
ALMA PPO - Percentage Price OscillatorSimple redo of PPO using ALMA
-------------------------------------------------------------------------------------------------------------------------------------------
If you find it useful please consider a tip/donation : BTC - 3BMEXEDyWJ58eXUEALYPadbn1wwWKmf6sA
Pine Script® göstergesi
Multi-indicador MACD/RSI/volumen en ventanaComplemento para el otro indicador que ya publiqué.
En esta caso añado las gráficas de MACD, RSI y volumen en una sola ventana.
El problema para esto es el escalado de las gráficas del MACD y el volumen para que entren en una escala de 1 a 100 para lo que tomo los máximos y mínimos de 500 velas (este valor se puede cambiar).
Adicionalmente, coloreo el macd de verde cuando sobrepasa a la señal o de rojo cuando va por debajo y lo mismo con el rsi.
Añado el volumen a todo esto, también escalado.
Pine Script® göstergesi

SMA/pivot/Bollinger/MACD/RSI en pantalla gráficoMulti-indicador con los indicadores que empleo más pero sin añadir ventanas abajo.
Contiene:
Cruce de 3 medias móviles
La idea es no tenerlas en pantalla, pero están dibujadas también. Yo las dejo ocultas salvo que las quiera mirar para algo.
Lo que presento en pantalla es la media lenta con verde si el cruce de las 3 marca alcista, amarillo si no está claro y rojo si marca bajista.
Pivot
Normalmente los tengo ocultos pero los muestro cuando me interesa. Están todos aunque aparezcan 2 seguidos.
Bandas de Bollinger
No dibujo la línea central porque empleo la media como tal.
Parabollic SAR
Lo empleo para dibujar las ondas de Elliott como postula Matías Menéndez Larre en el capítulo 11 de su libro "Las ondas de Elliott". Así que, aunque se puede mostrar, lo mantengo oculto y lo que muestro es dónde cambia (SAR cambio).
MACD
No está dibujado porque necesitaría sacarlo del gráfico.
Marco en la parte superior cuándo la señal sobrepasa al MACD hacia arriba o hacia abajo con un flecha indicando el sentido de esta señal.
RSI
Similar al MACD pero en la parte inferior.
Probablemente, programe otro indicador para visualizar en una ventanita MACD, RSI y volumen todo junto. El volumen en la principal hay veces que no te permite ver bien alguna sombra y los otros 2 te quitan mucho espacio para graficar si los tienes permanentemente en 2 ventanas separadas.
Pine Script® göstergesi
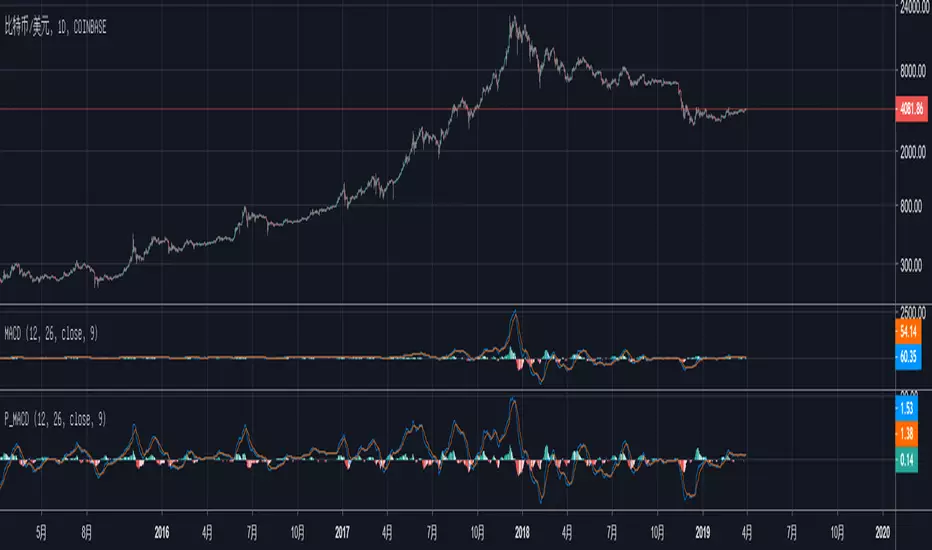
Percentage MACDPercentage MACD number range won't change with the great price change.
Convenient for log scale.
Pine Script® göstergesi
Helios v1.0 - by @cryptomrdavis -1.0
This is another indicator for you guys. From different indicators its get the signals and combines them into one.
Green marks an uptrend and red an downtrend.
Happy trading
+++ use this tool on your own risk. i'm not responsible for your loses. DYOR +++
____________________________________________________________________________
BTC: 1GVRDK3HHr9CKM5SF2CGpCNXFuavB3L4j9
ETH: 0x7b825fa752b9926D3E8397cDb1d9E5473D074646
XMR: 41zL2SQS7zyZmwXKng2TeUWsMi5vMmkgSdDCjULUTvM6ichwm1E2ZDEYGt56zk9ghoM9bekhjycSwa8amtTcB2JiUet5jtg
NEO: AXja5xPDhczfm2ujHyBfpkQAAnMsXsazmb
TRX: THi1L1v2wHJxmQg6Wk9TgkKLcP6x2oMAwf
ZEC: zcZzFkRx95cp7MtuW8wLhC5zz5RYF9QkT2uPPmhZZHc6ppXepHGgCSeAS1rtD6WFdqsM5p1gZm2gfirnrnviucsdP4aCpqU
XLM: GAXUQJSW55C7MAC4GI26NZUGIKSHFDVFRFKZCXPLMPY4HCADSDT55XK6
WAVES: 3PCMkNpMHxSraTCkwV1ENcBKa9sXbVCGjQX
BCH: qz57n04ud6mn42u00aymqkku8tfh0lk4jv9c28mjvv
tippin.me
____________________________________________________________________________
Pine Script® göstergesi

Pine Script® göstergesi
Improved MACDImproved MACD with 12 filter to chose from including sine wave , zero lag, hull ,regression and similar . Designed for better and smoother signal generation and flexibility
Pine Script® göstergesi
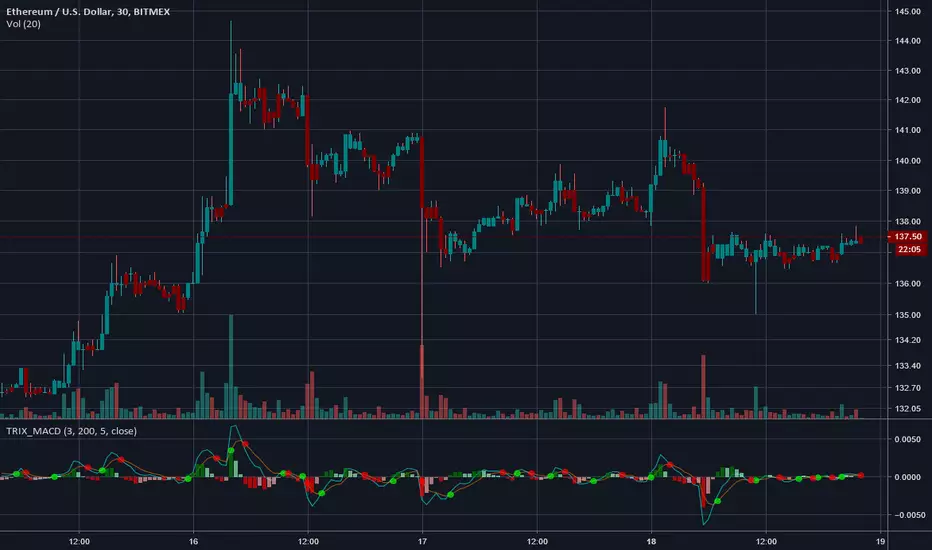
TRIX MACDAn experiment using TRIX to construct a MACD instead of the standard EMAs.
Warning - colors bars (can be disabled in settings)
Optional volume weighting.
-----------------------------------------------------------------------------------
If you find it useful please consider a tip/donation : BTC - 3BMEXEDyWJ58eXUEALYPadbn1wwWKmf6sA
Pine Script® göstergesi
Pine Script® göstergesi

Improved Multi-Timeframe (MTF) MACD - plots same as live dataThis multi-timeframe MACD uses an improved calculation to accurately calculate the indicator's value with every new bar on the time frame your chart is set to. Previously the indicator only recalculated with every new update on the timeframe used in its security function. This means that this improved script plots the real, current value of your indicator across your chosen timeframes on your chart's resolution and no longer only plots only the indicator's monthly/weekly/daily/4 hour/ect closing value on the your chart.
Input values are fixed to their default (close,12,26) configuration to make this indicator's improved calculation possible.
When using "Plot Higher Timeframe?" the script will set the indicator to only plot its value in closest larger timeframe. This option overrides the two following options. For example, when using the daily resolution, only the weekly value will plot, or when using the one hour (60m) resolution, only the 4 hour (240m) value will plot.
The "Omit Higher Timeframes?" option will set the indicator to only plot starting from the 1/2/3/4/5/6/7th closest larger timeframe. For example, when using the daily resolution and this option set to 0, all values from the weekly resolution and up will plot, but if set to 1, all values from the monthly resolution and up will plot instead.
The "Plot Yearly/Quarterly/Monthly/Weekly/Daily/4 Hour/1 Hour/15 Minute/5 Minute?" options allow enabling/disabling a specific timeframe. All are enabled by default. For example, if you do not want the yearly value of the indicator to ever plot, you can disable the "Plot Yearly?" option.
Pine Script® göstergesi