Pine Script® göstergesi
N-macd

Pine Script® göstergesi
MACD Profit CandlesThis tool is simple yet very effective. It creates new candles on the chart based on the MACD.
Candles are green when MACD is increasing and red when it is decreasing. All lengths can be adjusted in the input menu and there is an option to plot the signal line.
The rules for using it are pretty simple:
1.Buy on Green
2.Sell on red
~Happy Trading~
Pine Script® göstergesi

Pine Script® göstergesi
RSI & MACDJust combined the template RSI and MACD scripts from the pine library and it seems to work better in pine version 4 :) ty tradingview!
Pine Script® göstergesi

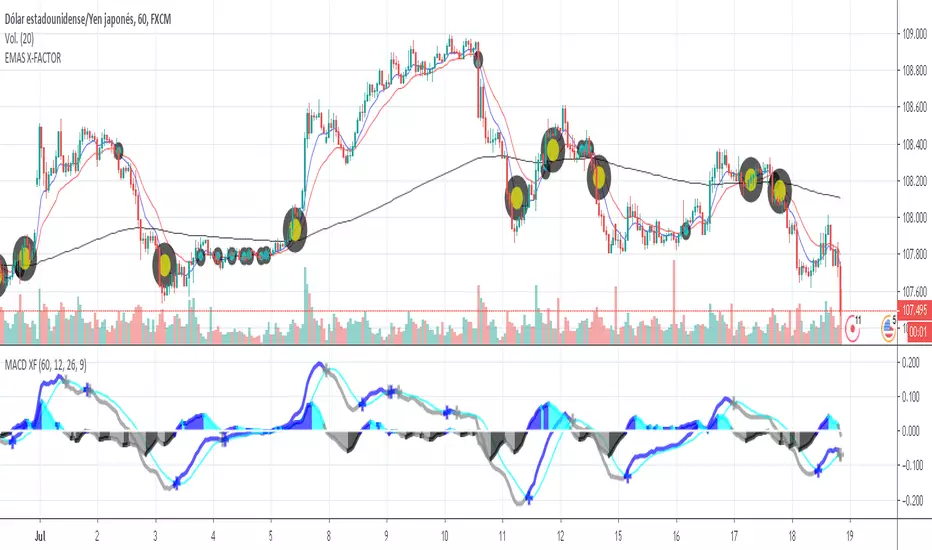
Macd X-FACTOReste indicador consiste en el trazado de dos líneas. La línea Convergencia Divergencia de la Media Móvil mas conocida como MACD es la diferencia entre dos medias móviles exponenciales y la línea de disparo es una media móvil exponencial de la diferencia. Si las líneas MACD se cruzan, entonces se toma como una señal de que es muy probable un cambio de tendencia. El indicador en cuestión nos marcará una cruz azul cuando haya dicho cruce y se genere una tendencia alcista asi como también nos marcara cuando haya un cruce y se genere una tendencia bajista, cruz gris se vende, cruz azul se compra.
Pine Script® göstergesi
Pine Script® göstergesi

[YC]-MACDIntegrated two level MACD into one, when the two MACD cross over zero line, it is a signal for buy.
Pine Script® göstergesi

Pine Script® göstergesi

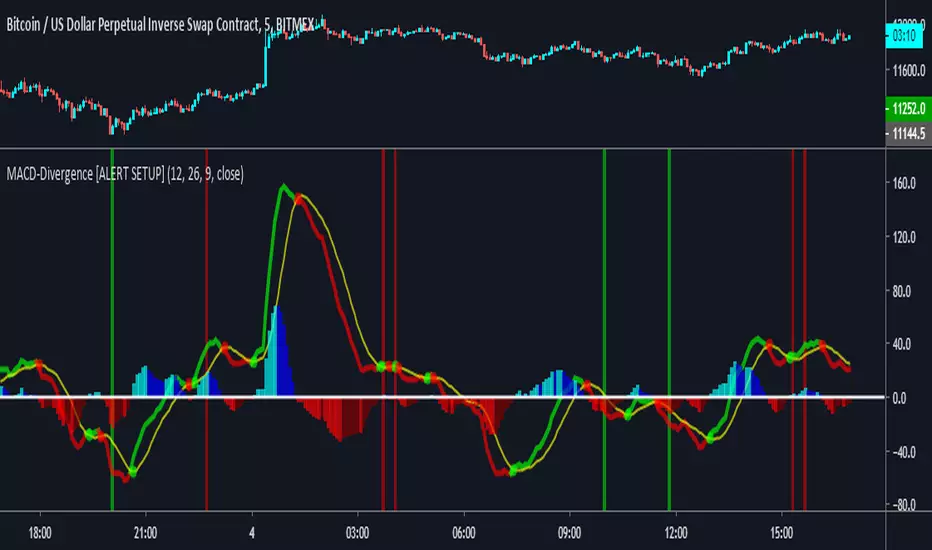
MACD Divergence [ALERTSETUP]A request I thought would be useful to code.
Very simple script that allows to create alerts on MACD divergences, based on @wanliyu script.
I also removed the security function to avoid repainting.
Red background is bearish divergence and green background is bullish divergence.
Enjoy !
Pine Script® göstergesi
LC - Adaptative MACD 1.0MACD that doesn't depend on any period. Is based on Elliot Cycles and It takes different levels of elliot cycles to form the MACD.
Pine Script® göstergesi

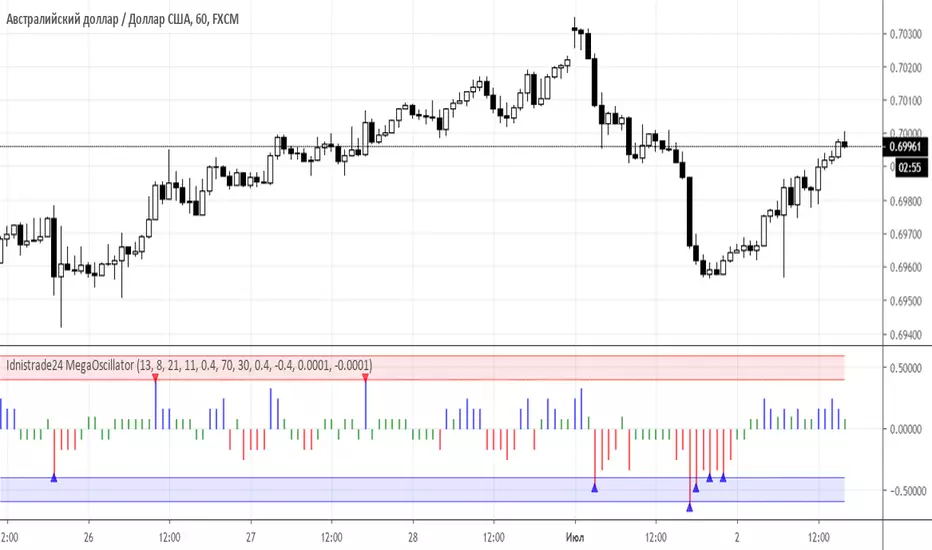
Idnistrade24 MegaOscillator Indicator“Idnistrade24 MegaOscillator” Indicator
Class : oscillator
Trading type : any
Time frame : any
Purpose : detection of trend reversal points
Level of aggressiveness : any
"Idnistrade24 MegaOscillator" indicator is designed to detect the trend reversal points. The class of technical indicators, which is responsible for determining the reversal points of the current trend, are oscillators. At the moment there are hundreds of different variations of oscillators. The idea that formed the basis for creating the “Idnistrade24 MegaOscillator” is to obtain a synergistic effect from the use of the best oscillator techniques.
“Idnistrade24 MegaOscillator” indicator is a symbiosis of such techniques as autoregression analysis, range trading, RSI, ROC, MACD, which results in obtaining the integral value of the current overbought/oversold level in the market.
Based on the overbought/oversold level in the market, “Idnistrade24 MegaOscillator” indicator independently generates buy / sell signals and displays them in the indicator window.
Structure of the indicator
Indicator consists of the following elements:
- the mega-oscillator histogram – is presented in three colors: blue (the market is overbought), red (the market is oversold) and green (there are no serious deviations from the fair price);
- red zone – indication of an extreme overbought zone. Entry into this zone is a signal to close long positions and search for points to sell asset;
- blue zone - indication of an extreme oversold zone. Entry into this zone is a signal for closing short positions and search points to buy asset.
Parameters of the indicator
To configure the indicator, the following parameters are provided:
- periodRSI (default value is 13) - period for calculating the RSI oscillator.
- periodROC (default value - 8) - period for calculating the ROC oscillator.
- periodRanger (default value - 21) - period for calculating the range in range trading.
- periodReg (default value - 11) - period for the calculation of autoregression.
- signals (default is 0.4) - the parameter used to control the frequency of signals. The lower it is, the more signals the indicator will generate.
- overboughtRSI (the default value is 70) - the parameter defining the overbought zone for the RSI indicator.
- overboughtRSI (the default value is 30) - the parameter that determines the border of the oversold zone for the RSI indicator.
- overboughtROC (the default value is 0.4) - the parameter defining the overbought zone for the ROC indicator.
- overboughtROC (the default value is -0.4) —the parameter that determines the oversold zone for the ROC indicator.
- overboughtMACD (default value - 0.0001) - the parameter that determines the overbought zone for the MACD indicator.
- overboughtMACD (the default value is -0.0001) is the parameter that determines the oversold zone for the MACD indicator.
Rules of trading
The main task of the trader when working with this indicator is to monitor the color of the histogram and its position relative to the extreme zones. Entering the red zone is a signal for closing long positions and finding points for selling assets. Entering the blue zone is a signal for closing short positions and finding points for asset purchases.
The appearance of a blue triangle on the histogram is a buy aignal, and a red triangle is a sell signal.
Pine Script® göstergesi
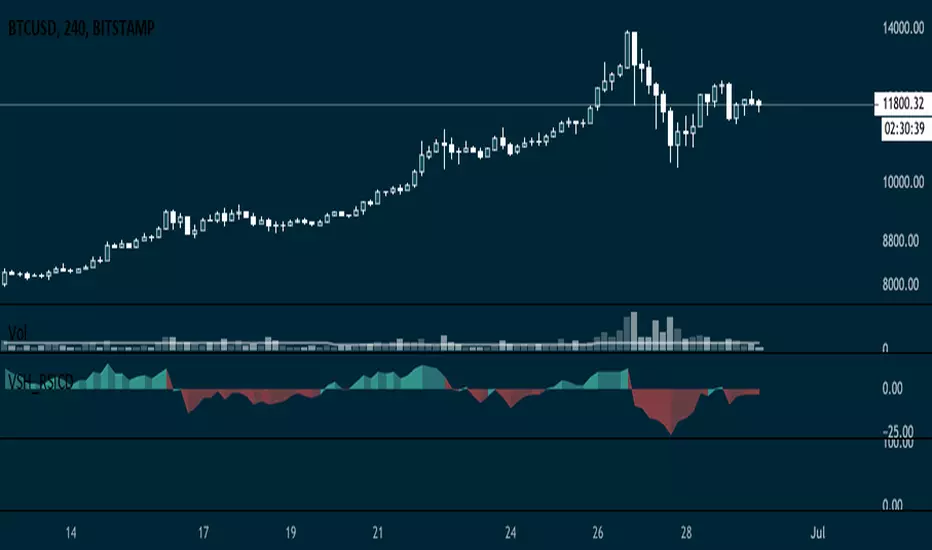
VSH_RSICDRSI Convergence Divergence Histogram (only) inspired by VSH_RSI and traditional MACD but purely based on RSI.
Not only does decent job capturing momentum transition (base cross) but can also be used to identify cleaner divergences.
Pine Script® göstergesi
MACD%% + FISHER TRANSFORMATIONThe MACD but instead of showing the RAW Value(12ema - 26ema) it is showing us the percentage diffrence between the ema's.
Also the fisher transformation is included. Sadly the fisher is not working on low Satoshi Altcoincharts.
Pine Script® göstergesi
Pine Script® göstergesi

Waddah Attar Explosion V2 [SHK]Hey everyone
I have modified Waddah Attar Explosion indicator to work in low price markets like crypto as well as any other market. So now the DeadZone line is based on ATR instead of a fixed number. Nothing more changed and all credits goes to it's MT4 developer and LazyBear (Main Script Link) .
Hope you enjoy!
Read the main description below...
- - - - - - - - - - - - - - - - - - - - - - - - - - - - - - - - - - - - - - -
This is a port of a famous MT4 indicator. This indicator uses MACD/BB to track trend direction and strength. Author suggests using this indicator on 30mins.
Explanation from the indicator developer:
"Various components of the indicator are:
Dead Zone Line: Works as a filter for weak signals. Do not trade when the red or green histogram is below it.
Histograms:
- Red histogram shows the current down trend.
- Green histogram shows the current up trend.
- Sienna line shows the explosion in price up or down.
Signal for ENTER_BUY: All the following conditions must be met.
- Green histo is raising.
- Green histo above Explosion line.
- Explosion line raising.
- Both green histo and Explosion line above DeadZone line.
Signal for EXIT_BUY: Exit when green histo crosses below Explosion line.
Signal for ENTER_SELL: All the following conditions must be met.
- Red histo is raising.
- Red histo above Explosion line.
- Explosion line raising.
- Both red histo and Explosion line above DeadZone line.
Signal for EXIT_SELL: Exit when red histo crosses below Explosion line.
All of the parameters are configurable via options page. You may have to tune it for your instrument.
Pine Script® göstergesi

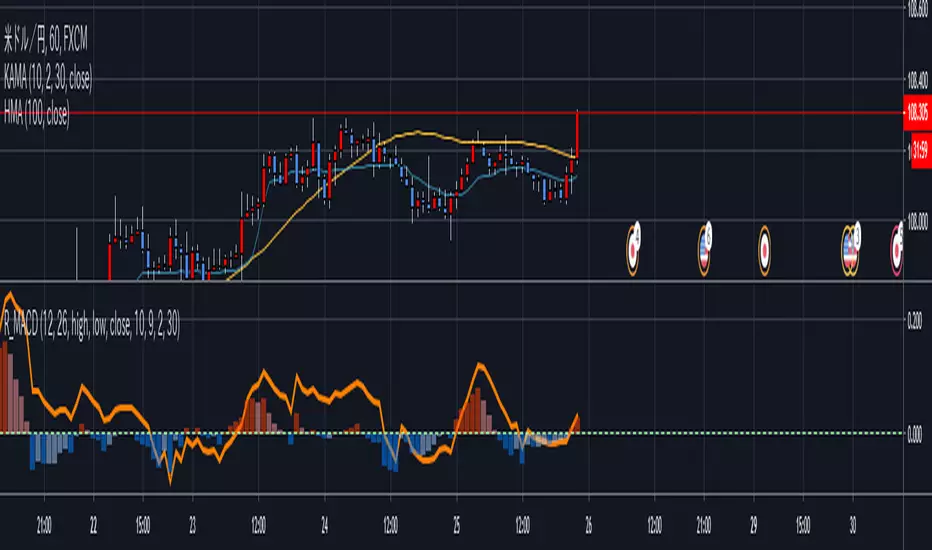
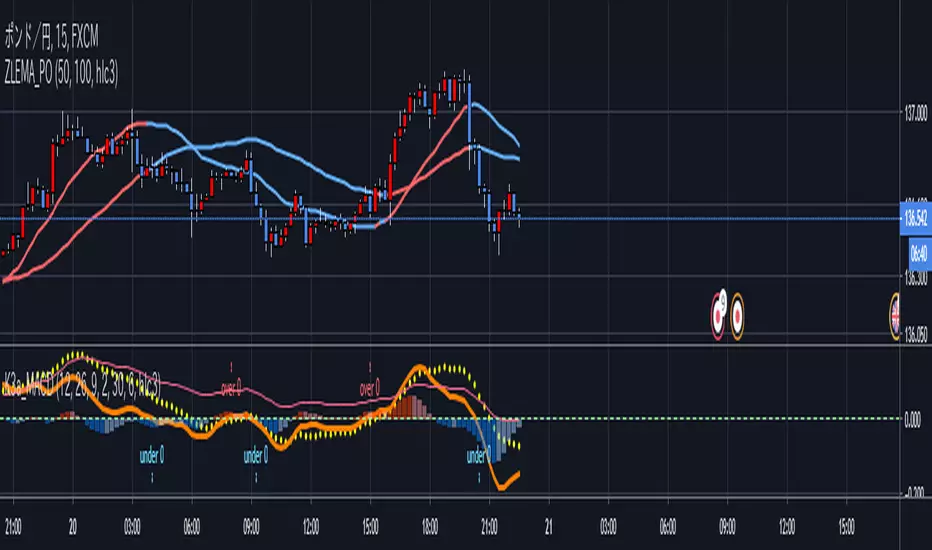
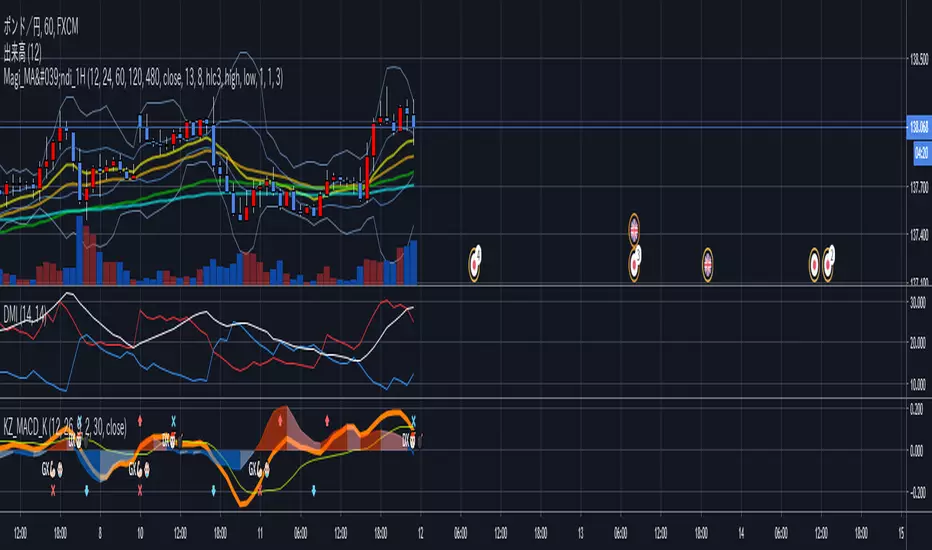
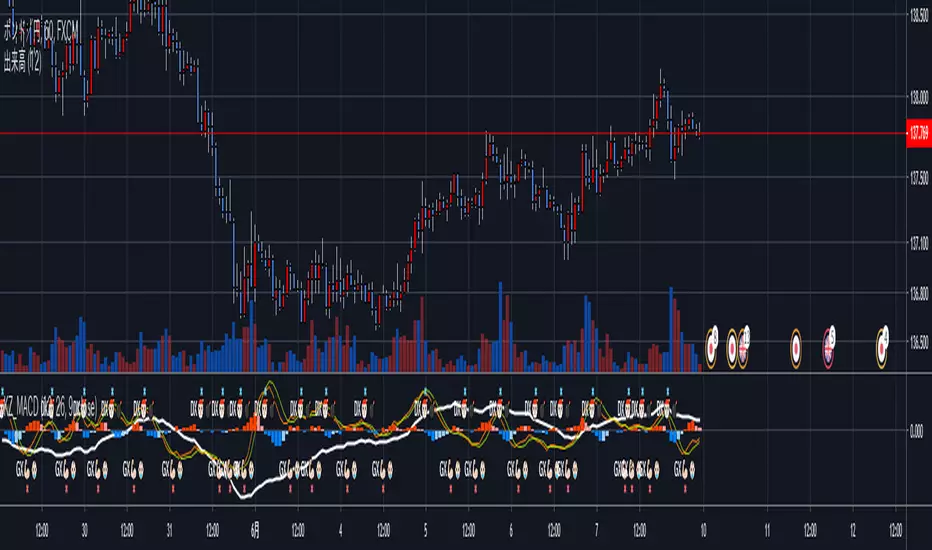
Koby's 3 average MACD indicatorThis MACD is averaging 3 different MACD; KAMA MACD, ZLEMA MACD, and normal MACD.
Can find easier MACD's divergence and convergence than normal MACD.
And more smoothly drawing than ZLEMA MACD (KZ_MACD) which is I've made before.
Pine Script® göstergesi
Koby's ZLEMA MACD and KAMA signalUsing zero lag ema for MACD line, and using KAMA for MACD's signal line.
Test version.
This has MACD and signal cross alert, and 0 line alert.
Pine Script® göstergesi
Pine Script® göstergesi
Pine Script® göstergesi

Pine Script® göstergesi

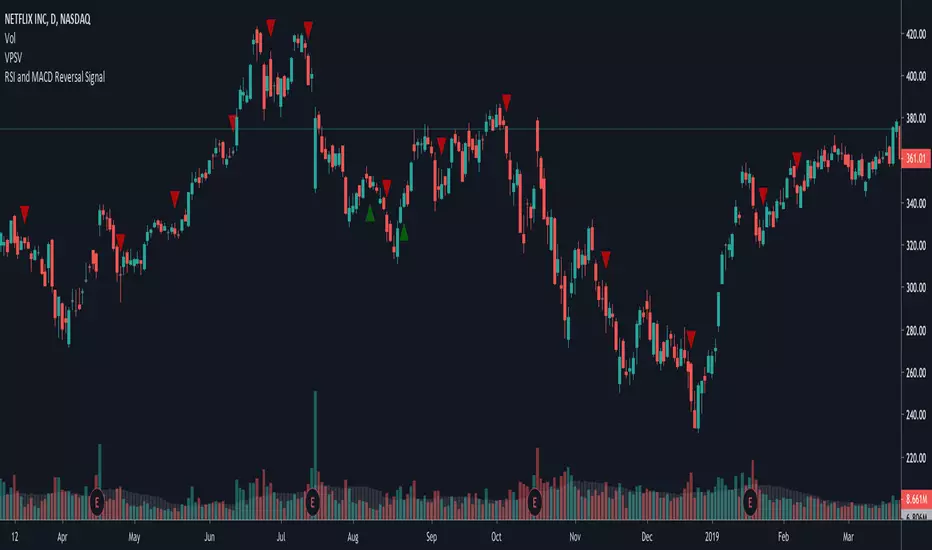
~RMCF~ RSI and MACD Reversal SignalFor AkibaDeep. Checks if RSI < 30 recently and if MACD diverges, placing a buy signal. Then, places a sell signal when MACD converges back.
Pine Script® göstergesi
[ProfitTrailer] Fibonacci Swing TraderThis script implements one of the ProfitTrailer example strategies: Fibonacci Swing Trader.
For complete info about this strategy please refer to PT wiki.
Pine Script® göstergesi
