Pair Correlation Master [Macro]The Main Idea
Trading represents a constant battle between Systemic Flows (the whole market moving together) and Idiosyncratic Moves (one specific asset moving on its own).
This tool allows you to monitor a "basket" of 4 assets simultaneously (e.g., the major USD pairs). It answers the most important question in forex and multi-asset trading: "Is this move happening because the Dollar is weak, or because the Euro is strong?"
It separates the "Signal" (the unique move) from the "Noise" (the herd movement).
1. The Chart Lines: The "Race" (Macro Trend)
Think of the lines on your chart as a long-distance race. They visualize the performance of all 4 assets over the last 200 candles (adjustable).
- Bunched Together: If all lines are moving in the same direction, the market is highly correlated. (e.g., "The Dollar is selling off everywhere").
- Fanning Out: If the lines are spreading apart, specific currencies are outperforming others.
- The Zero Line: This is the starting line.
--- Above 0: The pair is in a macro uptrend.
--- Below 0: The pair is in a macro downtrend.
2. The Dashboard: The "Health Check" (Micro Data)
The table in the top right gives you the immediate statistics for right now.
- A. The Z-Score (The Rubber Band)
This measures how "stretched" price is compared to its normal behavior.
- White (< 2.0): Normal trading activity.
- Orange (> 2.0): The price is stretching. Warning sign.
- Red (> 3.0): Critical Stretch. The rubber band is pulled to its limit. Statistically, a pullback or pause is highly likely.
B. The Star (★)
The script automatically calculates the average behavior of your group. If one asset is behaving completely differently from the rest, it marks it with a Star (★).
- Example: EURUSD, GBPUSD, and NZDUSD are flat, but AUDUSD is rallying hard. AUDUSD gets the ★. This is where the unique opportunity lies.
🎯 Best Uses: 4H & Daily Timeframes
This indicator is tuned for "Macro" analysis. It works best on the "4-Hour" and "Daily" charts to filter out intraday noise and capture swing trading moves.
- Strategy 1: The "Rubber Band" Snap (Mean Reversion)
- Setup: Look for a Z-Score in the RED (> 3.0) on the Daily timeframe.
- Action: This indicates an unsustainable move. Look for reversals or exhaustion patterns to trade against the trend back toward the mean.
- Strategy 2: The "Lone Wolf" (Trend Following)
- Setup: Look for the asset with the Star (★).
- Action: If the whole basket is flat (Balanced), but the Star asset is breaking out, that creates a high-quality trend trade because that specific currency has its own catalyst (News/Earnings).
- Strategy 3: Systemic Flows (Basket Trading)
- Setup: The dashboard footer says "⚠️ SYSTEMIC MOVE."
- Action: This means everything is moving together (e.g., a massive USD crash). Don't look for unique setups; just join the trend on the strongest pair.
Dashboard Footer Key
The bottom of the table summarizes the current state of the market for you:
- Balanced / Rangebound: The market is quiet. Good for range trading.
- Focus: : Trade this specific pair. It is moving independently.
- Systemic Move: The whole basket is moving violently. Trade the momentum.
p.s. Suggestion - apply and use on the chart rather than an oscillator.
Multisymbol

Multi-Ticker Anchored CandlesMulti-Ticker Anchored Candles (MTAC) is a simple tool for overlaying up to 3 tickers onto the same chart. This is achieved by interpreting each symbol's OHLC data as percentages, then plotting their candle points relative to the main chart's open. This allows for a simple comparison of tickers to track performance or locate relationships between them.
> Background
The concept of multi-ticker analysis is not new, this type of analysis can be extremely helpful to get a gauge of the over all market, and it's sentiment. By analyzing more than one ticker at a time, relationships can often be observed between tickers as time progresses.
While seeing multiple charts on top of each other sounds like a good idea...each ticker has its own price scale, with some being only cents while others are thousands of dollars.
Directly overlaying these charts is not possible without modification to their sources.
By using a fixed point in time (Period Open) and percentage performance relative to that point for each ticker, we are able to directly overlay symbols regardless of their price scale differences.
The entire process used to make this indicator can be summed up into 2 keywords, "Scaling & Anchoring".
> Scaling
First, we start by determining a frame of reference for our analysis. The indicator uses timeframe inputs to determine sessions which are used, by default this is set to 1 day.
With this in place, we then determine our point of reference for scaling. While this could be any point in time, the most sensible for our application is the daily (or session) open.
Each symbol shares time, therefore, we can take a price point from a specified time (Opening Price) and use it to sync our analysis over each period.
Over the day, we track the percentage performance of each ticker's OHLC values relative to its daily open (% change from open).
Since each ticker's data is now tracked based on its opening price, all data is now using the same scale.
The scale is simply "% change from open".
> Anchoring
Now that we have our scaled data, we need to put it onto the chart.
Since each point of data is relative to it's daily open (anchor point), relatively speaking, all daily opens are now equal to each other.
By adding the scaled ticker data to the main chart's daily open, each of our resulting series will be properly scaled to the main chart's data based on percentages.
Congratulations, We have now accurately scaled multiple tickers onto one chart.
> Display
The indicator shows each requested ticker as different colored candlesticks plotted on top of the main chart.
Each ticker has an associated label in front of the current bar, each component of this label can be toggled on or off to allow only the desired information to be displayed.
To retain relevance, at the start of each session, a "Session Break" line is drawn, as well as the opening price for the session. These can also be toggled.
Note: The opening price is the opening price for ALL tickers, when a ticker crosses the open on the main chart, it is crossing its own opening price as well.
> Examples
In the chart below, we can see NYSE:MCD NASDAQ:WEN and NASDAQ:JACK overlaid on a NASDAQ:SBUX chart.
From this, we can see NASDAQ:JACK was the top gainer on the day. While this was the case, it also fell roughly 4% from its peak near lunchtime. Unlike the top gainer, we can see the other 3 tickers ended their day near their daily high.
In the explanations above, the daily timeframe is used since it is the default; however, the analysis is not constrained to only days. The anchoring period can be set to any timeframe period.
In the chart below, you can observe the Daily, Weekly, and Monthly anchored charts side-by-side.
This can be used on all tickers, timeframes, and markets. While a typical application may be comparing relevant assets... the script is not limited.
Below we have a chart tracking COMEX:GCV2026 , FX:EURUSD , and COINBASE:DOGEUSD on the AMEX:SPY chart.
While these tickers are not typically compared side-by-side, here it is simply a display of the capabilities of the script.
Enjoy!

SMT Oscillator: Smarter Money Divergence Detector [PhenLabs]📊Phenlabs - SMT Oscillator: Smarter Money Divergence Detector
Version: PineScript™v6
📌Description
The SMT Oscillator is a sophisticated tool designed to identify smart money divergence between two correlated assets. By analyzing the momentum and volume-weighted price action of a primary and secondary symbol, traders can spot subtle shifts in market dynamics that often precede significant price movements. This indicator is built to provide a clearer, more filtered view of inter-market relationships, solving the common problem of false signals and market noise. Its primary purpose is to equip traders with a quantifiable edge in detecting potential reversals or continuations that are not obvious on a standard price chart.
🚀Points of Innovation
Dual-Symbol Divergence Core: Directly compares momentum (RSI or MACD) between two user-selected symbols to pinpoint true SMT divergence.
Volume-Weighted Analysis: Integrates volume delta into the divergence calculation, giving more weight to moves backed by significant market participation.
Entropy Filter for Noise Reduction: Employs an entropy calculation to filter out low-quality signals during choppy or consolidating market conditions.
Predictive Forecast Line: Utilizes a linear regression model to project the oscillator’s future trajectory, offering a forward-looking glimpse of potential momentum shifts.
Customizable Signal Sensitivity: Allows fine-tuning of overbought and oversold levels to adapt to different market volatilities and trading styles.
Integrated Signal Alerts: Provides built-in alerts for bullish/bearish zero crosses and overbought/oversold conditions.
🔧Core Components
Momentum Engine: The user can select either RSI or MACD as the underlying engine for the divergence calculation, allowing for flexibility in analysis.
Normalization Function: Price data from both symbols is normalized using percentage change to ensure a true “apples-to-apples” comparison, regardless of their nominal price differences.
Divergence Calculator: The core algorithm that subtracts the secondary symbol’s momentum from the primary’s and normalizes the result using the combined standard deviation.
Smoothing Mechanism: An Exponential Moving Average (EMA) is applied to the raw oscillator output to reduce choppiness and provide a clearer signal line.
🔥Key Features
Multi-Asset Comparison: Go beyond single-asset analysis by comparing correlated pairs like ES/NQ or BTC/ETH to uncover hidden trading opportunities.
Heatmap Visualization: An optional heatmap mode provides an intuitive visual representation of divergence strength, making it easier to gauge market sentiment at a glance.
Configurable Lookback and Timeframe: Adjust the lookback period and analysis timeframe to suit your specific strategy, from short-term scalping to long-term trend analysis.
Signal Markers: Visual markers are plotted directly on the chart for bullish and bearish zero-line crossovers, providing clear entry and exit signals.
🎨Visualization
SMT Oscillator Line: The primary visual element, colored blue for bullish (positive) divergence and orange for bearish (negative) divergence.
Zero Line: A solid horizontal line at the zero level, indicating the equilibrium point between the two assets. Crossovers of this line signal a shift in relative strength.
Overbought/Oversold Zones: Dotted lines at the +80 and -80 levels (customizable) that highlight extreme divergence readings, often indicating potential exhaustion points.
Forecast Line: A predictive line that plots the anticipated path of the oscillator, giving traders an advanced warning of potential changes in momentum.
📖Usage Guidelines
Setting Categories
Primary Symbol
Default: (Chart Symbol)
Description: The main asset you are analyzing. Leave blank to use the symbol currently on your chart.
Secondary Symbol
Default: CME_MINI:ES1! (used with NASDAQ futures due to inherent heavy correlation
Description: The asset to compare against the primary symbol.
Lookback Period
Default: 14
Range: 8-100
Description: Controls the calculation window for momentum (RSI/MACD). Higher values result in a smoother, less sensitive oscillator.
Divergence Type
Default: RSI
Options: RSI, MACD
Description: Choose the momentum indicator to use for the divergence calculation.
Enable Volume Weighting
Default: true
Description: When enabled, gives more weight to divergence signals that are accompanied by significant volume.
✅Best Use Cases
Identifying high-probability reversal points by spotting divergence in overbought or oversold territory.
Confirming the strength of a trend by observing sustained positive or negative divergence.
Pairs trading by taking a long position on the outperforming asset and a short position on the underperforming one during a divergence.
Risk management by recognizing when a current trend is losing its underlying momentum.
⚠️Limitations
Requires Correlated Assets: The indicator’s effectiveness is highly dependent on the selection of two assets with a known correlation (e.g., ES and NQ).
Not a Standalone System: Divergence signals should be used in conjunction with other forms of analysis (price action, market structure) and not as a complete trading system.
Lagging by Nature: As it is based on moving averages and past price data, the oscillator is inherently lagging and may not capture all rapid price changes.
💡What Makes This Unique
Combined Momentum & Volume: Unlike standard oscillators, it fuses momentum with volume delta for a more robust “Smart Money” perspective.
Noise-Filtering Mechanism: The proprietary entropy filter is a unique feature designed to weed out insignificant market chatter and focus on high-conviction signals.
🔬How It Works
Data Normalization:
The script first normalizes the price data of the two selected symbols into percentage changes. This ensures that the comparison is fair, regardless of the difference in their price scales.
Momentum Calculation:
It then calculates the chosen momentum value (either RSI or MACD histogram) for each of the normalized price series.
Divergence Computation:
The core of the indicator lies in subtracting the momentum of the secondary symbol from the primary one. This raw divergence is then optionally weighted by volume and filtered for market noise (entropy) to produce the final oscillator value.
💡Note:
For best results, use this indicator on adequate timeframes to filter out market noise. Always confirm signals with price action analysis before entering a trade.

Screener - Moving Average / ATR Breakout Signal [ARTech]Screener - Moving Average / ATR Breakout Signal
This indicator features a powerful multi-symbol screener that scans up to 40 user-defined symbols in real time for Moving Average (MA) and ATR breakout signals. Users can customize the list of symbols, select the asset class (e.g., Crypto, Stocks, Forex). The screener detects trend-following signals based on price crossing a chosen MA type and length, enhanced by optional ATR-based volatility filters and breakout thresholds to improve signal accuracy. Signals can be displayed on the chart via labels, tooltips, or a compact signal table, allowing traders to monitor multiple markets simultaneously without switching charts. The list of symbols generating signals can also be tracked with customizable alerts, enabling traders to receive real-time notifications for long and short breakout signals directly via TradingView alerts.
This indicator is developed based on the concept of Moving Average / ATR Breakout Signal script on TradingView, with enhancements to support multi-symbol scanning.
Key Features
• Multi-Symbol Screener: Scans up to 40 user-defined symbols simultaneously, with automatic separator detection and symbol validation.
• Repaint Prevention: Carefully designed to avoid repaint issues. The script structure and signal logic have been built to ensure reliable behavior, even across multiple symbols and varying chart conditions.
• Flexible Signal Display: Offers chart labels, tooltips, or a compact table to show signals, enabling multi-market monitoring without switching charts.
• Customizable Alerts: Supports alerts for both long and short signals, sending a list of symbols generating signals as real-time notifications.
• Multi-Type Moving Average Support: Choose from several MA types including EMA, SMA, Hull MA, VWMA, RMA, and TEMA, with customizable source and length settings.
• Flexible Signal Logic: Generates signals when price breaks above or below the selected MA, with options for confirmation candles and wick or close based breakout detection.
• ATR-Based Filtering: Utilizes ATR to create dynamic breakout bands around the MA, reducing noise and improving breakout validation.
• Breakout Threshold Filtering: Adds an optional minimum percentage price move before a new opposite signal is allowed, preventing rapid reversals.
Why use this indicator?
• Scans up to 40 symbols at the same time.
• Users can define the symbol list, asset class, and automatically detects the symbol separator; warns if any symbols are invalid
• Detected signals are shown directly on the chart as labels, tooltips, or in a compact table.
• The list of signal-generating symbols can be tracked with alerts — no need to watch the chart constantly.
How to Use
███████ Alerts ███████
🔸 Long / Short
To enable Custom Alerts, select the desired alert type (Long or Short) from the indicator's settings under the "Alerts" section, you can customize messages and enable notifications for Long and Short signals. Then, you need to activate the fx alert() function call option in TradingView’s alert creation dialog.
Alert messages include your custom message followed by a list of symbols currently giving signals, each shown on a new line. For example, if your input message is set to “🟢 Long Signal” and BTCUSD and ETHUSD are signaling, the alert will look like this:
🟢 Long Signal
BTCUSD
ETHUSD
This format helps you clearly see the type of signal and each symbol individually, making real-time monitoring easier.
🔸 Alert Delay (seconds)
This setting adds a delay before alerts are triggered. It helps ensure that signals are based on confirmed bar closures for slight timing differences between symbol data feeds (especially in multi-symbol mode). For example, setting a 30-second delay allows all symbols to finish processing before the alert fires, avoiding early or incomplete signal lists.
For best results, try different delay values to see what works best with your selected timeframe.
███████ Display / Signal ███████
🔸 Display Mode
Choose how the indicator presents signals on your chart. Focus on a single symbol (Chart mode), Scan and display multiple symbols at once (Screener mode), or hide visuals and use only tables or alerts (No mode).
• Chart Mode: Displays signals only for the current chart symbol. Useful for testing and optimizing signal conditions before scanning multiple assets.
• Screener Mode: Activates the screener functionality, showing results for all valid symbols in your list. Signals appear as labels on the chart and are also listed in the signal table for easy tracking.
• No (Table Only): Hides all on-chart visuals (labels, markers). Signals are still processed and can be viewed in tables or used with alerts. This mode is ideal when you're using multiple screeners at once and want to avoid overlapping visuals. Each screener can display its results in separate table positions (e.g., bottom right, top left, etc.), so turning off chart visuals helps keep your workspace clean while still tracking multiple symbol groups efficiently. This way, you can also track more than 40 symbols by using multiple screener instances with different symbol groups and table positions.
🔸 Long
You can independently turn ON or OFF the display of Long signals using the toggle.
🔸 Short
You can independently turn ON or OFF the display of Short signals using the toggle.
███████ Symbols ███████
🔸 Symbols
You can enter up to 40 symbols. Symbols must be written in full format. For example: BINANCE:BTCUSDT, NASDAQ:AAPL, or OANDA:EURUSD. TradingView requires this full format to correctly recognize each symbol. Due to TradingView’s limitations, only the first 40 symbols in your list will be processed
- Separator Rules: Letters (A–Z), numbers (0–9), underscore (_), dot (.), and exclamation mark (!) are allowed within symbol names (e.g., BINANCE:BTCUSDT.P). Therefore, avoid using them as separators. Instead, use comma (,) , semicolon (;) , space , or newline to separate multiple symbols.
- Auto Detection: The indicator automatically detects the separator used in your list. If the format is incorrect or a symbol is invalid, a warning will appear to help you fix it.
🔸 Symbol Filter
When scanning multiple symbols, it's important that they belong to the same market type (Crypto, Stocks, Forex, etc.). Different markets have different trading hours, and mixing them may cause issues.
For example, if your chart is using a stock symbol (like NASDAQ:AAPL) and your symbol list includes crypto symbols (like BINANCE:BTCUSDT), the screener may not work correctly. Since stock markets are not open 24/7, the chart time may fall outside of crypto trading hours — causing crypto signals to fail or not update properly.
To avoid this issue, the indicator includes a Symbol Filter. This lets you filter your symbol list to include only the correct asset type (e.g., only Crypto or only Stocks). By using this filter, you make sure the screener runs under the correct market conditions and avoids signal mismatches.
If you set the filter to None , no filtering will be applied. In this case, you are responsible for making sure all listed symbols match your chart’s market type.
For best results, always use symbols from the same market type as your chart symbol. This ensures that candle open/close times align across all symbols, avoiding timing mismatches. Symbols and the chart must follow the same market hours for accurate and consistent signal generation.
🔸 Show Symbols on Table
This feature helps you quickly review the symbols you've entered. When enabled, a table appears in the bottom-right corner of the chart displaying all symbols from your list along with their market types and statuses
- Green background: Symbol is valid and matches the selected Symbol Filter. It can generate signals.
- Gray background: Symbol is valid but does not match the selected filter. It will not generate signals.
- Red background: Symbol is invalid (e.g., due to incorrect names, delisting, or unsupported by broker).
You don’t need to remove invalid or mismatched symbols, but no signals will be generated for them. This visual check makes it easier to catch symbol issues before relying on the screener output.
███████ Signal Display Style ███████
🔸 Display Method
Choose how signals will be shown visually
• Label: The signal appears as a label on the candle. The label includes all triggering symbols as text.
• Tooltip: An icon (such as 🟢 or 🔴) is shown instead of full text. Hold your mouse pointer on the icon on chart for a few seconds to see a tooltip listing the triggered symbols. This method keeps your chart cleaner and less cluttered.
• None: No visual markers appear on candles. Signals are only visible in the signal table — ideal if you're using multiple indicators and want to avoid chart clutter.
🔸 Symbol Display Format
This setting affects the labels, tooltips, signal table, and alert messages, ensuring consistency across all displays. Select whether you want symbols to appear as:
• EXCHANGE:SYMBOL: BINANCE:BTCUSDT
• SYMBOL: BTCUSDT
🔸 Long Signal Icon
Used only in Tooltip mode, these icons (e.g., 🟢 for Long) appear on bars where signals are detected. Customize it freely to match your style or strategy.
🔸 Short Signal Icon
Used only in Tooltip mode, these icons (e.g., 🔴 for Short) appear on bars where signals are detected. Customize it freely to match your style or strategy.
🔸 Size
Adjust the visual size of labels or tooltips. Smaller sizes help reduce clutter when many signals trigger in close proximity.
███████ Signal Table ███████
This section controls the appearance and behavior of the signal table that displays last detected Long and Short signals for your symbols.
🔸 Show
Enable or disable the signal table display on the chart.
🔸 Highlight Signal Duration (Bars)
When a signal occurs, the corresponding cell in the table is highlighted using the selected Long or Short color for this many bars. This helps visually track recent signals over time. The bar where the signal icon appears is counted as 1.
🔸 Table Size
Choose the size of the table to fit your chart layout and readability preferences.
🔸 Table Position
Select where the table appears on your chart (e.g., top right, middle right, bottom left).
🔸 Title
Customize the table header text. The default is “Recent Signals”.
🔸 Background Color
Set the table’s background color and transparency to match your chart’s theme.
🔸 Long Signal Color
Choose the highlight color used to mark Long signals within the table.
🔸 Short Signal Color
Choose the highlight color used to mark Short signals within the table.
🔸 Text Color
Customize the text color inside the table for better contrast and readability.
🔸 Show Bars Since Signal
Optionally display how many bars have passed since each signal appeared. The bar where the signal occurs counts as 1.
███████ Signal ███████
This is the core component of the signal system. You can customize:
🔸 Moving Average Type
Choose from SMA, EMA, WMA, Hull MA, VWMA, RMA, or TEMA
🔸 Length
Adjust the length to suit your strategy.
🔸 Source
Select which price data (e.g., Close, Open, HL2) is used to calculate the MA.
🔸 Confirm Candles
Defines the number of consecutive candles that must break the selected level to confirm a signal.
– If ATR filter is enabled, this level is the ATR bands.
– If ATR is disabled, the Moving Average line is used.
This helps filter out noise and avoid premature signals.
🔸 Break Type
Specifies how the candle must break the level:
– Close: The candle must close beyond the level.
– Wick: A wick touching or exceeding the level is enough.
Both options generate signals only after the candle has closed.
🔸 Filter
This section provides optional filters to improve signal accuracy.
ATR
When the ATR filter is enabled, signals are generated only if the price breaks above the upper ATR line or below the lower ATR line—calculated by adding or subtracting the ATR multiplied threshold from the moving average—and the breakout must occur for the number of consecutive confirmation candles specified by the user input . This helps reduce false signals during low volatility periods.
• Multiplier: Adjusts the width of ATR bands by multiplying the ATR value.
• Length: Sets the period for ATR calculation.
• Smoothing: Selects the smoothing method applied to the ATR (RMA, SMA, EMA, WMA).
Breakout
When enabled, breakout confirmation requires the price to cross above the upper breakout line or below the lower breakout line by a specified percentage from the last signal price.
• Threshold (%): Defines the minimum percentage price movement required to validate a breakout.
• Show Breakout Levels: Toggle to display or hide breakout threshold area on the chart.

MA Cross MTF Alert (Miu)This script extends the classic moving average crossover strategy with support for up to 8 user-defined symbols across 4 custom timeframes, combined with a visual and alert system designed for traders who monitor multiple assets simultaneously.
Unlike traditional MA crossover tools, this script enables traders to receive real-time alerts for crossovers across multiple assets and timeframes, even when the script is not actively displayed on the chart — ideal for passive monitoring in multi-asset strategies.
What it does:
This script calculates two customizable moving averages (SMA or EMA) for each selected symbol and timeframe.
It then tracks crossover events:
- Bullish crossover when the fast MA crosses above the slow MA
- Bearish crossunder when the fast MA crosses below the slow MA
On the chart, it also displays the crossover signals for the current symbol and timeframe using color-coded cross icons.
Key features:
- Select SMA or EMA type for both moving averages
- Customize MA lengths and colors
- Works with any asset and timeframe
- Alerts include symbol and timeframe info for easy identification
How to use:
1) Add the indicator to your chart.
2) Choose the moving average type and lengths.
3) Enable/disable any of the 8 symbols and 4 timeframes.
4) Set up TradingView alerts by clicking “Create Alert” and selecting one of the alert() calls.
5) You will receive a message like:
BTC (1h) | MA Crossover ▲ or ETH (15m) | MA Crossunder ▼
Technical note:
This script uses request.security() to retrieve moving average values from up to 8 different symbols and 4 different timeframes in real time.
Feel free to leave your feedback or suggestions in the comments section below.
Enjoy!

MAG 7 - Weighted Multi-Symbol Momentum + ExtrasOverview
This indicator aggregates the percentage change of multiple symbols into a single “weighted momentum” value. You can set individual weights to emphasize or de-emphasize particular stocks. The script plots two key items:
The default tickers in the script are:
AAPL (Apple)
AMZN (Amazon)
NVDA (NVIDIA)
MSFT (Microsoft)
GOOGL (Alphabet/Google)
TSLA (Tesla)
META (Meta Platforms/Facebook)
Raw Weighted Momentum (Histogram):
Each bar represents the combined (weighted) percentage change across your chosen symbols for that bar.
Bars are colored green if the momentum is above zero, or red if below zero.
Smoothed Momentum (Yellow Line):
An Exponential Moving Average (EMA) of the raw momentum for a smoother trend view.
Helps visualize when short-term momentum is accelerating or decelerating relative to its average.
Features
Symbol Inputs: Up to seven user-defined tickers, with weights for each symbol.
Smoothing Period: Set a custom lookback length to calculate the EMA (or switch to SMA in the code if you prefer).
Table Display: A built-in table in the top-right corner lists each symbol’s real-time percentage change, plus the total weighted momentum.
Alerts:
Configure alerts for when the weighted momentum crosses above or below user-defined thresholds.
Helps you catch major shifts in sentiment across multiple symbols.
How To Use
Select Symbols & Weights: In the indicator’s settings, specify the tickers you want to monitor and their corresponding weights. Weights default to 1 (equal weighting).
Watch the Bars vs. Zero:
Bars above zero mean a positive weighted momentum (the basket is collectively moving up).
Bars below zero mean negative weighted momentum (the basket is collectively under pressure).
Check the Yellow Line: The EMA of momentum.
If the bars consistently stay above the line, short-term momentum is stronger than its recent average.
If the bars dip below the line, momentum is weakening relative to its average.
Review the Table: Quick snapshot of each symbol’s daily percentage change plus the total basket momentum, all color-coded red or green.
Caution & Tips
This indicator measures rate of change, not absolute price levels. A rising momentum can still be part of a larger downtrend.
Always combine momentum readings with other technical and/or fundamental signals for confirmation.
For better reliability, experiment with different smoothing lengths to suit your trading style (shorter for scalping, longer for swing or positional approaches).

Black RSI (Multi Symbol RSI)📌 GENERAL OVERVIEW
Black RSI (Multi Symbol RSI) is an indicator with multiple-RSI (multi-symbol support), It is a powerful indicator designed for analyzing the relative strength of multiple financial instruments within a single chart. This indicator essentially combines multiple instances of the Relative Strength Index (RSI) for different symbols, allowing traders to compare and contrast market conditions for a broader, simultaneous analysis of various assets. By tracking RSI across multiple assets, traders can identify broader market trends, and sector rotations, or pinpoint relative strengths and weaknesses among different instruments. Please check the below sections for details.
Black RSI (Multi Symbol RSI) Indicator Features Summary:
+ Multiple RSI with multi-symbol ◢
This indicator plots Primary+3 multiple RSI for multiple symbols at once. For instance, it could simultaneously show the RSI of indices (e.g., SPX, NASDAQ) or stocks within a sector, providing insights into how these assets are moving relative to one another.
+ Custom Divergence Module ◢
It allows the user to select the divergence source among the multiple RSI (Primary, 1st, 2nd or 3rd RSI) and displays regular/hidden bullish/bearish divergence for selected RSI only.
+ Custom RSI Moving Average/BBs ◢
It allows the user to select the RSI moving average/BBs source among the multiple RSI (Primary, 1st, 2nd or 3rd RSI) and displays moving average/BBs for selected RSI only.
+ Alert Triggers ◢
The indicator can incorporate alert functions that notify the user when an RSI threshold (e.g., overbought or oversold levels) is crossed for any of the selected symbols.
📌HOW TO USE IT
Confirm Trends Across Symbols: Use the indicator to confirm trends across multiple assets. For example, if most symbols within a sector or index are showing RSI levels above 50, it may indicate a bullish trend in that sector. Conversely, if most RSIs are below 50, it may signal bearish sentiment.
Spot Divergences: Look for RSI divergences across symbols, which can hint at potential reversals. For instance, if most symbols show declining RSI levels while a few have increasing RSI, it could indicate relative strength in those few, making them candidates for closer watch.
Identify Overbought/Oversold Conditions: By observing the RSI levels of multiple symbols, you can identify when certain assets are overbought (typically RSI > 70) or oversold (typically RSI < 30). When multiple assets show similar RSI levels, this can indicate broader market sentiment or sector momentum.
Sector Rotation Analysis: In longer-term trading or portfolio rebalancing, a Multi-RSI Multi-Symbol indicator can help detect sector rotation patterns by showing which sectors are gaining strength (higher RSI) and which are weakening, facilitating informed sectoral shifts.
Use in Conjunction with Other Indicators: The Multi-RSI can serve as a supporting indicator alongside trend indicators like Moving Averages or Bollinger Bands, helping to confirm entry and exit points. For example, if a symbol’s RSI shows an overbought condition and it aligns with a resistance level from a Moving Average, this could strengthen a sell signal.
Customization: Customize the settings to match your trading style. For instance, day traders might prefer a shorter RSI period and timeframes, while swing traders may benefit from longer timeframes and smoother RSI.
⚙️Black RSI (Multi Symbol RSI) SETTINGS
Black RSI (Multi) Dashboard ◢
+ 1st RSI: Enable/Disable 1st RSI
+ 2nd RSI: Enable/Disable 2nd RSI
+ 3rd RSI: Enable/Disable 3rd RSI
RSI Primary Tools ◢
+ RSI Moving Average/Bollinger Bands: Enable/Disable RSI Moving Average/Bollinger Bands
+ Smooth RSI: Enable/Disable Smooth RSI (for Primary RSI)
+ RSI Divergence: Enable/Disable Divergence for user-selected RSI
RSI Secondary Tools ◢
+ RSI OB/OS Color Bars: Enable/Disable RSI OB/OS Color Bars for user-selected RSI
+ RSI OB/OS Highlights: Enable/Disable OB/OS Highlights for user-selected RSI
+ Background: Enable/Disable RSI Background
+ Primary RSI Settings ▾
- Override Primary RSI Symbol: Allows the user to select the symbol for Primary RSI
- Primary RSI Length: User input primary RSI length value
- Primary RSI Source: User primary RSI source selection
- RSI Line Thickness: User input line thickness value for primary RSI
- Primary RSI Colors:
- OB/OS Highlights: Enable/Disable OB/OS Primary RSI Highlights
- RSI Overbought Threshold: The user can set the RSI overbought threshold value. This Overbought Threshold value will also be applied to All RSI (Primary, 1st, 2nd, 3rd) and "RSI Divergence overbought condition" and "RSI OB/OS Highlights"
- RSI Oversold Threshold: The user can set the RSI oversold threshold value. The lower band (oversold line) of RSI. This Oversold Threshold value will also be applied to All RSI (Primary, 1st, 2nd, 3rd) and "RSI Divergence oversold condition" and "RSI OB/OS Highlights"
+ 1st RSI Settings ▾
- Override 1st RSI Symbol: Allows the user to select the symbol for 1st RSI
- 1st RSI Length: User input 1st RSI length value
- 1st RSI Source: User 1st RSI source selection
- RSI Line Thickness: User input line thickness value for 1st RSI
- 1st RSI Colors:
- OB/OS Highlights: Enable/Disable OB/OS 1st RSI Highlights
+ 2nd RSI Settings ▾
- Override 2nd RSI Symbol: Allows the user to select the symbol for 2nd RSI
- 2nd RSI Length: User input 2nd RSI length value
- 2nd RSI Source: User 2nd RSI source selection
- RSI Line Thickness: User input line thickness value for 2nd RSI
- 2nd RSI Colors:
- OB/OS Highlights: Enable/Disable OB/OS 2nd RSI Highlights
+ 3rd RSI Settings ▾
- Override 3rd RSI Symbol: Allows the user to select the symbol for 3rd RSI
- 3rd RSI Length: User input 3rd RSI length value
- 3rd RSI Source: User 3rd RSI source selection
- RSI Line Thickness: User input line thickness value for 3rd RSI
- 3rd RSI Colors:
- OB/OS Highlights: Enable/Disable OB/OS 3rd RSI Highlights
+ RSI Bands & Threshold Settings ▾
- RSI Middle Band: Allows the user to plot optional RSI band on the RSI Oscillator
- RSI Bullish Band: Allows the user to plot optional RSI band on the RSI Oscillator
- RSI Bearish Band: Allows the user to plot optional RSI band on the RSI Oscillator
+ Primary RSI Smooth Settings ▾
- Type: The user selected Smooth MA type for Primary RSI. With RSI Smooth enabled, it will also affect Primary RSI Divergences detection (all divergences will be plotted according to the "Smoothed RSI line")
- Length: User input Smooth MA length value for Primary RSI
+ RSI Moving Average Settings ▾
- MA/BB RSI Source: Allows the user to MA/BB source selection
- MA/BB Enable/Disable: Allows the user to select Moving average only, BBs only or Both to display on the RSI Oscillator
- RSI Moving Average Colors: Allows the user to select Bullish/Bearish colours of RSI Moving Average
- RSI Moving Average Type: Allows the user to select RSI MA Type
- RSI Moving Average Length: User input RSI MA length value
- RSI Moving Average Thickness: User input RSI MA thickness
- Bollinger Bands Colors: Allows the user to select BBs colours
- BB StdDev: user input Bollinger Bands standard deviation value
+ RSI Divergence Settings ▾
- Divergence RSI source: User selection of divergence source .
- Divergence source: User selection of divergence source . "oscillator" (divergence detection with high/low or close of RSI), "price" (divergence detection with high/low or close of price)
- Bull price source: User selection of Bull price source. Bull price source: "Low" (low of price divergence detection), "Close" (close of price divergence detection) (linked to "price" in "Divergence source")
- Bear price source: User selection of Bear price source. Bear price source: "High" (high of price divergence detection), "Close" (close of price divergence detection) (linked to "price" in "Divergence source")
- Low/High left bars: How many candles to compare on the left side of a candle when deciding whether it is a pivot. The lower the number is, the earlier pivots (and therefore divergences) will be signalled, but the quality of those detections could be lower.
- Low/High right bars: How many candles to compare on the right side of a candle when deciding whether it is a pivot. The lower the number is, the earlier pivots (and therefore divergences) will be signalled, but the quality of those detections could be lower.
- Maximum lookback bars: The maximum length of a divergence (number of bars). If a detected divergence is longer than this, it will be discarded.
- Price threshold: User selection of Price threshold, higher values more lines
- RSI threshold: User selection of RSI threshold, higher values more lines
- Show Lows: Displays lows of RSI
- Show Highs: Displays highs of RSI
- Show Divergence as:
- Line Style:
- Line thickness: User input divergence line thickness value
- Label Transparency: it could reduce label mess on the oscillator line, input "100" for label text only without label background
- Labels Text Color: User label text colour selection
Auto Text Color > Auto colour change of label text according to Dark/Light chart theme
- Bull Divergences: Enable/Disable of Bull divergences
> Color: User selection of Bull divergence color
> Potential Bull: It will plot potential regular bull divergence with a dotted line.
- Bear Divergences: Enable/Disable of Bear divergences
> Color: User selection of Bear divergence color
> Potential Bear: It will plot potential regular bear divergence with a dotted line.
- Hidden Bull Div: Enable/Disable of Hidden Bull divergences
> Color: User selection of Hidden Bull divergence colour
> Potential H.Bull: It will plot potential hidden bull divergence with a dotted line.
- Hidden Bear Div: Enable/Disable of Hidden Bear divergences
> Color: User selection of Hidden Bear divergence colour
> Hidden Bear divergence: It will plot potential hidden bear divergence with a dotted line.
> Regular Bull oversold only: It will show Regular Bullish RSI divergences in the oversold zone only, RSI oversold threshold can be configured in the "Primary RSI Settings" section.
> Regular Bear overbought only: It will show Regular Bearish RSI divergences in the overbought zone only, RSI overbought threshold can be configured in the "Primary RSI Settings" section.
+ RSI OB/OS Colored Bars Settings▾
- OB/OS Bar RSI Source: User selection of OB/OS Bars RSI source .
- Overbought Bar Color: User RSI OB Bars colour selection
- Oversold Bar Color: User RSI OS Bars colour selection
+ Overbought/Oversold Highlights ▾
- OB/OS Highlights RSI Source: User selection of OB/OS Highlights RSI source .
- Overbought Highlights : Enable/Disable Overbought Highlights
- Oversold Highlights : Enable/Disable Oversold Highlights
- Transparency: Gradient transparency of highlighted area
+ RSI Line & Label Settings ▾
- Show Symbol label: Enable/Disable each RSI symbol label.
- RSI line offset: Shifts the RSI to the left or the right on the given number of bars, Default is 0
+ Background Setting ▾
- Custom Background Color: User selection of Background color
Feedback & Bug Report
If you find any bugs in this indicator or have any suggestions, please let me know. Please give feedback & appreciate it if you like to see more future updates and indicators. Thank you

Black Moving AveragesGENERAL OVERVIEW
The moving average (MA) indicator is a foundational yet versatile tool in technical analysis, used by traders and investors to smooth out price data over a specific time frame. This helps to identify the direction of a trend by filtering out short-term fluctuations or "noise" in the price action. By observing the moving average line, traders can gain insights into potential support and resistance levels, trend strength, and possible trend reversals. Moving averages are especially useful in trending markets, where they can enhance the timing of entries and exits.
The Black Moving Averages indicator is an enhanced Moving Average indicator with unique features in one indicator, features like multi-timeframe, multi-types/length, custom labelling and moving average compact PANEL with multi-symbol support.
📌HOW DOES IT WORK
A moving average is a constantly updated average price calculated by adding up the closing prices of a security over a set period and dividing by the total number of periods.
Uptrend: If the moving average line is sloping upwards and the price is above the moving average, this typically indicates an uptrend.
Downtrend: If the moving average slopes downward with price action mostly below it, a downtrend is likely in effect.
Flat/Sideways Trend: When the moving average is flat, it suggests a range-bound or consolidating market with no clear trend.
Common Moving Average Periods:
The choice of period for a moving average can vary significantly depending on the trader’s strategy:
Short-Term Traders: Often use periods such as 5, 10, or 20 (intraday or daily) to capture quick price movements.
Medium-Term Traders: Typically use 50-period MAs, which can help spot trend changes within a few weeks to a few months.
Long-Term Traders/Investors: Favor 100, 200, or even 250-period MAs to analyze the overarching trend in daily or weekly charts.
📌HOW TO USE IT
When an asset's price crosses above its moving average, it can be a signal to buy, while crossing below can be a signal to sell.
Moving Average Crossovers: When a short-term moving average crosses above a long-term moving average, it generates a “Golden Cross,” indicating a bullish trend. Conversely, when a short-term MA crosses below a long-term MA, this creates a “Death Cross,” signalling a potential bearish trend.
Moving Average Envelopes and Bands: Some traders use moving averages to create envelopes or bands (e.g., Bollinger Bands), which add upper and lower bands around the moving average. These can help to assess the volatility and gauge potential price reversals.
Dynamic Support and Resistance: Longer-term MAs, such as the 200-day SMA, often act as dynamic support or resistance. If the price bounces off this MA several times, it reinforces the indicator’s significance.
Trend Confirmation and Continuation: Traders can confirm trends by observing if the price consistently stays above or below the moving average. This can be a signal to maintain an existing position.
Crossover Signals for Entries and Exits: A crossover strategy, where a shorter MA crosses above or below a longer MA, can serve as a reliable entry or exit point. This is particularly popular for catching early trend changes.
Combining with Other Indicators: Moving averages often yield better results when used alongside other indicators, such as the Relative Strength Index (RSI) for confirming overbought or oversold conditions, or the MACD for gauging momentum.
Limitations of Moving Averages
Lagging Nature: Moving averages rely on historical data, which makes them inherently lagging indicators, meaning they tend to react after a trend is already underway.
False Signals: In range-bound or choppy markets, moving averages can produce false signals, leading to potentially unprofitable trades.
When to be cautious:
When an asset's price is driven by strong momentum, it can remain over-extended for a long time. In this case, slight pauses may be mistaken for reversals.
By refining your understanding of moving averages and using them within the broader context of technical analysis, you can leverage their simplicity and effectiveness to better time entries, and exits, and spot potential reversals in various types of market conditions.
Black Moving Averages Indicator Features:
Multiple Moving Averages with multiple types, lengths & Cross
Multi Timeframe support
Moving Average PANEL with TF, Multi Symbol, Type, Length & Trend Strength
Moving Averages Horizontal Display with Labels (Type, TF, Price)
⚙️Black Moving Average SETTINGS
+ Black Moving Averages Dashboard ◢
- Moving Averages: Enable/Disable the Moving Averages on Chart
- MA Cross: Enable/Disable the Moving Averages Cross plot on the Chart
- MA PANEL: Enable/Disable the Moving Averages Panel on Chart
- VWAP: Enable/Disable the VWAP on Chart
+ Moving Averages Display Settings ◢
- Switch to Horizontal Lines: It switches the moving averages lines into horizontal lines on the charts
- Labels: It allows users to display moving averages labels (TF, type, length), prices or both on the chart
- Label Text Size: The user can select label text size (Tiny, Small, Normal, Large, Huge)
- Label Offset: Input label offset value (distance of label display from moving averages)
+ Moving Average Settings ◢
- Moving Average Length: input value of moving average length
- Color: Color selection for moving average
- Timeframe: Selection of timeframe for the moving average
- Type: Selection of MA type for the moving average
- Source: Selection of MA source(close, open etc) for the moving average
- Style: Display style (Line, Cross, Circle) for the moving average
- Line width: Display width of the moving average
+ Moving Average Cross Settings ◢
- | | Coss A | :
Plots cross of two user-specified moving averages on the chart
- | | Coss B | :
Plots cross of two user-specified moving averages on the chart
- | | Coss C | :
Plots cross of two user-specified moving averages on the chart
+ Moving Average PANEL Settings ◢
- Override Panel Symbol: Enables user to select the symbol for MA PANEL
- MA Panel Symbol: Displays symbol on the MA PANEL
- Panel H/V Position: Displays MA Panel Horizontally or Vertically
- Moving Average Panel Position: Selection of MA Panel position on the chart
- Panel Text Size: The user can select panel text size (Tiny, Small, Normal, Large, Huge)
- Panel Text Color: Color selection for panel text
- Cross A: Displays moving averages bullish/bearish cross on the panel from "Moving Average Cross Settings"
- Cross B: Displays moving averages bullish/bearish cross on the panel from "Moving Average Cross Settings"
- Cross C: Displays moving averages bullish/bearish cross on the panel from "Moving Average Cross Settings"
- Panel MA Length: input value of panel moving average length
- Timeframe: Selection of timeframe for the panel moving average
- Type: Selection of MA type for the panel moving average
- Source: Selection of MA source(close, open etc) for the panel moving average
Feedback & Bug Report
if you found any bug in this indicator or any suggestion, please let me know. Please give feedback & appreciate it if you like to see more future updates and indicators. Thank you

Engulfing Candles Alert - Multi Symbol (Miu)This indicator plots triangle shapes on each engulfing candles (bullish or bearish) on current chart.
The main use for this indication is to set alerts on multiple symbols at once.
Please follow steps below to set your alarms:
1) Add indicator to the chart
2) Go to settings
3) Check symbols you want to receive alerts (choose up to 8 different symbols)
4) Check if you want only bullish or bearish alerts or both
5) Once all is set go back to the chart and click on 3 dots to set alert in this indicator, rename your alert and confirm
6) You can remove indicator after alert is set and it'll keep working as expected
What does this indicator do?
This indicator will generate alerts anytime a candle closes and reaches bullish or bearish engulfing condition for any of symbol set.
Alert messages example: "Bullish alert on {Symbol}"
This script requests open and close information for each symbol through request.security() built-in function.
Detailed indicator description:
If current bar open is less than or equal to the previous bar close AND current bar open is less than previous bar open AND current bar close is greater than previous bar open THEN True
bullishEngulfing = (openBarCurrent <= closeBarPrevious) and (openBarCurrent < openBarPrevious) and (closeBarCurrent > openBarPrevious)
The opposite condition will be bearishEngulfing
Feel free to give feedbacks on comments section below. Enhancement suggestions are welcome =).
Enjoy!

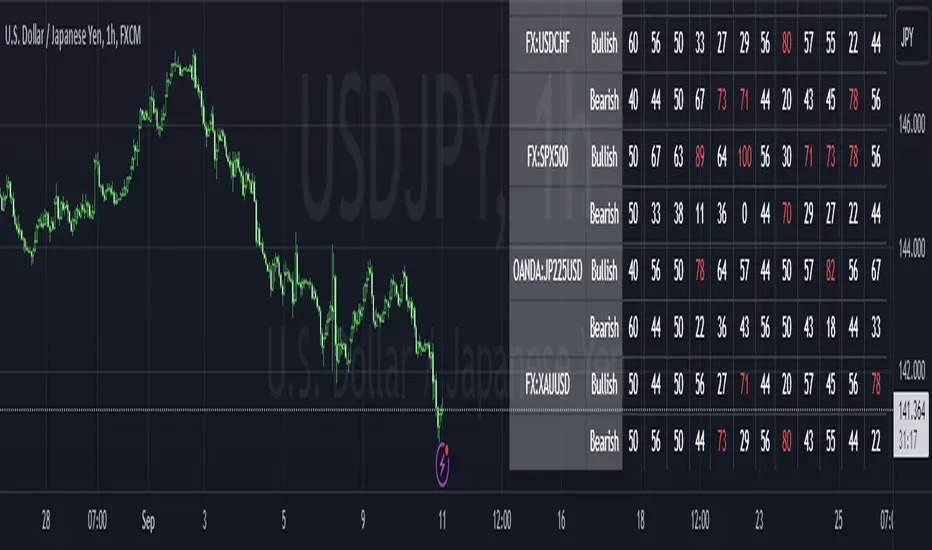
Bull/Bear Ratio By Month Table [MsF]Japanese below / 日本語説明は英文の後にあります。
-------------------------
This is an indicator that shows monthly bull-bear ratio in a table.
By specifying the start year and end year, the ratio will be calculated and showed based on the number of bullish and bearish lines in the monthly bar. It allows you to analyze the trend of each symbol and month (bullish / bearish). Up to 10 symbols can be specified.
You can take monthly bull-bear ratio for the past 10 or 20 years on the web, but with this indicator, you can narrow it down to the period in which you want to see the symbols you want to see. It is very convenient because you can take statistics at will.
Furthermore, if the specified ratio is exceeded, the font color can be changed to any color, making it very easy to read.
=== Parameter description ===
- From … Year of start of aggregation
- To … Year of end of aggregation
- Row Background Color … Row title background color
- Col Background Color … Column title background color
- Base Text Color … Text color
- Background Color … Background Color
- Border Color … Border Color
- Location … Location
- Text Size … Text Size
- Highlight Threshold … Ratio threshold, and color
- Display in counter? … Check if you want to show the number of times instead of the ratio
-------------------------
月別陰陽確率をテーブル表示するインジケータです。
開始年から終了年を指定することで、月足における陽線数および陰線数を元に確率を計算して表示します。
この機能により各シンボルおよび各月の特徴(買われやすい/売られやすい)を認識することができアノマリー分析が可能です。
シンボルは10個まで指定可能です。
過去10年、20年の月別陰陽確率は、Web上でよく見かけますが、このインジケータでは見たいシンボルを見たい期間に絞って、
自由自在に統計を取ることができるため大変便利です。
なお、指定した確率を上回った場合、文字色を任意の色に変更することができるため、大変見やすくなっています。
=== パラメータの説明 ===
- From … 集計開始年
- To … 集計終了年
- Row Background Color … 行タイトルの背景色
- Col Background Color … 列タイトルの背景色
- Base Text Color … テキストカラー
- Background Color … 背景色
- Border Color … 区切り線の色
- Location … 配置
- Text Size … テキストサイズ
- Highlight Threshold … 色変更する確率の閾値、および色
- Display in counter? … 確率ではなく回数表示する場合はチェックする
RSI_CMO_ScannerHave you ever wanted to scan across many tickers and monitor an indicator across time for these selected tickers?
Have you ever wanted to monitor the Mag7 and SPY simultaneously and watch a divergence take place real time across all selected tickers?
With this indicator, you can now view 100 tickers (in batches of 10) for either Stocks, Crypto or Forex, with a HeatMap visualisation for the selected timeframe.
This particular indicator utilises the RSI or the CMO to provide this view, where colors change from deep red (low values) to dark green (high values) and provide the HeatMap sense of how this metric changes across time.
The values within the labels can be switched on and off from the Settings, depending on the user's preference.
Additionally, the tickers can be selected through the Settings from the Stocks, Crypto or Forex groups
The originality and usefulness of this indicator is that it provides a simultaneous view across batches of 10 tickers for a lookback of values in the given timeframe. Also, the view is served as a heatmap, for a visual understanding of the fluctuation over time.
The same logic can be applied to a variety of indicators, besides the RSI and the CMO.

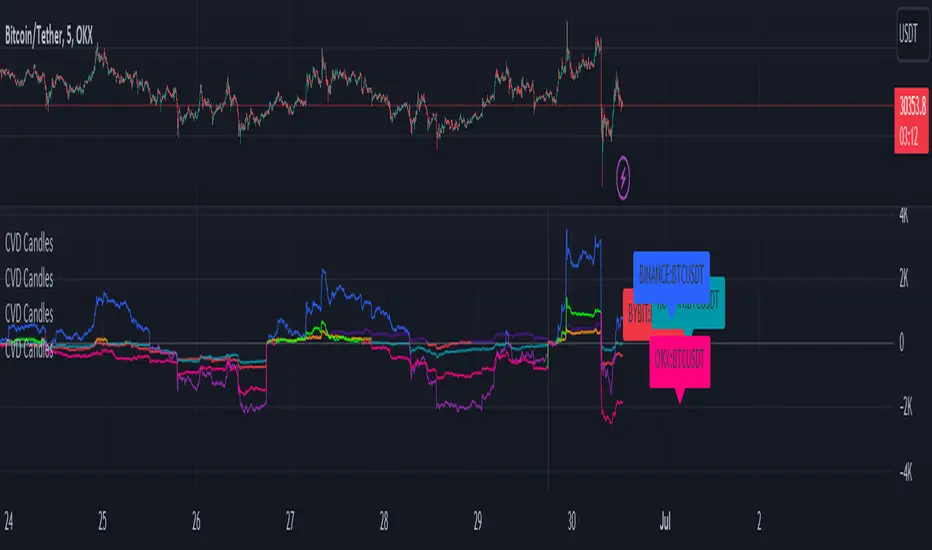
CVD+ - Multi Symbol Cumulative Volume DeltaEdit of TradingView's LTF CVD
TradingView's CVD is already the most accurate CVD on the platform because of the LTF data. The purpose of the edit is to provide the ability to compare volume flow between multiple exchanges, futures & spot, multiple symbols or any other potential use case. All in single layout or even a single pane.
Added features:
- Option to manually select a symbol from which to calculate the LTF CVD
- Option to normalize the selected symbol's CVD to the chart's symbol's CVD (Useful when you want to compare futures and spot on the same pane)
- Label that displays the selected symbol's name and exchange
- Changed presets to plot the CVD line as the predetermined option
All of TV's original features remain the same.
Black MACDBlack MACD is combination of MACD / Awesome Oscillator / Wavetrend Oscillator / BB Squeeze (Multi Oscillator) with many features like Multi Symbol support, Dual Divergence, MACD Cross over/under and completely customizable.
MACD Oscillator
Awesome Oscillator
Wavetrend Oscillator
Bollinger Bands Squeeze
Multi Symbol
Dual Divergence
MACD Cross over/under
Full Customization
Multi Symbol
Bollinger Bands Squeeze
Dual Divergence
MACD Cross
Awesome Oscillator
Wavetrend Oscillator
What is Moving Average Convergence Divergence – MACD?
The most popular indicator used in technical analysis, Moving average convergence divergence ( MACD ) reveal changes in the strength, direction, momentum, and duration of a trend in a financial instrument’s price. It's a trend-following momentum indicator that shows the relationship between two moving averages of a security’s price. The MACD is calculated by subtracting the 26-period exponential moving average ( EMA ) from the 12-period EMA.
The MACD indicator is typically good for identifying three types of basic signals;
Signal Line Crossovers
A Signal Line Crossover is the most common signal produced by the MACD . On the occasions where the MACD Line crosses above or below the Signal Line, that can signify a potentially strong move. The standard interpretation of such an event is a recommendation to buy if the MACD line crosses up through the Signal Line (a "bullish" crossover), or to sell if it crosses down through the Signal Line (a "bearish" crossover). These events are taken as indications that the trend in the financial instrument is about to accelerate in the direction of the crossover.
Zero Line Crossovers
Zero Line Crossovers occur when the MACD Line crossed the Zero Line and either becomes positive (above 0) or negative (below 0). A change from positive to negative MACD is interpreted as "bearish", and from negative to positive as "bullish". Zero crossovers provide evidence of a change in the direction of a trend but less confirmation of its momentum than a signal line crossover
Divergence
Divergence is another signal created by the MACD . Simply, divergence occurs when the MACD and actual price are not in agreement. A "positive divergence" or "bullish divergence" occurs when the price makes a new low but the MACD does not confirm with a new low of its own. A "negative divergence" or "bearish divergence" occurs when the price makes a new high but the MACD does not confirm with a new high of its own. A divergence with respect to price may occur on the MACD line and/or the MACD Histogram
Moving Average Crossovers, another hidden signal that MACD Indicator identifies
Many traders will watch for a short-term moving average to cross above a longer-term moving average and use this to signal increasing upward momentum. This bullish crossover suggests that the price has recently been rising at a faster rate than it has in the past, so it is a common technical buy sign. Conversely, a short-term moving average crossing below a longer-term average is used to illustrate that the asset's price has been moving downward at a faster rate and that it may be a good time to sell.
Moving Average Crossovers in reality is Zero Line Crossovers, the value of the MACD indicator is equal to zero each time the two moving averages cross over each other. For easy interpretation by trades, Zero Line Crossovers are simply described as positive or negative MACD
False signals
Like any forecasting algorithm, the MACD can generate false signals. A false positive, for example, would be a bullish crossover followed by a sudden decline in a financial instrument. A false negative would be a situation where there is bearish crossover, yet the financial instrument accelerated suddenly upwards
What is Awesome Oscillator?
The Awesome Oscillator is an indicator used to measure market momentum. AO calculates the difference of a 34 Period and 5 Period Simple Moving Averages. The Simple Moving Averages that are used are not calculated using closing price but rather each bar's midpoints. AO is generally used to affirm trends or to anticipate possible reversals.
Disclaimer: DYOR. Not financial advice. Not a trading system. I am not affiliated with TradingView or any authors mentioned here; You alone have the sole responsibility of evaluating the script output and risks associated with the use of the script. Trading success is all about following your trading strategy and the indicators should fit within your trading strategy, and not to be traded upon solely. Always trade with confluence and Risk Management.
Feedback & Bug report
if you found any bug in this indicator or any suggestion, please let me know. Please give feedback & appreciate if you like to see more future updates and indicators. Thank you
Check out Black RSI indicator:

Black RSI (Pro Suite)Black RSI (Pro Suite) is combination of RSI (Relative Strength Index), Volume RSI, Heikin Ashi RSI & other multi Oscillators with multi features into one indicator, features like (Quad Divergences, Multi Time Frame RSI, MTF RSI Panel, Oscillator Support/Resistance/Wedges/Trendlines, Oscillator Moving Average/BBs, Smooth RSI, RSI Price Estimator, Oscillator Over bought/sold Bars, Osc OB/OS Zones, Osc OB/OS Highlights, additionally Black RSI indicator is flexible & completely customizable).
Indicator goal: I have tried my best to organized RSI & other suitable oscillators and oscillator useful tools into one simple and free indicator for Tradingview users (specifically for Tradingview 'basic' subscription users). suggestions are always welcome. please give feedback & appreciate if you like my work.
Black RSI Indicator Features Summary:
Black RSI indicator includes many features mainly relevant to RSI and other Oscillators, these are briefly highlighted below:
Black RSI Dashboard
Multi Oscillators: Choose between multiple oscillators. All oscillators settings are customizable.
Multi Symbol: Multi Symbol Support, applicable on all oscillators
RSI (Relative Strength Index)
VRSI (Volume Relative Strength Index)
HA RSI (Heikin Ashi Relative Strength Index)
OBV (On Balance Volume)
CVD (Comulative Volume Delta)
MFI (Money Flow Index)
UO (Ultimate Oscillator)
MOM (Momentum Oscillator)
ATR (Average True Range)
Stoch (Stochastic Oscillator)
Stoch RSI (Stochastic RSI)
Oscillator Primary Tools ◢
Oscillator Moving Average/Bollinger Bands
Smooth RSI
Multi Timeframe RSI
Multi Timeframe RSI Panel
RSI Price Estimator
Oscillator Support/Resistance/Wedges/Trendlines
Oscillator Moving Average/BBs: Shows Moving Average for selected oscillator.
Smooth Smooth: Smooths out RSI
Multi Timeframe RSI: Displays Multiple Time Frame/Multiple Symbol RSI and converts it and shows it as it is in current time frame without effecting Primary RSI
Multi Timeframe RSI Panel: Displays Multiple Time Frame/Multiple Symbol RSI values of user input specific timeframes in compact panel (max 8 Time frames)
RSI Price Estimator: Calculates RSI estimate price values of 3 different user specific RSI input levels, RSI x MA cross price and RSI future value of user specific price input level.
Oscillator Support/Resistance/Wedges/Trendlines: Draws Trendlines, Wedges and Support & Resistance lines on selected oscillator
Oscillator Quad Divergence ◢
1st Oscillator Divergence: Traditional divergence indicator with enhancements & customization
2nd Oscillator Divergence: Traditional divergence indicator with enhancements & customization
3rd Oscillator Divergence: Advanced Divergence indicator with source selection, RSI/Price threshold, potential divergences & customization
4th Oscillator Divergence: Pivots divergence indicator with flexible pivots selection & customization
Regular bullish divergences are indicated when price is forming lower lows while an oscillator shows higher lows.
Regular bearish divergences are indicated when price is forming higher highs while an oscillator shows lower highs.
While regular divergences indicate trend reversals, hidden divergences indicate a trend continuation.
When the price is making higher lows and the oscillator is showing lower lows, we speak of a bullish hidden divergence.
When the price is making lower highs and the oscillator shows higher highs, it's a bearish hidden divergence.
Oscillator Secondary Tools ◢
Oscillator HH/LL pivots
Osc OB/OS Color Bars
Osc OB/OS Zones
Osc OB/OS Highlights
Background
Oscillator HH/LL pivots: Shows HH/LL pivot points on selected oscillator
Osc OB/OS Color Bars: Plots color chart bars based on RSI, MFI, Stochastic, Stochastic RSI or combine overbought/oversold conditions
Osc OB/OS Zones: Plots Osc OB/OS Zones with user input levels
Osc OB/OS Highlights: Highlight oscillator OB/OS background area
Background: background color customization
+ Primary RSI Settings ▾
- Primary RSI Length: User input RSI Length value
- Primary RSI Source: User RSI Source selection
- RSI Overbought Threshold: Allows the user to set the RSI overbought threshold value. This Overbought Threshold value will also be applied on "RSI Divergence overbought condition", "RSI OB Color Bars" and "Primary RSI Color Schemes
- RSI Oversold Threshold: Allows the user to set the RSI oversold threshold value. The lower band (oversold line) of RSI. This Oversold Threshold value will also be applied on "RSI Divergence oversold condition", "RSI OS Color Bars" and "Primary RSI Color Schemes
- RSI Middle Band: Allows the user to set the RSI middle band value. This value will also applied to "Center Line" color scheme from "Primary RSI Color Schemes" drop menu
- Primary RSI Colors:
Range color specifies a gradient of colors from the overbought to the oversold threshold user inputs from "Primary RSI" section. Color interpolation also a gradient but smoother than Range color. Center Line is similar but is not a gradient, linked to Middle Band ("Primary RSI" section) and changes color with RSI Middle Band. Traditional is simple with Overbought and Oversold colors change.
- RSI Bullish Band: Allows the user to plot extra/optional RSI band on RSI Oscillator (Note: it will not be plotted if "OB/OS Zone only" enabled from "OB/OS Zone Settings" section)
- RSI Bearish Band: Allows the user to plot extra/optional RSI band on RSI Oscillator (Note: it will not be plotted if "OB/OS Zone only" enabled from "OB/OS Zone Settings" section)
+ Primary RSI Smooth Settings ▾
- Smooth Moving Average Type: User selected Smooth MA type. With RSI Smooth enabled, will also effect all RSI Divergences detection (all divergences will be plot according to "Smoothed RSI line")
- Smooth Moving Average Length: User input Smooth MA length value
+ Oscillator Moving Average Settings ▾
- Osc Moving Average Colors: Allows user to select Bullish/Bearish colors of Oscillator Moving Average
- Osc Moving Average Type: Allows user to select Oscillator MA Type
- Osc Moving Average Length: User input Oscillator MA length value
- Osc Moving Average Thickness: User input Oscillator MA thickness
- BB StdDev: user input Bollinger Bands standard deviation value
+ Stochastic Oscillator Settings ▾
- Same as Traditional/Default indicator
+ Stochastic RSI Oscillator Settings ▾
- Same as Traditional/Default indicator
+ Money Index Flow Settings ▾
- Same as Traditional/Default indicator
+ Ultimate Oscillator Settings ▾
- Same as Traditional/Default indicator
+ Momentum Oscillator Settings ▾
- Same as Traditional/Default indicator
+ Average True Range Settings ▾
- Same as Traditional/Default indicator
+ Multi Timeframe RSI Settings ▾
- MTF RSI Time Frame: Allows user to select MTF RSI Time Frame
- MTF RSI Symbol: Allows user to select MTF RSI Time Symbol
- MTF RSI Length: User input MTF RSI length value
- MTF RSI Source: User selected MTF RSI source
- MTF RSI Line Width: User input MTF RSI line thickness value
- Number of Bars for MTF RSI plot
- MTF RSI Color > OB color > OS color : Allows user to select MTF RSI color with additionally Overbought/Oversold colors
+ MTF RSI Panel Settings ▾
- Select MTF RSI Type: If "Primary RSI" or "Volume RSI" selected MTF RSI Panel will show output values based on "Primary RSI" or "Volume RSI" parameters e.g. source, length, but without smooth.
- MTF RSI Panel Symbol: Allows user to select MTF RSI Panel symbol, leave symbol blank or uncheck "checkbox" for current chart symbol
- Show Symbol in Panel: Shows symbol ticker(current or user selected) in MTF RSI Panel
- Panel Background: Allows user to select MTF RSI Panel Background (enable/disable) and Background color selection
- TF1: MTF RSI Timeframe 1 user selection
- TF2: MTF RSI Timeframe 2 user selection
- TF3: MTF RSI Timeframe 3 user selection
- TF4: MTF RSI Timeframe 4 user selection
- TF5: MTF RSI Timeframe 5 user selection
- TF6: MTF RSI Timeframe 6 user selection
- TF7: MTF RSI Timeframe 7 user selection
- TF8: MTF RSI Timeframe 8 user selection
- Panel Top Offset: MTF RSI Panel offset input value
- Position: MTF RSI Panel position selection
- Text Size: MTF RSI Panel text size selection
- Bullish Colors: MTF RSI Panel bullish color selection. (Bullish colors range RSI >75, <75 to >65, <65 to >55)
- Bearish Colors: MTF RSI Panel bearish color selection. (Bearish colors range RSI <45 to >35, <35 to >25, <25)
+ RSI Price Estimator Settings ▾
- Price 1: User input value for RSI future price
- Price 2: User input value for RSI future price
- Price 3: User input value for RSI future price
- Panel Position Offset: User input value for panel position offset
- Price Decimals: User input value for output price decimals in panel
- Show RSI/OscMA cross Price: Enable/Disable RSIxOscillator MA cross future price
- Show RSI Level for Input Price: User input price for future RSI level
- Invisible Background: Enable/Disable Background
Auto Text Color > Auto color change of Panel text according to Dark/Light chart theme
+ Oscillator Support/Resistance Settings ▾
- Show Support line: Allows user to Enable/Disable Oscillator support line
Color > Auto Color: Auto color change of support line according to Dark/Light chart theme
- Show Resistance line: Allows user to Enable/Disable Oscillator resistance line
Color > Auto Color: Auto color display of resistance line according to Dark/Light chart theme
- Lookback lows/highs: User input of Lookback lows/highs value
- Distance threshold: Distance from the line to the low
- Line touch points: Number of points that have to be around the line
- Low/High left bars: User input of Low/High left bars value
- Low/High right bars: User input of Low/High right bars value
- Line style: User selection of line style
- Line thickness: User input of line thickness value
+ Oscillator 1st Divergence Settings ▾
- Divergence Source: User selection of divergence source. "High/Low" (high/low of oscillator/price divergence detection), "Close" (close of oscillator/price divergence detection) and "Both" (Both Close + High/Low of oscillator/price divergence detection). (Note: Traditional Divergence indicator default source is "High/Low")
- Pivot Lookback Right: How many candle to compare on the right side of a candle when deciding whether it is a pivot. The lower the number is, the earlier pivots (and therefore divergences) will be signaled, but the quality of those detections could be lower.
- Pivot Lookback Left: How many candle to compare on the left side of a candle when deciding whether it is a pivot. The lower the number is, the earlier pivots (and therefore divergences) will be signaled, but the quality of those detections could be lower.
- Divergence Max Length (Bars): The maximum length of a divergence (number of bars). If a detected divergence is longer than this, it will be discarded
- Divergence Min Length (Bars): The minimum length of a divergence (number of bars). If a detected divergence is shorter than this, it will be discarded
- Show Divergence as:
- Line Thickness: User input divergence line thickness value
- Label Transparency: it could reduce labels mess on oscillator line, input "100" for label text only without label background
- Labels Text Color: User label text color selection
Auto Text Color > Auto color change of label text according to Dark/Light chart theme
- Bull Divergences: Enable/Disable of Bull divergences
> Color: User selection of Bull divergence color
> Oversold only: It will show Regular Bullish RSI divergences in oversold zone only, RSI oversold threshold can be configure in "Primary RSI Settings" section.
- Bear Divergences: Enable/Disable of Bear divergences
> Color: User selection of Bear divergence color
> Overbought only: It will show Regular Bearish RSI divergences in overbought zone only, RSI overbought threshold can be configure in "Primary RSI Settings" section.
- Hidden Bull Div: Enable/Disable of Hidden Bull divergences
> Color: User selection of Hidden Bull divergence color
- Hidden Bear Div: Enable/Disable of Hidden Bear divergences
> Color: User selection of Hidden Bear divergence color
+ Oscillator 2nd Divergence Settings ▾
- Same as Oscillator 1st Divergence Settings
+ Oscillator 3rd Divergence Settings ▾
- Divergence source: User selection of divergence source . "oscillator" (divergence detection with high/low or close of selected oscillator), "price" (divergence detection with high/low or close of price)
- Bull price source: User selection of Bull price source. Bull price source: "Low" (low of price divergence detection), "Close" (close of price divergence detection) (linked to "price" in "Divergence source")
- Bear price source: User selection of Bear price source. Bear price source: "High" (high of price divergence detection), "Close" (close of price divergence detection) (linked to "price" in "Divergence source")
- Low/High left bars: How many candle to compare on the left side of a candle when deciding whether it is a pivot. The lower the number is, the earlier pivots (and therefore divergences) will be signaled, but the quality of those detections could be lower.
- Low/High right bars: How many candle to compare on the right side of a candle when deciding whether it is a pivot. The lower the number is, the earlier pivots (and therefore divergences) will be signaled, but the quality of those detections could be lower.
- Maximum lookback bars: The maximum length of a divergence (number of bars). If a detected divergence is longer than this, it will be discarded.
- Price threshold: User selection of Price threshold, higher values more lines
- RSI threshold: User selection of RSI threshold, higher values more lines
- Show Lows: Displays lows of RSI
- Show Highs: Displays highs of RSI
- Show Divergence as:
- Line Style:
- Line thickness: User input divergence line thickness value
- Label Transparency: it could reduce labels mess on oscillator line, input "100" for label text only without label background
- Labels Text Color: User label text color selection
Auto Text Color > Auto color change of label text according to Dark/Light chart theme
- Bull Divergences: Enable/Disable of Bull divergences
> Color: User selection of Bull divergence color
> Potential Bull: It will plot potential regular bull divergence with dotted line.
- Bear Divergences: Enable/Disable of Bear divergences
> Color: User selection of Bear divergence color
> Potential Bear: It will plot potential regular bear divergence with dotted line.
- Hidden Bull Div: Enable/Disable of Hidden Bull divergences
> Color: User selection of Hidden Bull divergence color
> Potential H.Bull: It will plot potential hidden bull divergence with dotted line.
- Hidden Bear Div: Enable/Disable of Hidden Bear divergences
> Color: User selection of Hidden Bear divergence color
> Hidden Bear divergence: It will plot potential hidden bear divergence with dotted line.
> Regular Bull oversold only: It will show Regular Bullish RSI divergences in oversold zone only, RSI oversold threshold can be configure in "Primary RSI Settings" section.
> Regular Bear overbought only: It will show Regular Bearish RSI divergences in overbought zone only, RSI overbought threshold can be configure in "Primary RSI Settings" section.
+ Oscillator 4th Divergences Settings ▾
- Upper Length: User pivot input value of draw upper divergence line From
- To Pivot:
- Lower Length: User pivot input value of draw lower divergence line From
- To Pivot:
- Show Divergence as:
- Line Style:
- Line thickness: User input divergence line thickness value
- Label Transparency: it could reduce labels mess on oscillator line, input "100" for label text only without label background
- Labels Text Color: User label text color selection
Auto Text Color > Auto color change of label text according to Dark/Light chart theme
- Bull Divergences: Enable/Disable of Bull divergences
> Color: User selection of Bull divergence color
- Bear Divergences: Enable/Disable of Bear divergences
> Color: User selection of Bear divergence color
- Regular Bull oversold only: It will show Regular Bullish RSI divergences in oversold zone only, RSI oversold threshold can be configure in "Primary RSI Settings" section.
- Regular Bear overbought only: It will show Regular Bearish RSI divergences in overbought zone only, RSI overbought threshold can be configure in "Primary RSI Settings" section.
+ Oscillator HHLL Pivots Settings ▾
- Pivot Length: User input value of HH/LL pivot length
> L.Text Color: User label text color selection
- HH color: User HH Label color selection
- HL color: User HL Label color selection
- LH color: User LH Label color selection
- LL color: User LL Label color selection
+ Oscillator OB/OS Colored Bars Settings▾
- Overbought/Oversold Bars Oscillator: Plots Overbought/Oversold color bars based on RSI, MFI, Stoch, Stoch RSI overbought/oversold threshold conditions separately or combined(when every oscillator reach its OB or OS threshold condition at same time).
- Overbought Bar Color: User RSI OB Bars color selection
- Oversold Bar Color: User RSI OS Bars color selection
+ Primary RSI Range Color ▾
- OB: Overbought Color
- OS: Oversold Color
- Bullish: Bullish Color
- Bearish: Bearish Color
+ Primary RSI Color interpolation ▾
- RSI Color: RSI Color
- OB: Overbought Color
- OS: Oversold Color
+ Primary RSI Center Line Color ▾
- OB: Overbought Color
- Bullish: Bullish Color
- Bearish: Bearish Color
- OS: Oversold Color
+ Primary RSI Traditional Color ▾
- RSI Color: RSI Color
- OB: Overbought Color
- OS: Oversold Color
Osc Overbought/Oversold Zones Settings ▾
- OB/OS Zone Band Lines: Enable/Disable OB/OS Zone Band Lines
- OB/OS Zones only: Only shows OB/OS Zones and disable all RSI band lines except Middle Band. Background will not be effected by this setting.
- Overbought Zone: User input value of Overbought Zone from
> To:
- Oversold Zone: User input value of Oversold Zone from
> To:
Osc Overbought/Oversold Highlights ▾
- Overbought Highlights : Enable/Disable Overbought Highlights
- Oversold Highlights : Enable/Disable Oversold Highlights
- Transparency: Gradient transparency of highlighted area
+ 'Oscillators Color Settings ▾
- Show Osc Symbol label : Enable/Disable of oscillator symbol label. Displays current oscillator symbol, but with "Override Oscillator Symbol" enabled from "Black RSI Dashboard" it will Auto/forcefully displays Override Oscillator Symbol on Oscillator
- Fade out Oscillator line: Fade out the oscillator line color, focusing only the most recent periods prominent for a clearer chart
- Fill Stoch/StochRSI lines: Fills Stoch/Stoch RSI lines
- Oscillator line thickness: user input value of oscillator line thickness
- Oscillator line offset: Shifts the oscillator to the left or to the right on the given number of bars, Default is 0
- OBV Color
- MFI Color
- ATR Color
- UO Color
- MOM Color
- CVD Bullish Color
- CVD Bearish Color
+ Background Setting ▾
- Custom Background Color: User selection of Background color
Authors & Credits: I'd like to THANK to Nabeel Black(myself), LonesomeTheBlue, iFuSiiOnzZ, jmosullivan, zdmre, creengrack, and TradingView for the locally sourced ingredients.
Disclaimer: DYOR. Not financial advice. Not a trading system. I am not affiliated with TradingView or any authors mentioned here; You alone have the sole responsibility of evaluating the script output and risks associated with the use of the script. Trading success is all about following your trading strategy and the indicators should fit within your trading strategy, and not to be traded upon solely. Always trade with confluence and Risk Management.
Feedback & Bug report
if you found any bug in this indicator or any suggestion, please let me know. Please give feedback & appreciate if you like to see more future updates and indicators. Thank you

EsIstTurnt's Relative Value Comparison Multi SymbolCompare the relative valuation of up to 8 tickers. By taking a shorter term moving average and dividing by a longer term moving average(optionally with an offset) we get a value that is either above or below 1. Easy to tell what is undervalued and overvalued with this setup. Useful for comparing different asset classes or sector specific securities looking for outperformers/underperformers. Overvalued and Undervalued levels marked by Red and Green background. Recommended in conjunction with other indicators of your choosing for confirmation of trend changes but this is good for getting a broader view of the market you're interested in. Multiple timeframes, sources available however you should tinker with it to find what gives you the best view for your preferred timeframe.
