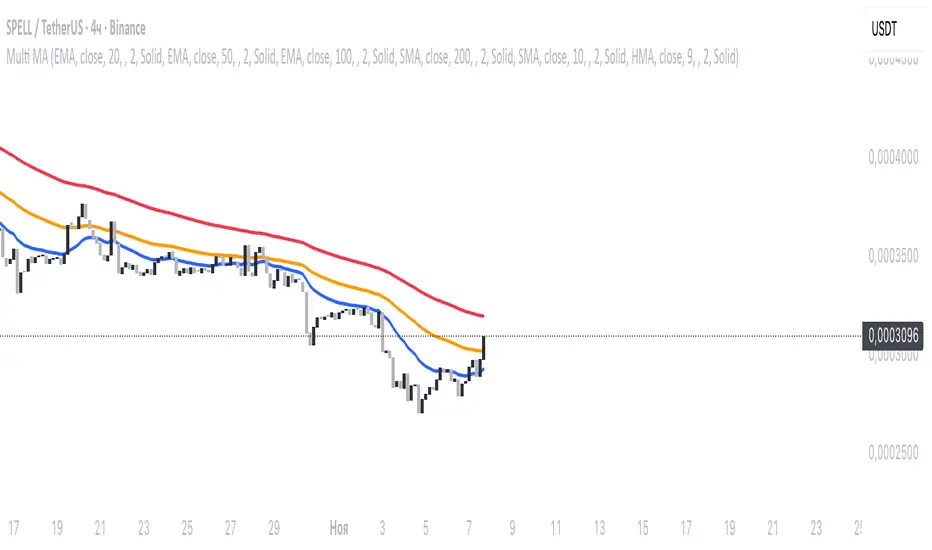
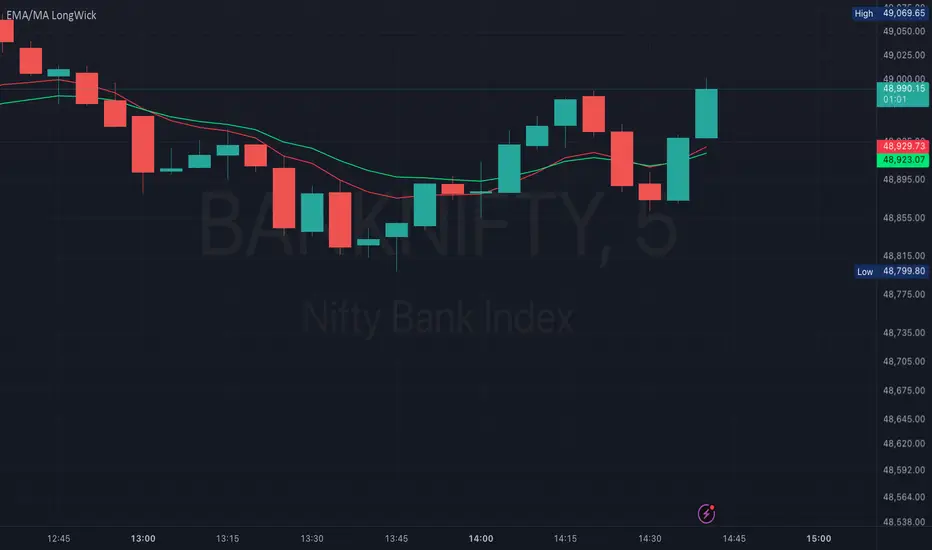
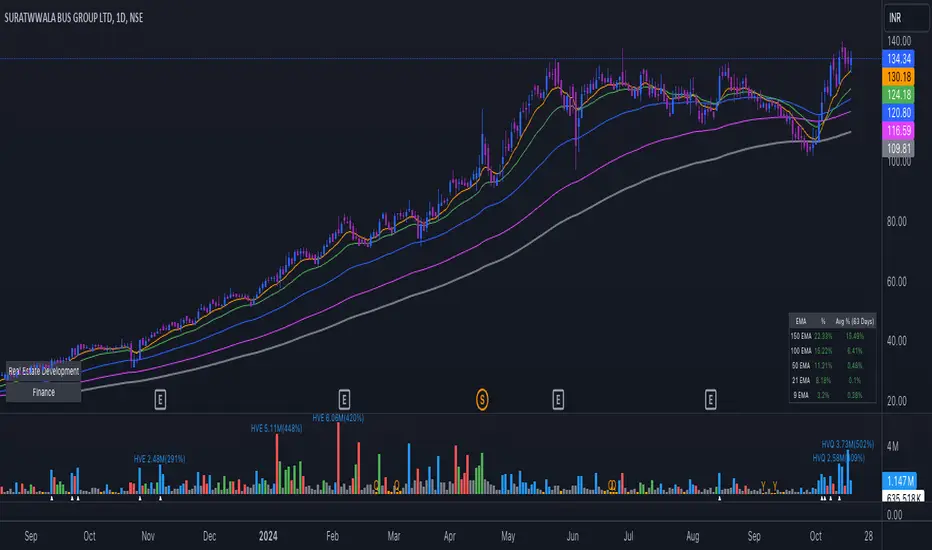
EMA/MA with OHCL Candle and Long Wick – A Comprehensive Trading
Dear Traders,
I am excited to introduce EMA/MA with OHCL Candle and Long Wick, a powerful trading indicator designed to enhance market analysis by combining Exponential Moving Averages (EMA), Simple Moving Averages (MA), OHCL candle patterns, and long wick detection into a single tool.
Key Features:
✅ Customizable Wick Size & Timeframe – Adapt the indicator to different market conditions by adjusting wick size and analyzing price action over any timeframe.
✅ EMA & MA for Trend Analysis – Includes multiple EMAs and MAs (5, 9, 15, 20, 50, 100, 200) to help identify trends and potential reversals.
✅ Long Wick Signal Detection – Identifies strong Buy and Sell opportunities based on wick size, signaling potential market turning points.
✅ OHCL Candle Analysis – Highlights OHCL patterns to provide additional insights into price action.
✅ User-Friendly & Lightweight – Efficiently coded for seamless performance on TradingView.
This indicator is perfect for traders looking to refine their entry and exit strategies by leveraging price action and moving averages. Whether you're a scalper, day trader, or swing trader, this tool provides valuable insights to enhance your decision-making.
Give it a try, and let me know your feedback! 🚀
Best regards,
Purnendu Singh
Multiema
EMA Distance & Sector InfoThis indicator provides insights into price trends relative to Exponential Moving Averages (EMAs) and displays sector/industry information about the asset. Below is a detailed explanation of its purpose and what it is designed to achieve:
Purpose of the Code
The indicator offers two key functionalities:
1. Analyzing Price Distance from Multiple EMAs:
• Helps traders understand how far the current price is from key EMAs, expressed as a percentage.
• Calculates average percentage distances over a specified period (default: 63 days) to spot consistent trends or mean reversion opportunities.
• Useful for trend-following strategies, allowing the trader to see when the price is above or below important EMAs (e.g., 9, 21, 50, 100, and 150-period EMAs).
2. Displaying Asset Sector and Industry Information:
• Displays the sector and industry of the asset being analyzed (e.g., Technology, Consumer Goods).
• Provides additional context when evaluating performance across a specific sector or comparing an asset to its peers.
Who Would Use This Indicator?
This indicator is particularly helpful for:
1. Swing Traders and Positional Traders:
• They can use it to track whether the price is trading significantly above or below critical EMAs, which often signals overbought/oversold conditions or trend strength.
• The average percentage distances help to identify momentum shifts or pullback opportunities.
2. Sector/Industry-Focused Investors:
• Understanding an asset’s sector and industry helps investors gauge how the asset fits into the broader market context.
• This is valuable for sector rotation strategies, where investors shift funds between sectors based on performance trends.
How It Helps in Trading Decisions
1. Entry and Exit Points:
• If the price is far above an EMA (e.g., 21 EMA), it might indicate an overbought condition or a strong trend, while a negative percentage could signal a pullback or reversal opportunity.
• The average percentage distances smooth the fluctuations and reveal longer-term trends.
2. Contextual Information:
• Knowing the sector and industry is useful when analyzing trends. For example, if Technology stocks are doing well, and this asset belongs to that sector, it could indicate sector-wide momentum.
Summary of the Indicator’s Purpose
This code provides:
• EMA trend monitoring: Visualizes the price position relative to multiple EMAs and averages those distances for smoother insights.
• Sector and industry information: Adds valuable context for asset performance analysis.
• Decision-making support: Helps traders identify overbought/oversold levels and assess the asset within the broader market landscape.
In essence, this indicator is a multi-purpose tool that combines technical analysis (through EMA distances) with fundamental context (via sector/industry info), making it valuable for traders and investors aiming to time entries/exits or understand market behavior better.
Multi EMA+SMAMulti EMA+SMA with default value of 20/50/200 ... User can change value and color as required... As ema and sma both has same value thats why only three lines are visible, changing value will reflect other Moving averages. Hope it will help my trader friends.
Love
Indyan...