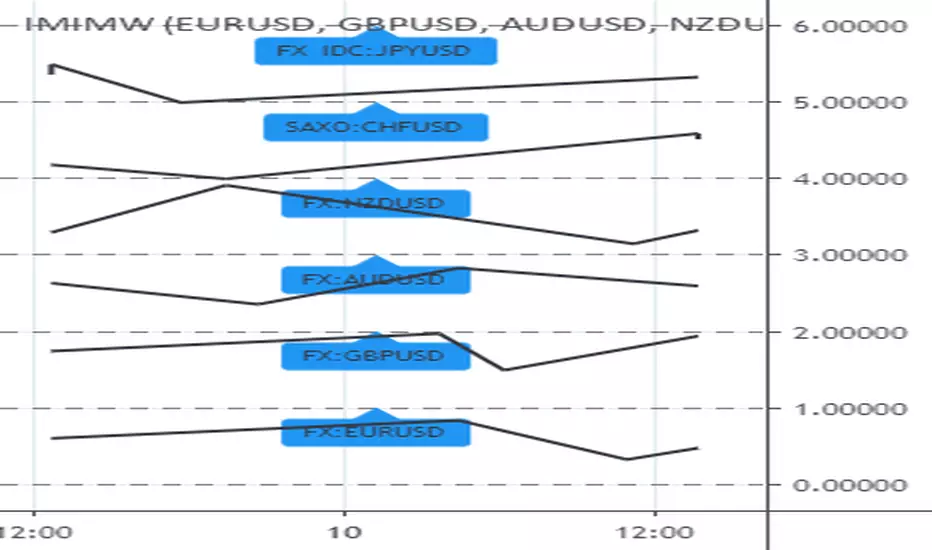
Ultimate Major Contextual Dashboard (Multi-Asset)Overview : The Ultimate Major Dashboard is a performance-optimized market overview tool designed to provide a consolidated snapshot of the 7 major Forex pairs and Gold. It aggregates correlation, trend, momentum, and volatility data into a single, clean table, allowing users to view broader market context without switching charts.
Technical Logic & Components : This indicator utilizes a modular function to analyze EURUSD, GBPUSD, USDJPY, USDCHF, AUDUSD, USDCAD, NZDUSD, and XAUUSD across four key dimensions:
Intermarket Correlation (Pearson Coefficient): Uses ta.correlation() to compare each asset against the symbol currently on your main chart.
Logic: Values above 0.7 (Dark Green) suggest a strong positive relationship, while values below -0.7 (Dark Red) suggest inverse behavior. This is calculated over a rolling 50-period window to balance stability with current market sensitivity.
Trend Bias (EMA-200): Evaluates the long-term trend by checking price position relative to the 200-period Exponential Moving Average.
Visuals: An upward arrow (⬆) indicates price is above the EMA; a downward arrow (⬇) indicates it is below.
Momentum (RSI-14): Calculates the Relative Strength Index. The dashboard automatically highlights readings above 70 (OB) or below 30 (OS) to help identify potential momentum extremes.
Volatility (ATR-14): Displays the Average True Range as a reference for the current active range of each market, helping users compare volatility levels across the majors.
How to Interpret the Dashboard
Asset Alignment: Correlation values help identify when pairs are moving in "unison" versus when a specific currency is diverging from the group.
Directional Context: Combining the Trend (EMA) and Momentum (RSI) columns provides a quick view of whether a market is trending strongly or reaching an exhaustion point.
Volatility Benchmarking: The ATR values offer perspective on which pairs are currently the most active, assisting in market comparison based on volatility preference.
Data Handling & Customization
Multi-Symbol Sync: Data is fetched using request.security(). The calculations are synchronized with the chart's current bar state for real-time accuracy.
Dynamic TF: Users can select the analysis timeframe (60, 240, D, W) via the settings menu.
Flexibility: The dashboard position can be toggled between all four corners of the chart to avoid overlapping with price action.
Disclaimer
This tool is provided for analytical and educational purposes only. It does not generate trading signals and should not be considered financial advice.
Multi-asset

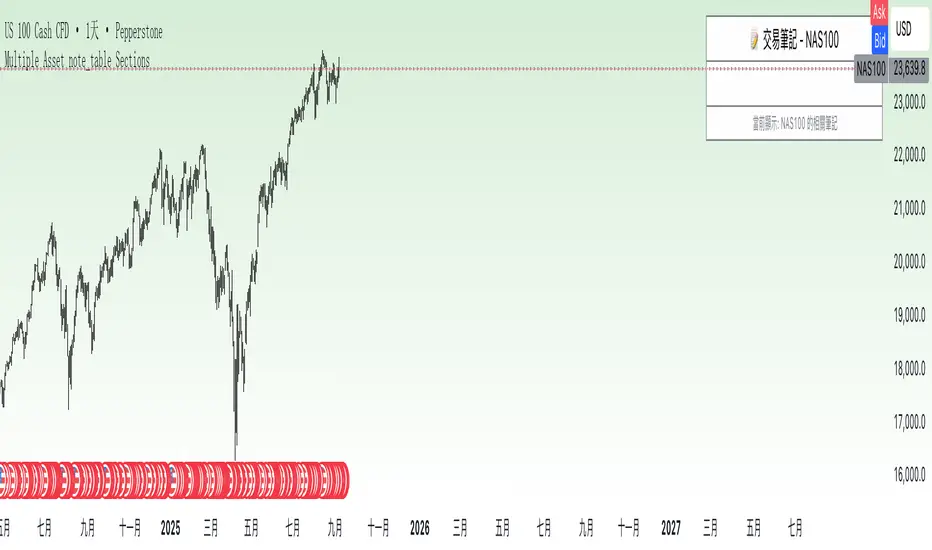
Multiple Asset note_table Sections### Features
- **Expanded to 10 independent Sections**: Each Section has a title, content, and associated asset
- **Asset-based filtering**: Section only displays when the Section's asset name is empty or matches the current chart asset
- **Empty asset setting retained**: If Section asset name is left blank, that Section will display across all assets
- **Automatic display of current asset**: Current asset name is automatically shown in the header and footer
### Usage Instructions
1. Each Section can be assigned a specific asset name, such as "BTCUSDT", "ETHUSDT", etc.
2. A Section will only display when the current chart asset matches the asset specified for that Section
3. If you want a Section to display across all assets, simply leave the asset name blank for that Section
4. Each Section has independent title and content that can be customized as needed
5. When switching to different trading instruments, the indicator automatically displays notes relevant to the current instrument
Multi Asset & TF Stochastic
Multi Asset & TF Stochastic
This indicator allows you to compare the stochastic oscillator values of two different assets across multiple timeframes in a single pane. It’s designed for traders who want to analyse the momentum of one asset (by default, the chart’s asset) alongside a second asset of your choice (e.g., comparing EURUSD to the USD Index).
How It Works:
Main Asset:
The indicator automatically uses the chart’s asset for the primary stochastic calculation. You have the option to adjust the timeframe for this asset using a dropdown that includes TradingView’s standard timeframes, a "Chart" option (which automatically uses your chart’s timeframe), or a "Custom" option where you can type in any timeframe.
Second Asset:
You can enable the display of a second asset by toggling the “Display Second Asset” option. Choose the asset symbol (default is “DXY”) and select its timeframe from an identical dropdown. When enabled, the script calculates the stochastic oscillator for the second asset, allowing you to compare its momentum (%K and %D lines) with that of the main asset.
Stochastic Oscillator Settings:
Customize the %K length, the smoothing period for %K, and the smoothing period for %D. Both assets’ stochastic values are calculated using these parameters.
Visual Display:
The indicator plots the %K and %D lines for the main asset in prominent colours. If the second asset is enabled, its %K and %D lines are also plotted in different colours. Additionally, overbought (80) and oversold (20) levels are marked, with a midline at 50, making it easier to gauge market conditions at a glance.
%D line can be toggled off for a cleaner view if required:
Asset Information Table:
A table at the top-centre of the pane displays the active asset symbols—ensuring you always know which assets are being analysed.
How to Use:
Apply the Indicator:
Add the script to your chart. By default, it will use the chart’s current asset and timeframe for the primary stochastic oscillator.
Adjust the Main Asset Settings:
Use the “Main Asset Timeframe” dropdown to select a specific timeframe for the main asset or stick with the “Chart” option for automatic syncing with your current chart.
Enable and Configure the Second Asset (Optional):
Toggle on “Display Second Asset” if you wish to compare another asset. Select the desired symbol and adjust its timeframe using the provided dropdown. Choose “Custom” if you need a timeframe not listed by default.
Review the Plots and Table:
Observe the stochastic %K and %D lines for each asset. The overbought/oversold levels help indicate potential market turning points. Check the table at the top-centre to confirm the asset symbols being displayed.
This versatile tool is ideal for traders who rely on momentum analysis and need to quickly compare the stochastic signals of different markets or instruments. Enjoy seamless multi-asset analysis with complete control over your timeframe settings!