MTF Moving Averages (only EMA)MTF Moving Averages (only EMA)
This script provides a Multi-Timeframe (MTF) Exponential Moving Average (EMA) indicator for traders to visualize multiple EMAs across different timeframes directly on a single chart.
The indicator dynamically calculates and plots up to four EMAs per timeframe (15-minute, 30-minute, 1-hour, and Daily) with user-defined lengths, offering valuable insight into price trends and potential entry or exit points.
Key Features:
Multiple Timeframe Support: The script allows you to view EMAs from different timeframes simultaneously. This is especially useful for traders who follow trends across different timeframes to make more informed decisions.
Customizable Lengths: For each timeframe, the lengths of the EMAs are fully customizable. You can adjust the length of up to four EMAs per timeframe to suit your strategy.
EMA Calculation: The Exponential Moving Average (EMA) is used, which gives more weight to recent prices and reacts faster to price changes compared to the simple moving average (SMA).
Timeframe Flexibility: The indicator supports the following timeframes:
15-minute: Ideal for short-term traders and scalpers.
30-minute: For intraday trading with a slightly longer perspective.
1-hour: Suitable for swing traders and those who prefer a more medium-term view.
Daily: Great for longer-term trend-following strategies.
Interactive and User-Friendly: You can toggle the visibility of each EMA on each timeframe, allowing you to choose exactly which EMAs you wish to display, depending on your trading strategy.
Color-Coded for Clarity: The script uses distinct colors for each EMA on the chart:
Blue: EMA1
Green: EMA2
Red: EMA3
Purple: EMA4
Line Width Customization: Each plotted EMA line has a customizable width for better visual clarity.
Use Case:
Traders who use multiple timeframes for analysis (e.g., those using the "multi-timeframe analysis" technique) will find this script particularly useful. For example, a trader may look at the 15-minute chart to catch short-term movements, the 30-minute chart for intraday trends, the 1-hour chart for swing positions, and the Daily chart for identifying the overarching market trend. The script enables them to view the EMAs for all these timeframes in one glance without having to manually switch between them.
By observing the relationships between EMAs across multiple timeframes, traders can gain valuable insights into market conditions such as:
Crossovers: When a shorter-term EMA crosses above or below a longer-term EMA, it can signal a potential trend reversal or continuation.
Trend Strength: Multiple EMAs in alignment across different timeframes can indicate strong trend strength.
Support and Resistance: EMAs can act as dynamic support and resistance levels, guiding traders on price action levels to watch for potential price reversals.
Instructions:
Enable/Disable EMAs: Toggle on or off the EMAs for each timeframe (15-min, 30-min, 1-hour, Daily) using the script’s settings.
Adjust EMA Lengths: Change the default lengths for each EMA to match your preferred settings for different timeframes.
Monitor Key Levels: Watch how price interacts with the plotted EMAs to spot potential trading signals based on your strategy.
This indicator is designed to enhance your multi-timeframe analysis and help make more informed, data-driven trading decisions.
Mtfma

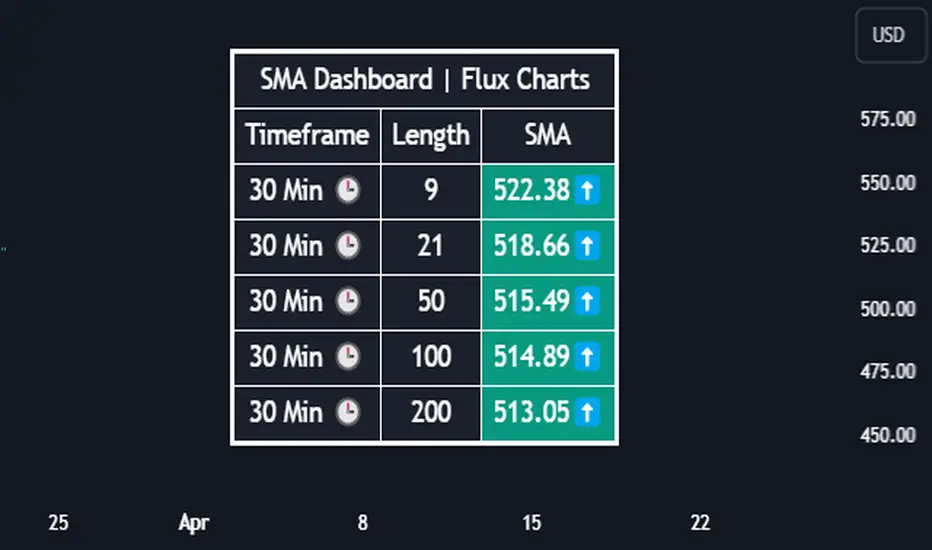
SMA Dashboard | Flux Charts💎 GENERAL OVERVIEW
Introducing our new Simple Moving Average (SMA) Dashboard! This dashboard let's you select a source for the calculation of the SMA of it, then shows it across 5 different lengths and timeframes.
Features of the new SMA Dashboard :
Shows SMA Across 5 Different Lengths & Timeframes.
Select Any Source, Including Other Indicators.
Enable / Disable Plotting Lines.
Customizable Dashboard.
📌 HOW DOES IT WORK ?
SMA is a widely used indicatior within trading community, it simply works by taking the mathematical average of a source by desired length. This indicator then shows it across 5 different timeframes in a dashboard and plots them in your chart for ease of use.
🚩UNIQUENESS
This dashboard cuts through the hassle of manual SMA calculations and plotting. It offers flexibility by allowing various data sources (even custom indicators) and customization through enabling / disabling SMA lines. The clear visualization lets you compare multiple SMAs efficiently.
⚙️SETTINGS
1. Timeframes
You can set up to 5 timeframes & lengths for the dashboard to show here. You can also turn on plotting and enable / disable them.
2. General Configuration
SMA Source -> You can select the source for the calculation of the SMA here. You can select sources from other indicators as well as more general sources like close, high and low price.
MTF MAs and Crosses Nexus [DarkWaveAlgo]🧾 Description:
A nexus is a connection, link, or neuronal junction where signals and information are transmitted between different elements.
The MTF MAs and Crosses Nexus indicator serves as a nexus between MTF Moving Averages by facilitating the visualization and interaction of up to eight multi-timeframe moving averages, each with its own customizable timeframe, period, cross-over and cross-under alerts and plot markers, moving average calculation type, and price source.
It acts as a utility/control center that brings together multiple MTF moving averages (MTF MAs) and allows you to visualize the interactions between them with exceptional ease-of-use and customizability, helping to provide you with valuable insights into potential trend reversals, momentum shifts, and trading opportunities.
💡 Originality and Usefulness:
While there are other multi-timeframe moving average indicators available, MTF MAs and Crosses Nexus' customizable alert and signal settings offer intra-indicator MTF moving average cross markers and alerts not seen in other MTF MA indicators, allowing you to visualize the cross-over and cross-under relationships between the indicator's MAs with an 'all-in-one' experience. We also believe it stands above the rest with its sheer quantity and quality of settings, features, and usability.
✔️ Re-Published to Avoid Misleading Values
This script has been re-published to ensure that it does not use `request.security()` calls using lookahead_on to access future data when referencing moving averages from other timeframes. This decreases the likelihood that the indicator will provide deceiving values. This change has been made in accordance with the PineScript documentation: "Using barmerge.lookahead_on at timeframes higher than the chart's without offsetting the `expression` argument like in `close ` will introduce future leak in scripts, as the function will then return the `close` price before it is actually known in the current context" and the Publishing Rule: "Do not use `request.security()` calls using lookahead to access future data".
💠 Features:
8 toggleable MTF Moving Averages with customizable timeframes, periods, moving average calculation types, and price sources
Customizable cross-over and cross-under alert and chart signal options for each MTF MA (toggleable cross alerts and signals for crosses between intra-indicator MAs and bar price values)
Aesthetic and flexible coloring and color theme styling options
End-of chart labels and options for ease-of-use and legibility
⚙️ Settings:
Use a Color Theme: When this setting is enabled, all manual 'Bullish and Bearish Colors' are overridden. All plots will use the colors from your selected Color Theme - excepting those plots set to use the 'Single Color' coloring method.
Color Theme: When 'Use a Color Theme' is enabled, this setting allows you to select the color theme you wish to use.
Hide MAs on Timeframes Lower Than the Chart: When this setting is enabled, any MTF MA with a timeframe smaller than that of the chart the indicator is applied to will be hidden from view.
Enable: Show/hide a specific MTF MA.
Timeframe: Set the timeframe for a specific MTF MA.
Period: Set the lookback period for a specific MTF MA.
Type: Set the calculation type for a specific MTF MA. Options include: Exponential, Simple, Weighted, Volume-Weighted, and Hull.
Source Price: Set the source value used for a specific MTF MA's calculation.
Enable Cross Over Signals & Alerts: When enabled, cross-over chart signals (markers) and alerts are enabled for when this specific MTF MA crosses above its respective 'Cross Over Cross Source'.
Enable Cross Under Signals & Alerts: When enabled, cross-under chart signals (markers) and alerts are enabled for when this specific MTF MA crosses below its respective 'Cross Under Cross Source'.
Cross Source: Set the target plot which this specific MTF MA must cross (for either a cross-over or cross-under event) to trigger a chart signal and alert.
Marker Position: Set the position where this specific MTF MA's cross chart signal should appear. Options include: Above Bar, Below Bar, and On MA Line.
Coloring Method: Set the coloring method for this specific MA. The coloring method defines how the MA should be dynamically colored. Options include: Single Color, Increasing/Decreasing, and Over/Under Price.
Bullish Color: When 'Use a Color Theme' is disabled, this will set the 'bullish color' for this specific MTF MA.
Bearish Color: When 'Use a Color Theme' is disabled, this will set the 'bearish color' for this specific MTF MA.
Single Color: When the 'Coloring Method' is set to Single Color for this specific MA, this color option will set the MA's color.
Enable Label: When enabled, a label will show at the end of the chart displaying the timeframe, period, MA type, and current price value of this specific MTF MA.
Size: Sets the font size of this specific MTF MA's label.
Label Offset (in Bars): Sets the distance from the latest bar, in bars, at which this specific MTF MA's label is displayed.
Show Label Line: When enabled, this specific MTF MA's label will be accommodated by a dashed line connecting it to its plot.
📈 Chart:
The chart shown in this original publication displays the 15 minute chart on BTCUSDT. Displayed on the chart are 4 MTF MAs: the 15m 20 WMA, 30m 100 EMA, 1h 11 EMA, and 1D 7 VWMA - offering an exemplary view of how you can use these MTF MAs and crosses to your advantage in gauging trend relationships across multiple timeframes.

Multiple Moving Avg MTF TableThis script replaces the other script that was just the SMAs that where in a Multi Time Frame Table as this was a redo of that one and this one is SO MUCH MORE!!!!
Not only does this one do the Simple Moving Avg 5, 10, 20, 50, 120, 200 into a table that shows Current/Hourly/Daily/Weekly/Monthly/Quarterly ( 3M )/ Yearly. It now does Exponential Moving Avg , Weighted Moving Avg , and Volume Weight Moving Avg along with Simple Moving Avg.
I still use this script so that you can quickly capture the values so that short-term, and long-term resistance and support can be determined during market hours. Even better now you can select between SMA / EMA / WMA /or VWMA .
imgur.com
The table will change to the values based on the Choice of the type of Moving Avg and if you change the default values.
Now it will take a little bit for the table to show up, so please be patient. I have tested it with stocks, forex, and crypto.

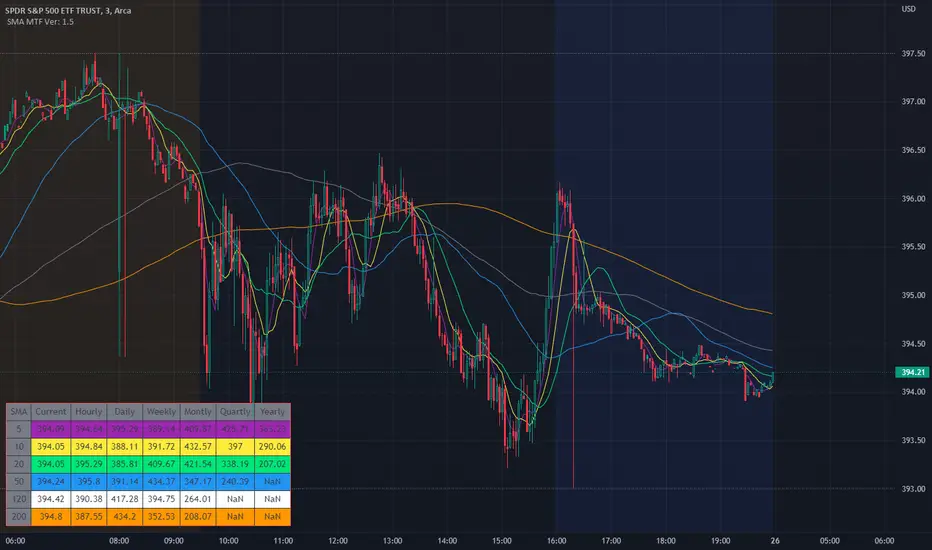
SMA Multi Time Frame Table V1.5Since I couldn't find a script like this I made one so here is what it does.
The script will plot on the chart as well as post the related data into the table.
The default Simple Moving Avg are 5, 10, 20, 50, 120, 200 which can also be changed to whatever SMA you would like. The SMA values are then plotted on the charts so that quickly check to see where they are and how the candles are reacting to the SMAs.
Not only does the script plot the SMAs but it also places higher time frames into the table that is in the script, from current price, to daily, weekly, monthly, quarterly (3 months if you don't have it added) and yearly. The reason why was it price action of the stock does interact and can be rejected or find support from SMA on a higher time frames.
I still use this script so that you can quickly capture the values so that short-term, and long-term resistance and support can be determined during market hours.
Another good thing is that when you change the values in the script settings it also applies those settings to the table as well.
Now it will take a little bit for the table to show up, so please be patient. I have tested it with stocks, forex, and crypto.
I wanted to get this published and I am still working on the background to try and get EMAs. Where you can flip over to EMA to also see the EMA plots and table values for the MTF.
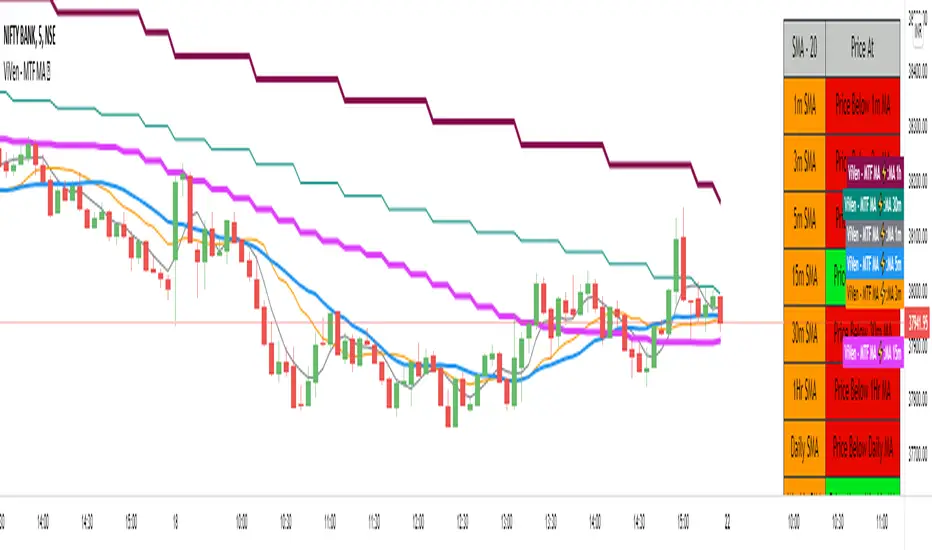
ViVen - Multi Time Frame - Moving Average StrategyHi Traders,
Indicator Description : Multiple Time Frame Moving Average lines in One Chart.
Moving Average Types : SMA, WMA, EMA
Moving Average Period : 20 Default (Variable up to 200)
MA Time Frame : 1m, 3m, 5m, 15m, 30m, 1Hr, Daily, Weekly, Monthly (All lines in one chart)
You can turn ON/OFF the moving average lines based on your requirement.
Moving Average Table : The table will give you an idea where the price is currently trading (LTP), if the price is above any of the moving average then it will show you the Price is above MA and wise versa.
Trading Method:
Monthly, Weekly, Daily and 1Hr Moving averages will tell you whether the script is in Bullish Trend or Bearish Trend.
Basically the moving averages will act as Support and Resistance Levels. With candle confirmation you can take trade.
Ready to Take Position - When 1m MA Crosses 3m MA (Upside / Downside)
BUY Strategy:
"Buy" - when 3m MA breaks 5m moving average on the upside. (Intraday/Scalp)
"Hold" - when 5m MA breaks 15m MA on the upside.
"Strong Hold" - when 15m MA breaks 1Hr MA on the upside for Long term.
"Exit" - when 3m MA breaks 5m MA on the Downside.
SELL Strategy:
"Sell" - when 3m MA breaks 5m moving average on the Downside. (Intraday/Scalp)
"Hold" - when 5m MA breaks 15m MA on the Downside. (Intraday)
"Strong Hold" - when 15m MA breaks 1Hr MA on the Downside. (Positional).
"Exit" - when 3m MA breaks 5m MA on the Downside.
If you agree with this strategy and works well please like this script, share it with your friends and Follow me for more Indicators.
In the next Version, I will come up with Strategy table that I have explained here.
Thanks for your support.
Multiple MA with Multi-Display Mode(MTF/Non MTF)Japanese below / 日本語説明は下記
This indicator shows 6MA(SMA or EMA) with 3 different display modes, which are MTF, Non-MTF and Display on Specific Timeframe.
1. MTF mode
2. Non MTF Mode(Display always)
3. Display on specific timeframe
1. MTF mode
MA becomes MTF MA, meaning that a MA is displayed on the timeframe that users select as MTF MA timeframe or lower timeframe.
i.e. If you select Daily timeframe from MTF MA timeframe, MA will be displayed on daily or lower timeframe; daily, 4 hour, 1 hour, 30mins, 15min, 5mins, 1min.
Note: You need to select "MTF MA timeframe" on input screen.
Sample chart
(left: 1 hour, middle: 4 hour, right: Daily, MA setting; 50MA of 4hour chart)
2. Non MTF Mode(Display always)
MA will always be displayed regardless of timeframe that users open.
Note: If you select Non MTF Mode, MTF MA timeframe on input screen is ignored.
3. Display on specific timeframe
When you select this mode, MA will be displayed only on the specific timeframe that you select from “MTF timeframe or Display timeframe” on the input screen.
If you would like an MA to be displayed only on specific timeframe, this would be your choice.(for example, MA on 1 hour chart only)
Sample chart
(left: 1 hour, middle: 4 hour, right: Daily, MA setting; 50MA of 4hour chart)
How to use this indicator?
This indicator is paid indicator and invited-only indicator.
Please contact me via private chat or follow links in my signature so that I can grant the access right to the indicator.
Comment section is only for comments on the indicator or updates. Please refrain from contacting me using comments to follow TradingView house rules.
————————
6本の移動平均線(MA)を異なる3つのモードで表示できるインジケーターです。(SMAかEMAの選択可)
モード1: MTFモード
モード2: Non-MTFモード(常に表示)
モード3: 特定のタイムフレームのみに表示
1. MTFモード
この表示モードを選択すると、上位足のMAを下位足に表示するMAとなります。
選択した上位足のタイムフレーム(時間軸)と、それ以下のタイムフレームにのみMAが表示されます。
例: 上位足のタイムフレームとして日足を選択した場合、MAは日足、4時間足、1時間足、30分足、15分足、5分足、1分足に表示されます。
サンプルチャート
(左: 1時間足, 中央:4時間足, 右:日足, MA設定: 4時間足の50MA)
2. Non-MTFモード(常に表示)
MAはユーザーの開いているチャートのタイムフレームに関係なく常に表示されます。
一般的な移動平均線と同じ挙動です。
3. 特定のタイムフレームのみに表示
このモードでは移動平均線は指定した特定のタイムフレームにのみ表示されます。
例えば期間50の移動平均線を15分足チャートにだけ表示させたいような要件がある場合、このモードが最適です。
サンプルチャート
(左: 1時間足, 中央:4時間足, 右:日足, MA設定: 4時間足の50MA)
インジケーターの使用について
当インジケーターは招待制インジケーター(有料)となっています。
使用を希望される方はプライベートチャットや下記リンクのDMでご連絡ください。
このページのコメント欄はインジケーターそのものに対するコメントやアップデートの記載のためのものとなっております。Tradingviewのハウスルールを守るためにもコメント欄からの連絡はご遠慮ください。

Moving Average with Multiple Display Mode(MTF/Non MTF MA)Japanese below / 日本語説明は下記
It's an upper version of "MTF SMA on specific timeframe(5M-4H)" which I previously developed.
MTF SMA on specific timeframe(5M-4H)
This is a simple indicator that shows a moving average(MA) but you can choose two display mode depending on your needs;
1. MTF mode
2. Non MTF Mode(Display always)
1. MTF mode
MA becomes MTF MA, meaning that a MA is displayed on the timeframe that users select as MTF MA timeframe or lower timeframe.
i.e. If you select Daily timeframe from MTF MA timeframe, MA will be displayed on daily or lower timeframe; daily, 4 hour, 1 hour, 30mins, 15min, 5mins, 1min.
Note: You need to select "MTF MA timeframe" on input screen.
2. Non MTF Mode(Display always)
MA will always be displayed regardless of timeframe that users open.
Note: If you select Non MTF Mode, MTF MA timeframe on input screen is ignored.
Enjoy your trading!
----------------------------------------------------
以前リリースした "MTF SMA on specific timeframe(5M-4H)" の上位バージョンインジケーターです。
MTF SMA on specific timeframe(5M-4H)
1本の移動平均線(MA)を表示するインジケーターですが、ユーザーのニーズに応じて二つの表示モードを選択することができます。
1. MTFモード
2. Non MTFモード
(常に表示)
1. MTFモード
上位足のMAを下位足に表示するMTF MAとして機能させることができます。MAはユーザーが上位足のタイムフレームとして選択したタイムフレームとそれ未満のタイムフレームで表示されます。
例: 日足を上位足タイムフレームとして選択した場合、日足のMAが日足とそれ以下のタイムフレーム(4時間足、1時間足、30分足、15分足、5分足、1分足)に表示されます。
注: 設定画面で"MTF MA timeframe" を上位足のタイムフレームとして選択してください。
2. Non MTFモード
(常に表示)
ユーザーが現在開いているタイムフレームに関係なく、設定したMAが各タイムフレームで常に表示されます。通常の移動平均線インジケーターと同じ機能です。
注: Non MTFモードを選択した場合、設定画面のMTF MA timeframe は無視されます。

12 multi time frame MA displayed on specific timeframe/複数MTF MAJapanese below. / 日本語説明は下記
——Republishing after issues pointed out by a moderator resolved.—————
This indicator shows 12 sets of multi time frame moving average(MTF MA) from different time frames which is weekly, daily, 4 hour and 1 hour to lower time frames.
Purpose
This indicator has been developed to show higher timeframe’s moving average as they are expected to work as support and resistance .
How is it different from other MTF MA indicators?
Problems with other conventional MTF MA indicators are;
1.If you set higher timeframe MA, it will also be shown on further higher time frames.
e.g. If you set 4hour chart’s MA on 1 hour or lower time frame charts, it will also appear on daily and weekly chart, which is unnecessary and annoys your chart.
2.One indicator displays one MTF MA only which impacts the number of indicators that you can set.
To tackle these problems, this indicator has incorporated functions below.
1. Control time frames where MTF MA is displayed to avoid showing unnecessary information.
2. One indicator contains 12 MTF MA in which 3 MTF MA from weekly chart, 3 MTF MA from daily chart , 3 MTF MA from 4 hour chart and 3 MTF MA from 1 hour chart. Thus, this contributes to save the number of indicators that you can set.
These are the value added on this indicator.
Specification
-This indicator shows weekly MTF MA, daily MTF MA, 4 hour MTF MA and 1 hour MTF MA.
To be clear, daily MTF MA means that moving average created based on daily chart , which can be shown on daily chart and lower timeframes.
-Each MTF MA will be shown as follows based on timeframes that you select.
1. Weekly MTF MA: Shown on weekly, daily, 4hour, 1 hour, 30M, 15M and 5M chart(Monthly chart does not show MTF MA)
2. Daily MTF MA: Shown on daily, 4hour, 1 hour, 30M, 15M and 5M chart(Weekly and Monthly chart does not show MTF MA)
3. 4hour MTF MA: Shown on 4hour, 1 hour, 30M, 15M and 5M chart(Daily, Weekly and Monthly chart does not show MTF MA)
4. 1hour MTF MA: Shown on 1 hour, 30M, 15M and 5M chart(4hour, Daily, Weekly and Monthly chart does not show MTF MA)
-Each MTF MA can be enabled and disabled by ticking checkbox.
Sample chart with the indicator
●Sample parameters setting
2 MA from weekly timeframe and 3 MA from daily timeframe set.
Here is how MAs are displayed.
It does not show anything.
Only 2 MA from weekly timeframe are shown. MA from daily timeframe are not appeared. This is the difference between this indicator and other conventional MTF MA indicators.
You can see 5 MAs, which are 2 MA from weekly timeframe and 3 MA from daily timeframe .
<4hour chart>
<15M chart>
Journey to use indicator
This indicator is paid indicator and invited-only indicator.
Please contact me via private chat or follow links in my signature so that we can initiate the process to access the indicator
--------------------------------------------------------------------------------------------------
週足、日足、4時間足、1時間足という異なる複数のタイムフレームから最大で12本(各タイムフレームから3本ずつ)のマルチタイムフレーム移動平均線を設定できるインジケーターです。
インジケーターの目的
上位足の移動平均線を下位足に表示することで、上位足での目線を持ったまま下位足の分析を行ったり、上位足によるレジサポの判断に使うことを想定しています。
他のマルチタイムフレーム移動平均線との違い
他のマルチタイムフレーム移動平均線インジケーターでは、よく以下の問題に直面します。
・上位足の移動平均線を表示しようとすると、さらに上位足でもその移動平均線が表示され、チャートが見にくくなる。
例: 4時間足の移動平均線を1時間足で表示可能なように設定すると、日足や週足でも4時間足の移動平均線が表示され、チャートがノイズだらけに・・・
・一つのインジケーターでは原則一つの移動平均線のみ表示。異なる時間軸のマルチタイムフレーム移動平均線を表示しようとするとその数だけインジケーターを追加する必要あり。
これらの問題に対応するため、このインジケーターでは、
・マルチタイムフレーム移動平均線を表示する時間軸を制御することで上位足側に不必要な情報を表示させない。これによりチャートをスッキリと見やすくすることができる。
・週足、日足、4時間足、1時間足という4つの異なる時間軸から3つずつ、最大で12本のマルチタイムフレーム移動平均線を設定可能。これによりインジケーター数を節約。
という機能を加えることでこれらの問題を解決しています。
これがこのインジケーターが提供する付加価値だと考えています。
仕様
機能概要
・このインジケーターでは週足、日足、4時間足、1時間足の4つの時間軸のマルチタイムフレーム移動平均線を表示します。
・設定できる移動平均線は週足から3本、日足から3本、4時間足から3本、1時間足から3本の最大12本まで設定可能です。
・それぞれの移動平均線はSMA(単純移動平均線)とEMA(加重移動平均線)を選択することができます。期間の設定も移動平均線ごとに設定可能です。
・各移動平均線は表示しているチャートの時間軸に応じて以下の様に表示されます。
例えば週足の移動平均線を設定すると、その移動平均線は週足、日足、4時間足、1時間足、30分、15分、5分足に表示されます。
・毎回チャートを開くごとにそれぞれの移動平均線の表示・非表示を切り替えることは可能ですが、この移動平均線はこの時間足では常に非表示といった制御は不可能です。
サンプルチャート
週足の移動平均線を2本、日足の移動平均線を3本設定した場合のチャートの例です。
<月足>
月足では週足の移動平均線も日足の移動平均線も表示されません。
<週足>
週足では2本の移動平均線のみが表示されていることがわかります。
日足の移動平均線が上位足である週足に表示されないのが、他のマルチタイムフレーム移動平均線との違いです。
<日足>
日足では週足と日足両方の移動平均線が表示されます。
<4時間足>
<15分足>
インジケーターの使用について
当インジケーターは招待制インジケーター(有料)となっています。
使用を希望される方はプライベートチャットや下記リンクのDMでご連絡ください。
このページのコメント欄はインジケーターそのものに対するコメントやアップデートの記載のためのものとなっております。Tradingviewのハウスルールを守るためにもコメント欄からの連絡はご遠慮ください。

KK_MA_MTFThis is multitimeframe Hull moving average
you can change offset to 0 if you want realtime data

MTF SMA on specific timeframe(5M-4H)Japanese below. 日本語の説明は下記
This is multi time frame simple moving average that is shown only on the specific timeframe; 5M, 15M, 30M, 1H, 4H.
Problem of conventional MTF moving average is that MTF MA is sometimes annoying especially when you look at upper timeframe such as daily chart and/or weekly chart.
e.g. You set 20 MA of 4 hour chart into 1 hour chart, however, when you look at daily chart, daily chart also shows 20MA of 4 hour chart which is unnecessary.
This is why I have developed this MTF SMA indicator shown only on the timeframe from 5M to 4 hour.
With this indicator, even if you set MA of upper timeframe(such as 4 hour) into Lower timeframe, that MA will not be shown on above daily chart.
You can customize adding or removing below code;
timeframe.period == “X”? security(syminfo.tickerid, res, sma(src, ma_len))
X is the timeframe that you would add/remove from the indicator.
——————————————————————————————
特定の時間軸にのみ表示されるマルチタイムフレーム移動平均線のインジケーターです。
従来のマルチタイムフレーム移動平均線の問題点は、上位足に切り替えた時にもマルチタイムフレーム移動平均線の設定が表示され、チャートが見にくくなる点でした。
例: 4時間足の20MAをマルチタイムフレーム移動平均線としてセットしたとします。この場合、1時間足などの下位足で4時間足の20MAが表示されることになりますが、同時に日足や週足といった上位足チャートを見る時にも、この4時間足の20MAが表示されてしまいます。
このインジケーターでは、従来のマルチタイムフレーム移動平均線と同様に、設定元となる上位足の時間軸(4時間、日足など)を選択し、期間とソースを設定することができる一方で、表示されるのは5分足、15分足、30分足,1時間足、4時間足のみとなります。
スクリプトのMAの取得部分に以下コードを追加することで、必要な時間軸を追加・削除することが可能です。
timeframe.period == “X”? security(syminfo.tickerid, res, sma(src, ma_len))
Xは表示したい時間軸です。4時間足チャートからこのインジケーターを削除したい場合は
timeframe.period == “240”? security(syminfo.tickerid, res, sma(src, ma_len))
を削除してください。

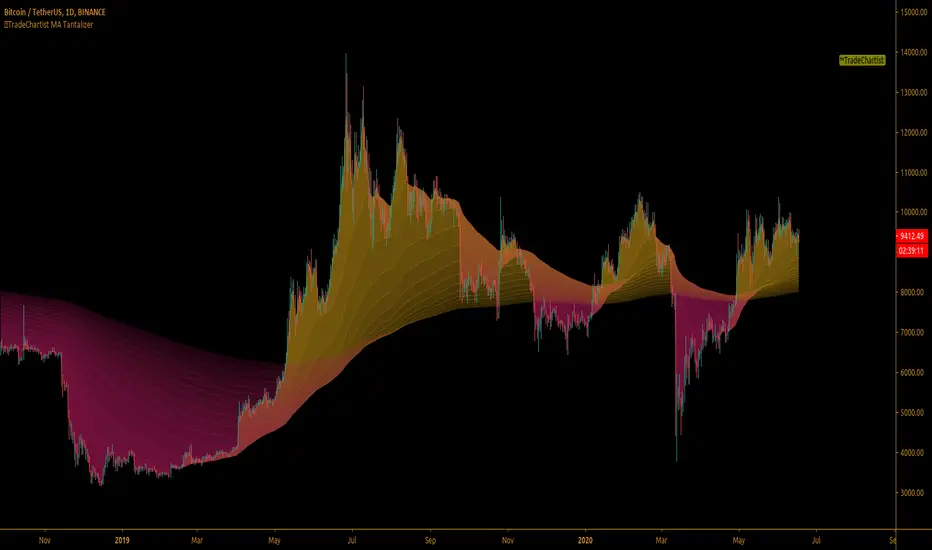
TradeChartist MA Tantalizer ™TradeChartist MA Tantalizer is a free to use, elegantly designed script for MA based traders and it offers a range of useful Moving Averages based plots including MA fishnet/Tantalizer ribbon and custom multi time frame MAs with crosses based on user input. The script's visually appealing design and its functionality offers a pleasing experience for the users, thereby complementing their analysis and helps understand asset's price action better.
What does ™TradeChartist MA Tantalizer do?
1. MA Tantalizer plots Moving Averages Tantalizer (Fishnet or Tantalized) in user preferred color scheme based on selection from a dropdown of 10 MAs ( SMA , EMA , Zero-Lag EMA , SMMA , WMA , DEMA , TEMA , VIDYA ( Variable Index DYnamic Average ), T3 MA (developed by Tim Tillson featured in his article "Better Moving Averages" in 1998), Modified T3 MA ). If length input is 10, Tantalizer plots 15 MA plots ranging from 10 MA to 150 MA. The Tantalized MAs help the traders to visually spot price trends and along with MTF (Multi Time Frame) MA plots with detection of crosses within the script, help traders make an informed trade decision. 15 MA plots can be individually plotted or hidden from the indicator settings.
2. Plots two MAs based on user input length and timeframe which helps detect MA crosses as shown below.
3. Generates Signal for MA crosses that can be plugged as Signal Connector and used with Plug and Trade scripts as below.
The sheer number of interesting things that can be done with this script from plotting visually engaging MA Tantalizer and detecting MA crosses not just on chart Timeframe, but also crosses between MAs of different timeframes, makes this script quite versatile and a real Tantalizer.