Percent Change MtFThis plots the selected resolution's percent change from open to close. Easy way to check the previous period's range with less noise. Note the latest period is calculating on a bar that hasn't closed so it won't update unless you refresh/change timeframes to prevent incorrect reporting.
Mtf

[fikira] Volume + MTF MAVolume normally has 1 Moving Average (standard orange coloured)
This script gives 1 extra Moving Average (default blue coloured)
BOTH MA can be shown with Multi Time Frames,
based on the most excellent work of "PineCoders"
(MTF Selection Framework functions)!
This can provide more insights, also the crossovers can be interesting!
So, default there are 2 MA's of the present Time Frame + extra 2 TF's of these MA's
(default 2 and 4 times of the present TF)
All can be enabled/disabled,
Only 1 MA:
With labels and values:
Here 2 MA but + only 1 extra TF:

[fikira] Bollinger Bands + Higher Time FramesHere is my take on BB and MTF, based on the most excellent work of
"PineCoders" (MTF Selection Framework functions)!
The big advantage is that on 1 image you can easily see where
price is compared to 5 or less BB Bands (each of different Time Frames).
This gives a lot of Support and Resistance area's!
Includes:
- 1 Bollinger Bands (can be enabled/disabled - "Bollinger Bands"
- 4 Bollinger Bands (each can be enabled/disabled - "HTF Selection 1-4")
Each BB has its colour (can be changed)
- Labels (Timeframe and price) can be enabled/disabled
- Labels position and size can be changed
...

$0 Monthly Weekly & Daily OHLC Viewer
Visualizer of current or previous month(s), week(s) & days ranges
Purpose: View last Monthly, Weekly, Daily, and/or a custom time interval OHLC, i.e. previously closed/confirmed or the ongoing higher time interval ranges
Main configurations available:
- 2 main reporting modes: View the current/ongoing M/W/D candles' OHLC (live, repaints) or report OHLC of last closed ones, i.e. previous Montly, Weekly and/or Daily
- View only latest Monthly, Weekly and/or Daily OHLC (lines) or all past ones (~channel)
- Set your own time interval for its price range(s) to be reported, e.g. last quarter '3M', 12H '720', or hide it
- View one specific day of the week OHLC reported all over the week
Graphic/visual configuration:
- Show the High & Low levels or not
- Show the Open & close levels or not
- Display a background color between top & down or lines only
- Change the background color depending if is/was rising or falling price
- Highlight the top & down breaches of higher timeframe resolution candles: Daily breaching last Weekly range, and/or the Weekly the Monthly one
- Colors & styling can be edited from the indicator's styling configuration panel
Depending on its expected usage, those configurations enable to:
- Consider previously closed candles OLHC as reference top & down ranges (support & resistance, breaches)
- Review chart's current candles evolution within their higher time interval / candle (M/W/D)
- Consider specific week days' range as a reference for the week trend
- Have a general overview of the market evolution trends
Default config is to view current candles evolving within their higher time interval / candle, while reporting last previously closed M+W is a preferred usage. Play with the config settings to find your setup.
View ongoing M+W+D OHLC with dynamic background color:
View previously closed M+W+D OHLC:
View closed H&L for M+W+D, latest only:
View Mondays' OHLC:
Feedback & support welcome.

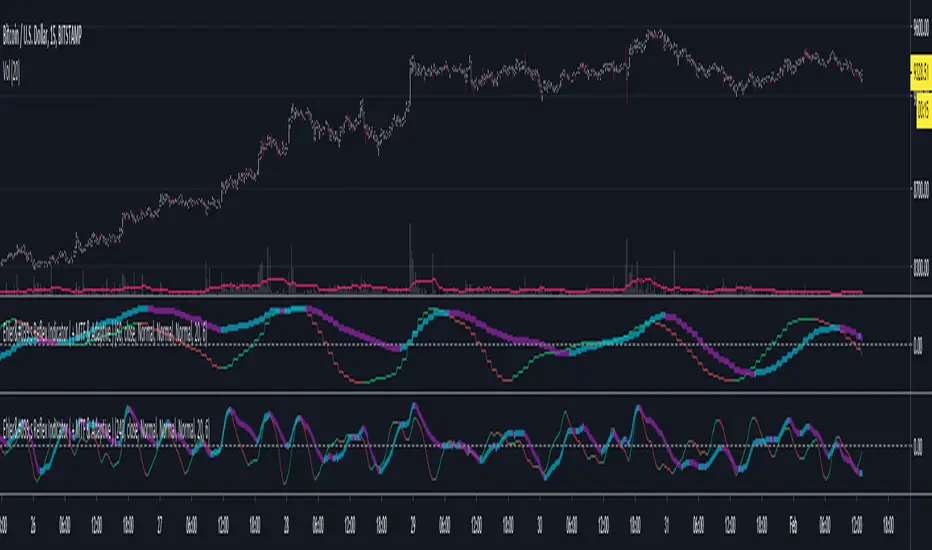
Ehler's Reflex Indicator ( + MTF & Adaptive )Implementation of Ehler's Reflex Indicator from TASC Feb 2020.
Optional MTF and fixed/adaptive length based on one of Ehler's cycle measurements.
Optional settings for his recommended 2 bar averaging, can apply the averaging to either/and source ie (close + close ) / 2, the output of the smoothing filter portion of the calculation or the final indicator output.
Green/Red : Reflex/Cycle
Aqua/Purple : Trend
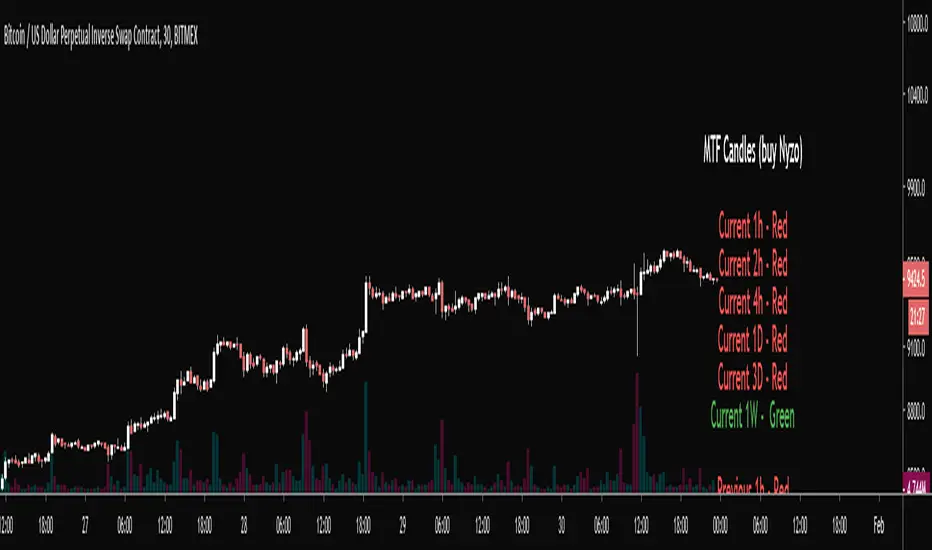
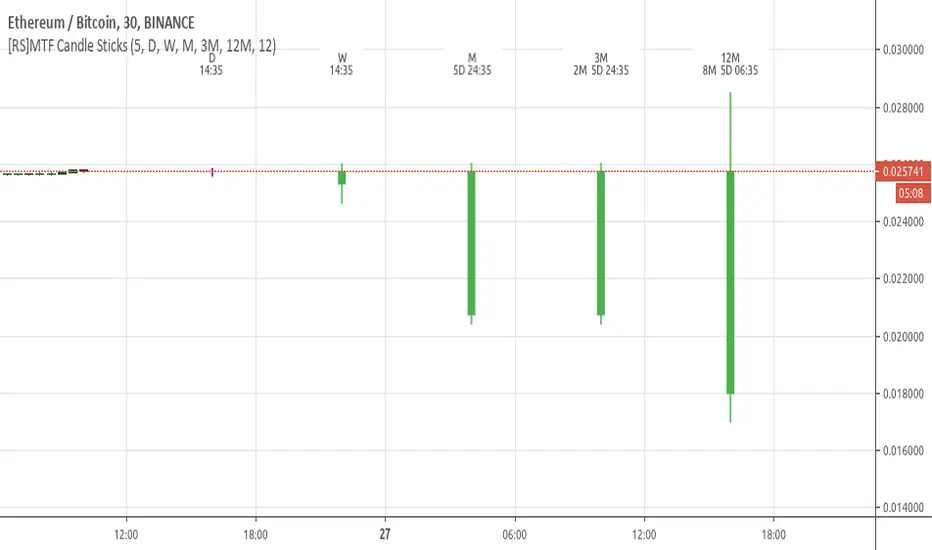
MTF Candles (Nyzo Style)This script is straight forward.
Just practicing using the security function cause I'm terrified of it.
Thanks, Daveatt for the infopanel function with the color switcher
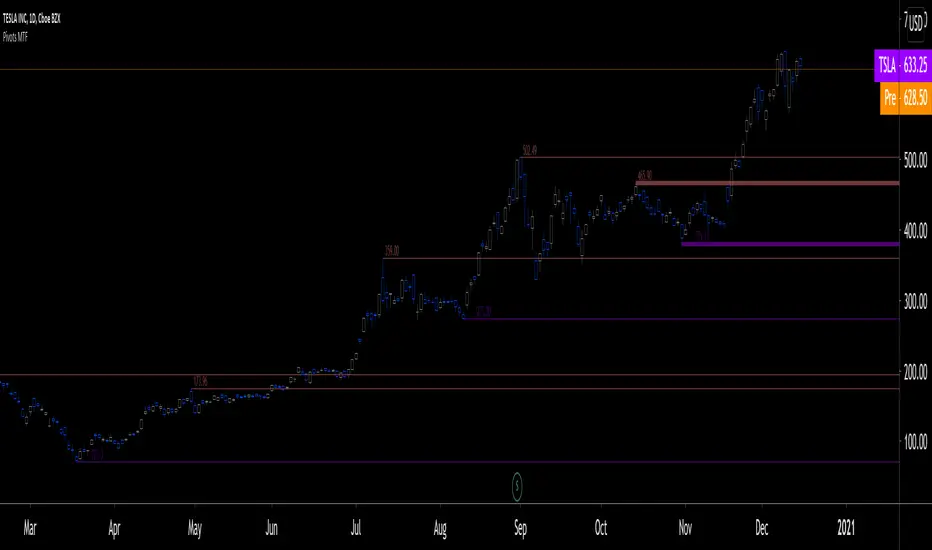
Pivots MTF [LucF]Pivots detected at higher timeframes are more significant because more market activity—or work—is required to produce them. This indicator displays pivots calculated on the higher timeframe of your choice.
Features
► Timeframe selection
— The higher timeframe (HTF) can be selected in 3 different ways:
• By steps (15 min., 60 min., 4H, 1D, 3D, 1W, 1M, 1Y). This setting is the default.
• As a multiple of the current chart's resolution, which can be fractional, so 3.5 will work.
• Fixed.
— The HTF used can be displayed near the last bar (default).
— Note that using the HTF is not mandatory. If it is disabled, the indicator will calculate on the chart's resolution.
— Non-repainting or repainting mode can be selected. This has no impact on the display of historical bars, but when no repainting is selected, pivot detection in the realtime bar will be delayed by one chart bar (not one bar at the HTF).
► Pivots
— Three color schemes are provided: green/red, aqua/pink and coral/violet (the default).
— Both the thickness and brightness of lines can be controlled separately for the hi and lo pivots.
— The visibility of the last hi/lo pivots can be enhanced.
— Prices can be displayed on pivot lines and the text's size and color can be adjusted.
— The number of bars required for the left/right pivot legs can be controlled (the default is 4).
— The source can be selected individually for hi and lo pivots (the default is hlc3 and low .
— The mean of the hi/lo pivot values of the last few thousand chart bars can be displayed. Pivots having lasted longer during the mean's period will weigh more in the calculation. The mean can be displayed in running mode and/or only showing its last level as a long horizontal line. I don't find it very useful; maybe others will.
► Markers and Alerts
— Markers can be configured on breaches of either the last hi/lo pivot levels, or the hi/lo mean. Crossovers and crossunders are controlled separately.
— Alerts can be configured using any of the marker combinations. As is usual for my indicators, only one alert is used. It will trigger on the markers that are active when you create your alert. Once your markers are set up the way you want, create your alert from the chart/timeframe you want the alert to run on, and be sure to use the “Once Per Bar Close” triggering condition. Use an alert message that will remind you of the combination of markers used when creating the alert. If you use multiple markers to trigger one alert, then having the indicator show those markers will be important to help you figure out which marker triggered the alert when it fired.
A quick look at the pattern of these markers will hopefully convince you that using them as entry/exit signals would be perilous, as they are prone to whipsaw. I have included them because some traders may use the markers as reminders.
Using Pivots
These pivots can be used in a few different ways:
— When using the high / low sources they will show extreme levels, breaches of which should be more significant.
— Another way to use them is with hlc3 (the average of the high , low and close ) for hi pivots and low for the lo pivots. This accounts for my personal mythology to the effect that drops typically reach previous lows more easily than rallies make newer highs.
— Using low for hi pivots and high for lo pivots (so backward) can be a useful way to set stops or to detect weakness in movements.
You will usually be better served by pivots if you consider them as denoting regions rather than precise levels. The flexibility in the display options of this indicator will help you adapt it to the way you use your pivots. To indicate areas rather than levels, for example, try using a brightness of 1 with a line thickness of 30. The cloud effect generated this way will show areas better than fine lines.
Realize that these pivot lines are positioned in the past, and so they are drawn after the fact because a given number of bars need to elapse before calculations determine a pivot has occurred. You will thus never see a pivot top, for example, identified on the realtime bar. To detect a pivot, it takes a number of bars corresponding to the dilation of the higher timeframe in the current one, multiplied by the number of bars you use for your pivots' right leg. Also note that the Pine native function used to detect pivots in this indicator considers a summit to be a top when the number of bars in each leg are lower or equal to that top. Bars in legs do not need to be progressively lower on each side of the pivot for a pivot to be detected.
If you program in Pine
— See the Pinecoders MTF Selection Framework for an explanation of the functions used in this script to provide the selection mechanism for the higher timeframe.
— This code uses the Pine Script Coding Conventions .
Thanks
— To the Pine coders asking questions in the Pine Script chat on TV ; your questions got me to write this indicator.
Extended Ichimoku by Grzechu789This script extends capabilities of Ichimoku Indicator adding nondisplaced SSB line (serves as Kijun Sen line) and ability to see Kijun Sen line from higher (or lower) timeframes.
Other than that it's same as original Ichimoku Kinko Hyo Indicator. Enjoy!

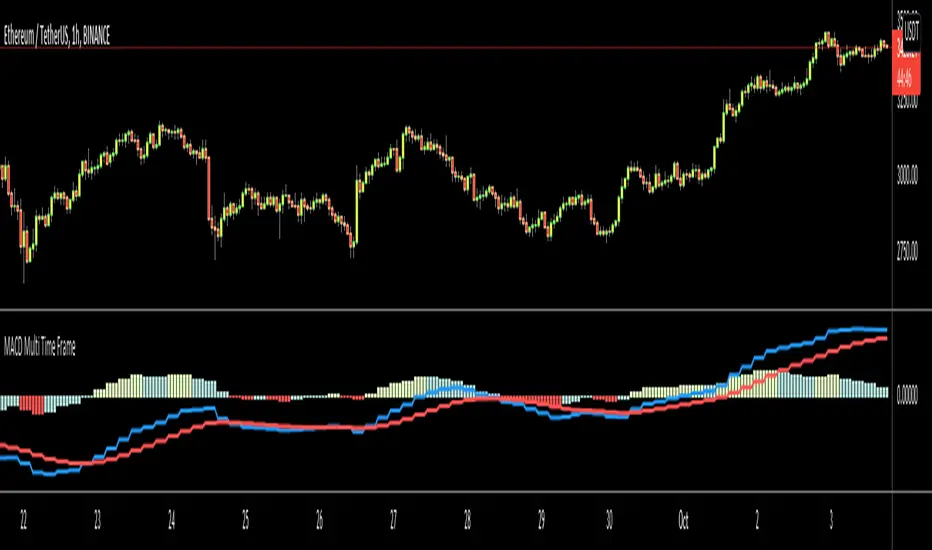
MACD Multi Time FrameThis is non-repainting multi time frame MACD script. You can choose HTF manually or HTF is calculated automatically if HTF Mode is "Auto" that is default.
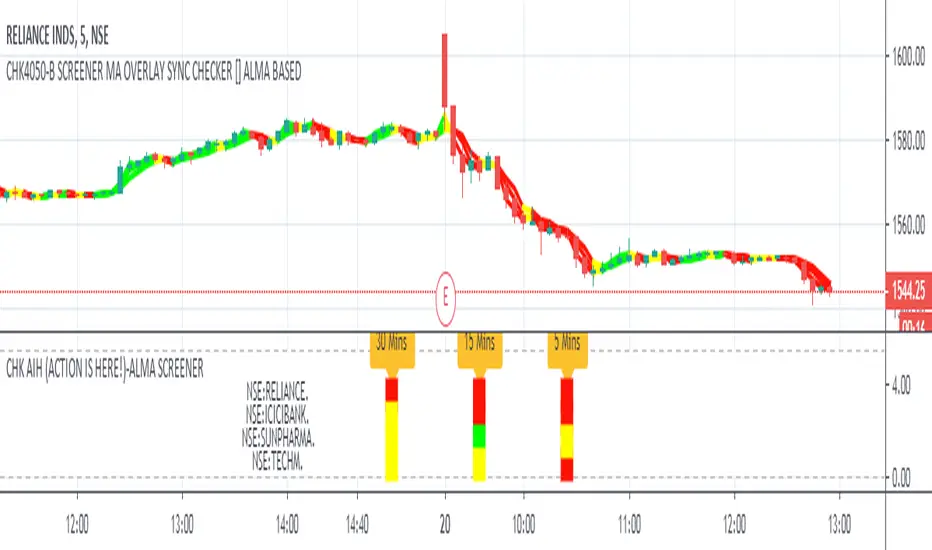
CHK AIH (ACTION IS HERE!)-ALMA SCREENERWe do not like to stare at the screen whole day, instead we like to jump where the
action is.... The Screener was written with this in mind
CHK AIH (ACTION IS HERE!)-ALMA BASED SCREENER
FEATURES
User can enter 3 Resolutions of his/her choice
User can select 3 Mov Avg Length of his her choice, which would be identical for all the three timeframes
User can enter stock basis his/her region's stock exchange
User can shift the screener left or right if not visible in a Multiscreen mode
Uses ALMA (Arnaud Legoux Mov Avg) as it smooth and reactive
Code is also provided below of MTF ALMA Moving Average OVERLAY on which this screener is based
LOGIC
For a particular timeframe If all the Moving Average are calibrated in one direction, it will show the requisite color.
For Example in an ideal scenario for a bull trend ALMA(5)> ALMA(13) > ALMA(21), once such a situation is identified, the screener will show green.
Yellow means lack of Calibration.
When 3 timeframes are calibrated, it becomes a high Probability Trade
BUGS
It is not allowing to enter the D/W/M timeframes, timeframe in numbers ...5/15/60 is working fine. If somebody can fix it
it would be great
LIMITATIONS
Because of TV's limitations only 4 scrips can be entered, however one add the indicator again with new scrips
//////////// CREDITS ////////////////////////////////////////////////////////////////////////////////////
//// hxxps://www.tradingview.com/script/rwdgyEZe/
/// Thank You Inno14 for graciously sharing your work. Your work has helped immensely !!!
////////////////////////////////////////////////////////////////////////////////////////////////////////
ICICIBANK
TECHMAHINDRA
YESBANK
MTF Smoothed Moving Averages x4A set of smoothed moving averages that stay at a fixed timeframe, regardless of the timeframe of the chart but don't have nasty jaggedy lines. Instead, they are smooooooooooooth...

ANN BTC MTF Golden Cross Period MACDHi, this is the MACD version of the ANN BTC Multi Timeframe Script.
The MACD Periods were approximated to the Golden Cross values.
MACD Lengths :
Signal Length = 25
Fast Length = 50
Slow Length = 200
Regards.

ANN BTC MTF CM Sling Shot SystemHi all, this script was created as a result of ANN training in all time frames of bitcoin data.
Trained data is built on Chris Moody's Sling Shot system.
CM Sling Shot System :
This system automatically generates the ANN output for all time periods.
Therefore, it has multi-time-frame feature.
Artificial Neural Networks training details:
Average Errors
1 minute = 0.005570
3 minutes = 0.006674
5 minutes = 0.007067
15 minutes = 0.010000
30 minutes = 0.009398
45 minutes = 0.010000
1 Hour = 0.006848
2 Hours = 0.006901
3 Hours = 0.009608
4 Hours = 0.009774
1 Day = 0.010000
1 Week = 0.010000
The results look good (All Average Error <= 0.01 ), the Sling Shot Method is also good, but you can also refer to historically slower period averages to filter these arrows a bit more. I leave the decision to you.
Best regards.

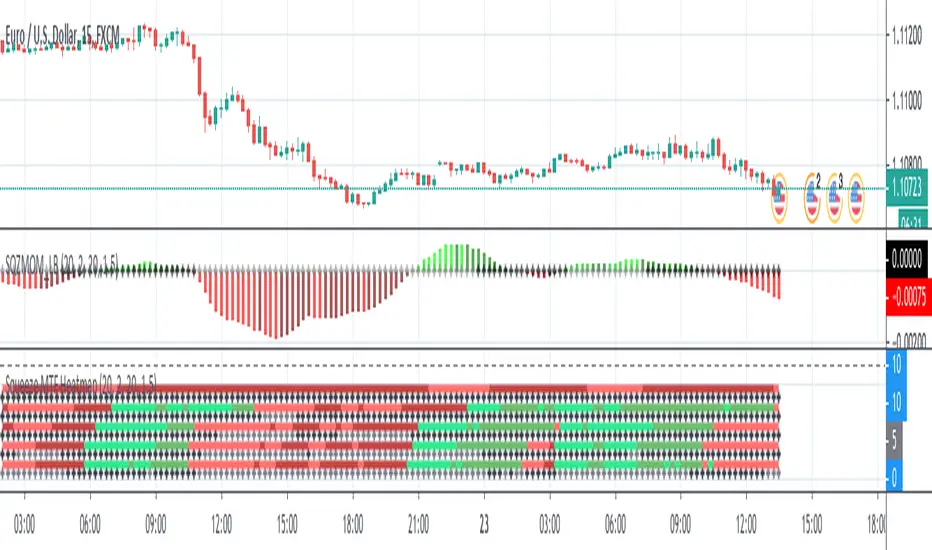
Squeeze MTF HeatmapHere is a multi-timeframe heat map using one of the most apreciated indicators in Tradingview: Squeeze Momentum Indicator by LazyBear.
Study shall be added to 15min chart.
It indicates squeeze and momentum at: 15 min, 30 min, 60 min, 240 min and 1 Day.
Thanks to © azimuthdynamics for inspiration and portion of code
Thanks to Lazy Bear for coding Squeeze Momentum Indicator
BEST Multicolor Supertrend InfoPanelHello traders
Today is a Pinescript hack to display multiple colors in one label.
I used that panel to show the Supertrend Long Term values (weekly, monthly, quarterly, yearly)
What is a Supertrend?
Definition : SuperTrend is an indicator that works on all timeframes and all instruments (stocks, futures, forex, ...). It is a great tool to follow market trends and optimizes your profits.
SuperTrend evolves below or above the prices depending on the trend. You can use it as an exit position indicator when its direction changes. You can also use it to place your stops.
So.... the hack is?
The hack is about creating a new label for each line - versus creating just one label containing the whole text
Best regards,
Dave

$0 Exponential & Simple MAs with HigherTFMultiple Moving Averages (Simple/SMA & Exponential/EMA) in one indicator
Support for a fixed time frame for the MAs
MAs default period length are key ones, provided by experienced traders in crypto, greetings to xpressive
Live update or Non-repainting modes support: with the non-repainting mode the previous candle's close is considered instead of latest/current bar's changing close
Features:
7 EMAs with editable length
4 SMAs with editable length
Choice of the price/data source from a predefined list
Activate or not the usage of an higher TF
Target Higher time frame resolution. Not using the predefined lists for more possibilities, e.g M1="M", H12="720", D3="3D", 5M="5"
Configurable lines' width in one setting. Hide or change the MAs color from the indicator's style settings

Indicator Panel MTF (MACD, RSI, Momentum, Stoch, CCI)This script shows the values of MACD, RSI, Momentum, Stoch, CCI for current and higher time frames in a panel. if higher time frame is equal or smaller than current time frame and it doesn't show the values for HTF.
And also it shows if their values are increasing, decreasing or equal to last value with "▲", "▼", "="
The signal length for all indicators is 9 and used EMA.
histogram value is indicator value - it's signal value. with this value you can see that indicator and its signal getting closer or not. you may think it's as momentum.
Some functions and idea is used from following scripts:
Thanks to Lucf for the following script:
Thanks to Ricardo Santos for the following script:


MTF IQ IFM Moving AverageMTF ready adaptive MA using Ehler's IQ IFM ( In Phase - Quadrature Instantaneous Frequency Measurement ).
Ehler's formula is a method of quantitatively measuring the length of a market cycle. In this case it is used to calculate the "optimal" adaptive EMA.
Theoretically the length generated by Ehler's formula could be used in many indicators and it's been placed within it's own function so you should be able to simply copy/paste it. HOWEVER pine will not accept series variables for the length input used in built-in functions. You will have to manually code (or find) a version of your indicator that doesn't use the pine built in.
Options :
type : optionally add volume weighting
range : historical range used in IQ IFM
cycle length mult : method to create faster/slower MAs. eg 0.5 is half the length of a cycle and a faster EMA ie EMA10 vs EMA20
low sat fix : some cryptocurrencies with low satoshi values cause an issue with the calculation, if you get no/nonsensical lines, enable this. Shouldn't affect other instruments, but can be disabled just in case.
MTF options: run the calculation on an alternative timeframe
--------------------------------------
If you find it useful please consider a tip/donation :
BTC - 3BMEXEDyWJ58eXUEALYPadbn1wwWKmf6sA

MTF Bollinger Bands - ModifiedModified version of tansancrypto's MTF Bollinger to Pinescript 4 and removed limiters on BB1/BB2 max Sigma values.
Original Script:

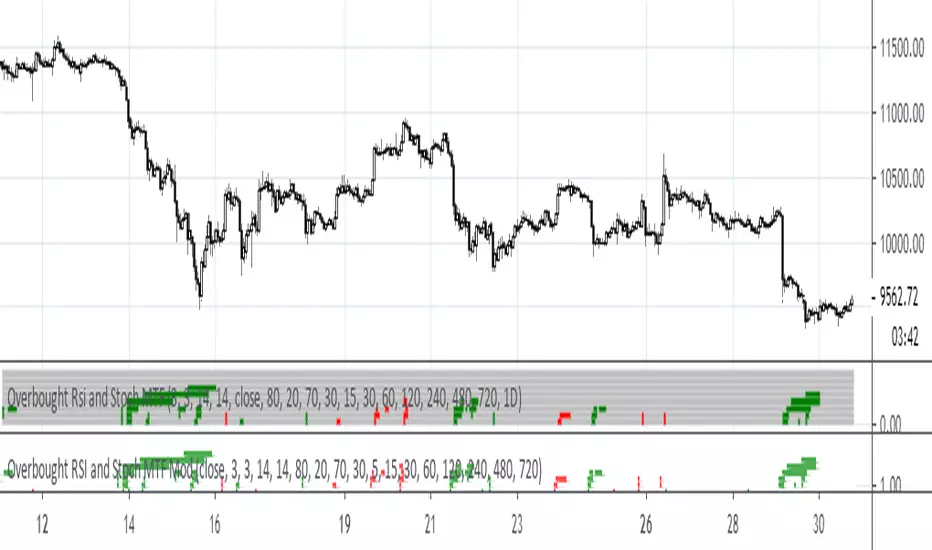
Overbought RSI and Stoch MODThis is a modification of the script by Elgrand (). Using plotshape statement appears to produce a more precise outcome.