Multi SMA + Golden/Death + Heatmap + BB**Multi SMA (50/100/200) + Golden/Death + Candle Heatmap + BB**
A practical trend toolkit that blends classic 50/100/200 SMAs with clear crossover labels, special 🚀 Golden / 💀 Death Cross markers, and a readable candle heatmap based on a dynamic regression midline and volatility bands. Optional Bollinger Bands are included for context.
* See trend direction at a glance with SMAs.
* Get minimal, de-cluttered labels on important crosses (50↔100, 50↔200, 100↔200).
* Highlight big regime shifts with special Golden/Death tags.
* Read momentum and volatility with the candle heatmap.
* Add Bollinger Bands if you want classic mean-reversion context.
Designed to be lightweight, non-repainting on confirmed bars, and flexible across timeframes.
# What This Indicator Does (plain English)
* **Tracks trend** using **SMA 50/100/200** and lets you optionally compute each SMA on a higher or different timeframe (HTF-safe, no lookahead).
* **Prints labels** when SMAs cross each other (up or down). You can force signals only after bar close to avoid repaint.
* **Marks Golden/Death Crosses** (50 over/under 200) with special labels so major regime changes stand out.
* **Colors candles** with a **heatmap** built from a regression midline and volatility bands—greenish above, reddish below, with a smooth gradient.
* **Optionally shows Bollinger Bands** (basis SMA + stdev bands) and fills the area between them.
* **Includes alert conditions** for Golden and Death Cross so you can automate notifications.
---
# Settings — Simple Explanations
## Source
* **Source**: Price source used to calculate SMAs and Bollinger basis. Default: `close`.
## SMA 50
* **Show 50**: Turn the SMA(50) line on/off.
* **Length 50**: How many bars to average. Lower = faster but noisier.
* **Color 50** / **Width 50**: Visual style.
* **Timeframe 50**: Optional alternate timeframe for SMA(50). Leave empty to use the chart timeframe.
## SMA 100
* **Show 100**: Turn the SMA(100) line on/off.
* **Length 100**: Bars used for the mid-term trend.
* **Color 100** / **Width 100**: Visual style.
* **Timeframe 100**: Optional alternate timeframe for SMA(100).
## SMA 200
* **Show 200**: Turn the SMA(200) line on/off.
* **Length 200**: Bars used for the long-term trend.
* **Color 200** / **Width 200**: Visual style.
* **Timeframe 200**: Optional alternate timeframe for SMA(200).
## Signals (crossover labels)
* **Show crossover signals**: Prints triangle labels on SMA crosses (50↔100, 50↔200, 100↔200).
* **Wait for bar close (confirmed)**: If ON, signals only appear after the candle closes (reduces repaint).
* **Min bars between same-pair signals**: Minimum spacing to avoid duplicate labels from the same SMA pair too often.
* **Trend filter (buy: 50>100>200, sell: 50<100<200)**: Only show bullish labels when SMAs are stacked bullish (50 above 100 above 200), and only show bearish labels when stacked bearish.
### Label Offset
* **Offset mode**: Choose how to push labels away from price:
* **Percent**: Offset is a % of price.
* **ATR x**: Offset is ATR(14) × multiplier.
* **Percent of price (%)**: Used when mode = Percent.
* **ATR multiplier (for ‘ATR x’)**: Used when mode = ATR x.
### Label Colors
* **Bull color** / **Bear color**: Background of triangle labels.
* **Bull label text color** / **Bear label text color**: Text color inside the triangles.
## Golden / Death Cross
* **Show 🚀 Golden Cross (50↑200)**: Show a special “Golden” label when SMA50 crosses above SMA200.
* **Golden label color** / **Golden text color**: Styling for Golden label.
* **Show 💀 Death Cross (50↓200)**: Show a special “Death” label when SMA50 crosses below SMA200.
* **Death label color** / **Death text color**: Styling for Death label.
## Candle Heatmap
* **Enable heatmap candle colors**: Turns the heatmap on/off.
* **Length**: Lookback for the regression midline and volatility measure.
* **Deviation Multiplier**: Band width around the midline (bigger = wider).
* **Volatility basis**:
* **RMA Range** (smoothed high-low range)
* **Stdev** (standard deviation of close)
* **Upper/Middle/Lower color**: Gradient colors for the heatmap.
* **Heatmap transparency (0..100)**: 0 = solid, 100 = invisible.
* **Force override base candles**: Repaint base candles so heatmap stays visible even if your chart has custom coloring.
## Bollinger Bands (optional)
* **Show Bollinger Bands**: Toggle the overlay on/off.
* **Length**: Basis SMA length.
* **StdDev Multiplier**: Distance of bands from the basis in standard deviations.
* **Basis color** / **Band color**: Line colors for basis and bands.
* **Bands fill transparency**: Opacity of the fill between upper/lower bands.
---
# Features & How It Works
## 1) HTF-Safe SMAs
Each SMA can be calculated on the chart timeframe or a higher/different timeframe you choose. The script pulls HTF values **without lookahead** (non-repainting on confirmed bars).
## 2) Crossover Labels (Three Pairs)
* **50↔100**, **50↔200**, **100↔200**:
* **Triangle Up** label when the first SMA crosses **above** the second.
* **Triangle Down** label when it crosses **below**.
* Optional **Trend Filter** ensures only signals aligned with the overall stack (50>100>200 for bullish, 50<100<200 for bearish).
* **Debounce** spacing avoids repeated labels for the same pair too close together.
## 3) Golden / Death Cross Highlights
* **🚀 Golden Cross**: SMA50 crosses **above** SMA200 (often a longer-term bullish regime shift).
* **💀 Death Cross**: SMA50 crosses **below** SMA200 (often a longer-term bearish regime shift).
* Separate styling so they stand out from regular cross labels.
## 4) Candle Heatmap
* Builds a **regression midline** with **volatility bands**; colors candles by their position inside that channel.
* Smooth gradient: lower side → reddish, mid → yellowish, upper side → greenish.
* Helps you see momentum and “where price sits” relative to a dynamic channel.
## 5) Bollinger Bands (Optional)
* Classic **basis SMA** ± **StdDev** bands.
* Light visual context for mean-reversion and volatility expansion.
## 6) Alerts
* **Golden Cross**: `🚀 GOLDEN CROSS: SMA 50 crossed ABOVE SMA 200`
* **Death Cross**: `💀 DEATH CROSS: SMA 50 crossed BELOW SMA 200`
Add these to your alerts to get notified automatically.
---
# Tips & Notes
* For fewer false positives, keep **“Wait for bar close”** ON, especially on lower timeframes.
* Use the **Trend Filter** to align signals with the broader stack and cut noise.
* For HTF context, set **Timeframe 50/100/200** to higher frames (e.g., H1/H4/D) while you trade on a lower frame.
* Heatmap “Length” and “Deviation Multiplier” control smoothness and channel width—tune for your asset’s volatility.
Movingaverageribbon

Moving Average CandlesInspired by Ricardo Santos's " Multiple Moving Average Candle System V0" ()
This script plots 6 moving averages using the plotcandle function rather than the normal plot function. Result is a stylish indicator that shows moving average crossovers in a more visual way. Moving average type options available are , or Simple, Exponential, Hull, Relative, Volume Weighted, and Arnaud Legoux Moving Averages, Linear Regression Curve, and Median. Lengths for each can be set in settings along with selection specific parameters. Good for plotting/visualizing potential entry/exit points based on your preferred moving averages crossing over, or just as some eye candy.

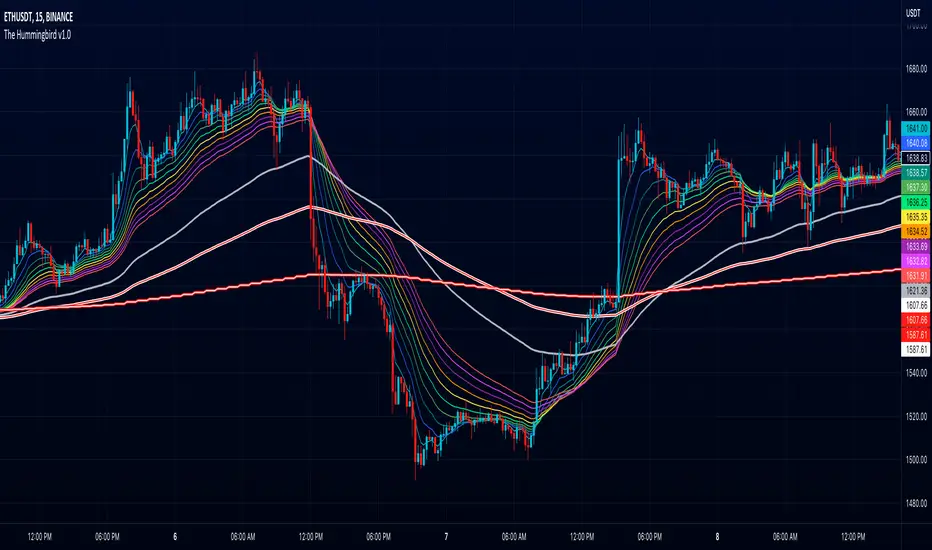
The Hummingbird - MA Ribbon by Joe (EMA, SMA, SMMA, WMA, VWMA)Tired of having to add multiple moving average indicators to your chart? Well, stop doing that. No, really. Listen. Adding duplicate indicators is totally not cool. And, it won't go over well at the next HOA meeting if you keep doing it.
Here's the sweet moving average ribbon you've been waiting for (with 1-10 moving average lines!). It will make your charts look much cooler 😎. And you'll gain the respect of all your neighbors if you add it to your charts.
In all seriousness, this is a slimmed-down version of my other super-awesome script with a stupid name, "Joe's Ultimate MA Ribbon (w/ Crossover Triggers)."
Basically, I removed the crossover signals from it and changed the name to a much superior name, "The Hummingbird."
Yeah. Right on. So, if you don't want or need the crossover signals, go right on humming with "The Hummingbird."
Enjoy, friends. 🍻
If you still want the original ribbon with crossover signals, get it here .
Options:
Show/Hide MA Lines: Only show the lines you wanna see. No more. No less.
MA Type (can be different for each line!): EMA , SMA , SMMA (RMA), WMA , VWMA
MA Source (for each line): open, close, high, low, hl2 , hlc3, ohlc4, hlcc4
MA Length (for each line): any number between 1 and 4999
Line Colors: Ooh, pretty.
Gate Signal by Market yogiThis indicator is made by Nischay Rana (Market Yogi)
How to use this Indicator
This is simple group of 8 moving averages, which can be configured in various ways according to your trading requirement.
1. moving average ribbon
2.moving average channel
3.moving average gate signal
4.This indicator has bonus indicator of bollinger bands inbuilt.
Logic:
As price has tendency to get closer to their moving averages. The logic behind this indicator is to use the contraction and expansion concepts of moving averages to find best entry exit points.
This nature of Price action is use to capture the big move after the convergence of all moving averages.
CAUTION : Do not blindly trade the gates as gate has tendency to break out on either side. So use this indicator in confluence with price action and other technical analysis to capture bigger moves.
Higher the gate width more gates are found. Similarly lesser the gate width less gate are found. i.e. Tight squeeze of all the moving averages.
"ENJOY HAPPY TRADING.."
Truly Yours Market Yogi

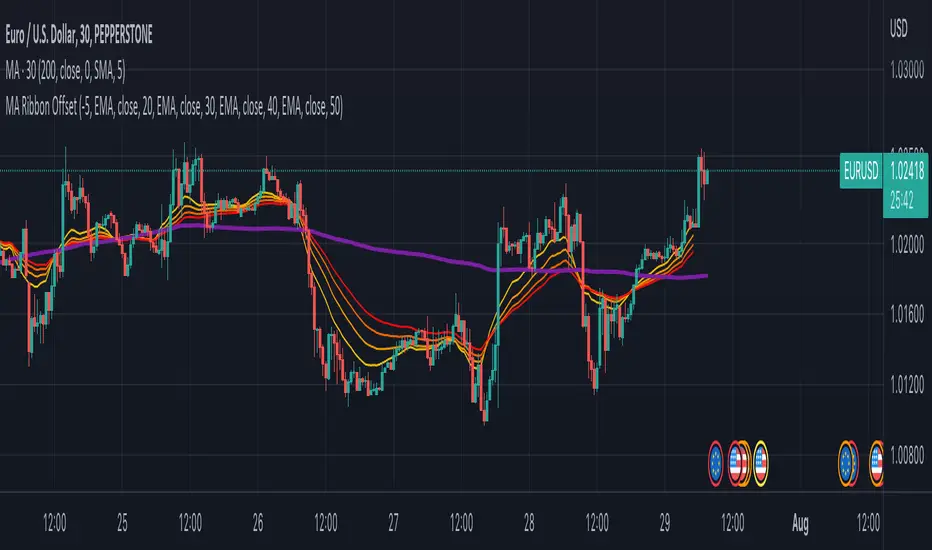
Moving Average Ribbon with OffsetHello,
this script is the same as the built-in Moving Average Ribbon. I just added the offset for all 4 the MAs.
Joe's Ultimate MA Ribbon (w/ Crossover Triggers)Tired of having to add multiple moving average indicators to your chart? Well, stop doing that.
Here's a sweet moving average ribbon (with 1-10 moving average lines!) that will make your charts look much cooler 😎.
Not only that, it also includes triggers for MA crossovers. So, yeah...you can pick which MA crossovers trigger for longs and shorts separately. Yup, you read that right.
Options:
Show/Hide MA Lines: Only show the lines you wanna see. No more. No less.
MA Type (can be different for each line!): EMA, SMA, SMMA (RMA), WMA, VWMA
MA Source (for each line): open, close, high, low, hl2, hlc3, ohlc4, hlcc4
MA Length (for each line): any number between 1 and 4999
Line Colors: Ooh, pretty.
Triggers: On or Off
Crossover Long Triggers: When _______ crosses over _______ on timeframe _______
Crossover Short Triggers: When _______ crosses over _______ on timeframe _______
Trigger Characters and Location

Timeframed Moving Average RibbonAdded timeframe inputs for each of the moving averages in the stock TradingView Moving Average Ribbon indicator.
Now one can use a combination of different moving averages such as the following without readjusting the indicator's settings when switching the chart's timeframes:
- 390 period 5 minute (5 day equivalent) SMA
- 150 period 1 day (30 week equivalent) EMA
- 200 period 1 week (50 month equivalent) SMA
- 50 period chart timeframe SMA
- 100 period chart timeframe SMA
- 200 period chart timeframe SMA

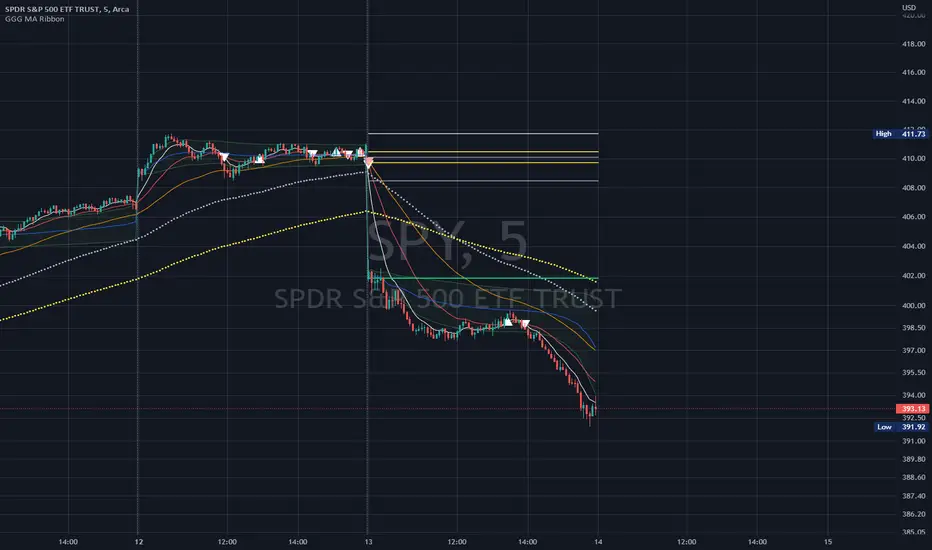
GoGoGadget MA RibbonMoving Average Ribbon with defaults for day-trading
8, 21, 50 EMAs
MA cross(over/under) markers
MA cross(over/under) alert conditions preconfigured
Reversal time periods highlight background or add labels for periods on standard days when reversals are likely (mainly useful for SPY or QQQ)