Bulltrapp.com - KEY LEVELSBulltrapp.com - KEY LEVELS
A comprehensive all-in-one key levels indicator designed for serious traders who want to see the most important price levels at a glance.
📊 Features:
Daily Levels
Previous Day High/Low (PDH/PDL)
Daily Open (DO)
Weekly Levels
Current & Previous Week High/Low
Weekly Open (WO)
Monday Range
Monday High/Low - essential for weekly range analysis
Monthly Levels
Current & Previous Month High/Low
Monthly Open (MO)
Quarterly & Yearly Levels
Quarterly Open (QO)
Yearly High/Low/Open with Previous Year levels
Session Levels
Asian, London & New York session High/Low
Customizable session times (UTC based)
Opening Range
NY Opening Range (first 15 min)
London Opening Range (first 15 min)
Automatic Support/Resistance Detection
Pivot-based S/R detection with customizable lookback
Shows levels with the most touches (strongest zones)
Automatic merging of nearby levels to reduce clutter
Configurable sensitivity and history length
⚙️ Customization:
Fully customizable colors for each level type
Adjustable line width and style (Solid/Dashed/Dotted)
Label size options
Toggle each level group on/off independently
Works correctly with Heikin Ashi charts (uses real OHLC data)
📱 Built by Bulltrapp.com
This indicator is brought to you by Bulltrapp.com - your ultimate crypto portfolio tracker!
🚀 Track your entire portfolio across multiple exchanges and wallets in one place
📈 Real-time P&L tracking with detailed analytics
💰 Tax reporting made easy
🔔 Smart alerts for price movements and portfolio changes
Visit bulltrapp.com to take your trading to the next level!
If you find this indicator useful, please give it a ⭐ and leave a comment!
Monthlylevels

Valid Monthly LevelsValid Monthly Levels (No Sweeps) + Smart Labels
This tool automatically plots the highs and lows of each completed monthly candle and tracks their validity in real time. A level is considered valid until it has been swept (price trades strictly beyond that high or low). Once swept, the line and label can either be removed or dimmed depending on your settings.
Key features:
Monthly highs and lows: Each month’s range is marked with horizontal levels that extend forward.
Valid vs. swept logic: Levels are only valid until breached; swept levels can be hidden or kept as dotted/grey lines.
Smart labels: Each level is labeled with the month and year (e.g., Sep ’25 H/L). On higher timeframes, labels sit at the candle; on lower timeframes, labels automatically shift to the right edge so they don’t disappear off-screen.
Customizable appearance: Choose colors for highs, lows, and swept levels; adjust line styles; and limit how many past months are shown.
Clutter control: Cap the maximum number of labels, so your chart stays readable even on small intraday timeframes.
This indicator is useful for traders who track monthly supply/demand extremes, liquidity sweeps, and higher-timeframe context when executing on lower timeframes.

High/Mid/Low of the Previous Month, Week and Day + MAIntroducing the Ultimate Price Action Indicator
Take your trading to the next level with this feature-packed indicators. Designed to provide key price insights, this tool offers:
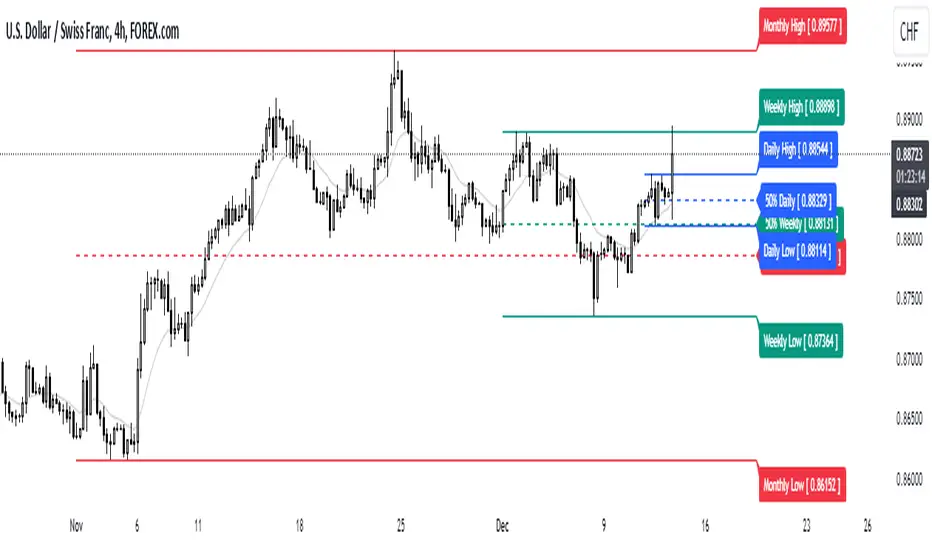
- Monthly, Weekly, and Daily Levels : Displays the High, Midpoint, and Low of the previous month, week, and day.
- Logarithmic Price Lines : Option to plot price levels logarithmically for enhanced accuracy.
- Customizable Labels : Display labels on price lines for better clarity. (This feature is optional.)
- Dual Moving Averages : Add two customizable Moving Averages (Simple, Exponential, or Weighted) directly on the price chart. (This feature is optional.)
This code combines features from the Moving Average Exponential and Daily Weekly Monthly Highs & Lows (sbtnc) indicators, with custom modifications to implement unique personal ideas.
Perfect for traders who want to combine precision with simplicity. Whether you're analyzing historical levels or integrating moving averages into your strategy, this indicator provides everything you need for informed decision-making.
To prevent change chart scale, right click on Price Scale and enable "Scale price chart only"
Simple Trader - LevelsThis indicator plots the below levels in the chart.
Note: This is not a buy/sell recommendation. Reach Simple Trader to understand how to trade these levels.
Current day open,
Prev. day close,
Prev. day high,
Prev. day low.
Prev. week high,
Prev. week low,
Prev. month high,
Prev. month low.
