Mid-Term Refuges (RMP)════════════
ENGLISH VERSION (SPANISH TEXT AT THE END)
════════════
MID-TERM REFUGES (RMP) V1.0
The Mid-Term Refuges (RMP) indicator plots psychological support and resistance levels based on a methodology used by institutional investors since auction floor days. RMP automatically calculates 31 key levels (refuges) from the asset's annual opening price.
METHODOLOGY
• RESISTANCES (R1-R15): Projected at +10% intervals from annual opening, identifying selling pressure zones
• SUPPORTS (S1-S15): Calculated at -10% intervals, marking buyer interest areas
• ANNUAL OPENING PRICE (PA): Central reference level
The 10% intervals represent significant psychological thresholds that capture market indecision, consolidation, or reversal moments. When critical mass of participants uses these same levels, they become self-fulfilling prophecies.
VALIDATION
Test RMP effectiveness on your assets:
1. Use TradingView's Bar Replay
2. Review periods with +/-10% movements
3. Count price reactions at refuge levels
4. Higher frequency = higher institutional usage probability
ECOSYSTEM INTEGRATION
RMP integrates with our other indicators:
• RLP/RLPS (Long-Term Refuges): Structural analysis
• RS (Weekly Refuges): Short-term tactical analysis
FEATURES
• 31 configurable levels with individual switches
• Professional visualization with formatted prices
• Complete customization (colors, widths, styles)
• Native integration with TradingView's price scale
• Bar Replay compatible
PHILOSOPHY
RMP doesn't predict the future—it observes price action at objective levels. No oscillators, no curve-fitting. Pure technical analysis based on auction floor techniques proven over decades.
══════════════
VERSION EN ESPANIOL
══════════════
(La version completa con entrada de datos y textos de ayuda en espaniol (Roman Paladino) estara proximamente disponible en mi repositorio GH: aj-poolom-maasewal)
REFUGIOS DE MEDIANO PLAZO (RMP) V1.0
El indicador Refugios de Mediano Plazo (RMP) traza niveles psicologicos de soporte y resistencia basados en una metodologia utilizada por inversores institucionales desde los tiempos de los pisos de subastas. RMP calcula automaticamente 31 niveles clave (refugios) a partir del precio de apertura anual del activo.
METODOLOGIA
• RESISTENCIAS (R1-R15): Proyectadas a intervalos de +10% desde la apertura anual, identificando zonas de presion vendedora
• SOPORTES (S1-S15): Calculados a intervalos de -10%, marcando areas de interes comprador
• PRECIO DE APERTURA ANUAL (PA): Nivel de referencia central
Los intervalos del 10% representan umbrales psicologicos significativos que capturan momentos de indecision, consolidacion o reversion del mercado. Cuando una masa critica de participantes utiliza estos mismos niveles, se convierten en profecias autocumplidas.
VALIDACION
Pruebe la efectividad de RMP en sus activos:
1. Use el Reproductor de Barras de TradingView
2. Revise periodos con movimientos de +/-10%
3. Cuente las reacciones del precio en los niveles refugio
4. Mayor frecuencia = mayor probabilidad de uso institucional
INTEGRACION CON NUESTRO ECOSISTEMA DE INDICADORES DE REFUGIOS CON ACCION DEL PRECIO
(Disponibles para descarga proximamente)
Este indicador RMP se complementa fuertemente con el uso de los siguientes indicadores nuestros:
• RLP (Refugios de Largo Plazo): Busqueda y definicion automatizada de fases preponderantes.
• RLPS (Refugios de Largo Plazo Simplificado): Analisis en base a fase preponderante ya conocida.
• RS (Refugios Semanales): Analisis tactico de fases de corto plazo.
CARACTERISTICAS
• 31 niveles configurables con switches individuales
• Visualizacion profesional con precios formateados
• Personalizacion completa (colores, grosores, estilos)
• Integracion nativa con la escala de precios de TradingView
• Compatible con Reproductor de Barras
FILOSOFIA
RMP no predice el futuro. Observa la accion del precio en niveles objetivos. Sin osciladores, sin sobreajustes. Analisis tecnico puro basado en tecnicas de piso de subastas probadas durante decadas.
════════════════════════════════════════════════════════════
Desarrollado por: aj p'oolom masewal
Codificado con la colaboracion de: Claude Sonnet 4.5 de Anthropic
════════════════════════════════════════════════════════════
MID

OHMLC Lines - Present- Current OHMLC candles
- Show current Open, High, Mid, Low, Close candles levels

Daily Monday Weekly Monthly Quarterly Yearly High Low Mid This indicator can be useful for traders who are interested in analyzing price movements over different time periods. By displaying the daily, Monday, weekly, monthly, quarterly, and yearly high and low values along with their mid values on a chart, traders can get a better understanding of how prices have behaved over longer periods of time.
For example, a trader might use this information to identify trends or patterns in the market. They might look for occasions when the daily high and low values move outside of an established range or when the weekly or monthly mid values cross certain key levels. This could signal a potential change in the market trend that the trader could act upon.
Additionally, the code can help traders identify key support and resistance levels based on the high and low values of the candles. By plotting these values on a chart, traders can see where prices tend to find support or resistance over different time periods. This information can be used to place stop loss orders or take profit orders at important levels.
Overall, the benefit of using the code you provided is that it offers traders a comprehensive view of price movements over different time periods, which can aid in making more informed trading decisions.
Each level described above has its own unique label, which is abbreviated for convenience. These abbreviations are listed below for quick reference:
For daily levels: DH (Daily High), DM (Daily Mid), and DL (Daily Low)
For Monday levels: MonH (Monday High), MonM (Monday Mid), and MonL (Monday Low)
For monthly levels: MH (Monthly High), MU50 (Monthly 50 percent of Mid and High), MM (Monthly Mid), MD50 (Monthly 50 percent of Mid and Low), and ML (Monthly Low)
For quarterly levels: 3MH (Quarterly High), 3MU50 (Quarterly 50 percent of Mid and High), 3MM (Quarterly Mid), 3MD50 (Quarterly 50 percent of Mid and Low), and 3ML (Quarterly Low)
For yearly levels: YH (Yearly High), YU50 (Yearly 50 percent of Mid and High), YM (Yearly Mid), YD50 (Yearly 50 percent of Mid and Low), and YL (Yearly Low)
These labels can help you quickly identify the different levels and keep track of important price points.
If the chosen timeframe does not fall under the category of intraday, daily and Monday level will not be displayed.
Please feel free to send your suggestions to @z_mehran.

Bitcoin Bull Runs Mid Cycle Aligned This script plots 2 lines which are the 2013 and 2016 bull run. The plots are aligned on their mid cycles to the 2021 mid cycle.
Settings:
You can move the plots on the x and y axis in the settings for the Daily, Weekly and Monthly TFs.
The plot is weird on the Monthly TF, best to use the Daily and Weekly.
If it doesn't load at first you have to zoom out fully and go back to 2013 for it to load. Then it will load.

High Low Open Mid Ranges & Levels (Multi-Timeframe)This indicator automatically plots the chosen timeframe's high, low, mid point and open. These levels on higher timeframes act as support and resistance levels on lower timeframes, helping find entries, stoploss and profit targets.
Most common timeframes to choose are Daily, 1W, 1M, and 3M. Other timeframes that are good include, 2D, 2W and 2M.
For example, you can see in the snapshot below, we are on the 4hr TF showing those levels from the 2W. This historical 2W zone (open and mid) was (and currently still is) resistance. You can see it also provided a good entry to go short.
This is also useful for intraday scalping. Below, we are on the 15min TF with levels set on the 2D timeframe. You can see how the Open and Mid levels acted as resistance, providing good entries on range trades, with take profit set at the previous 2D low.
There is also a table which tells you all the main TFs high, low, open, and mid levels. They are the most important ones to look out for.
This indicator should not be used in isolation; it is best to pair it up with other TA such as orderblocks, S/D zones, S&R or overlay indicators.

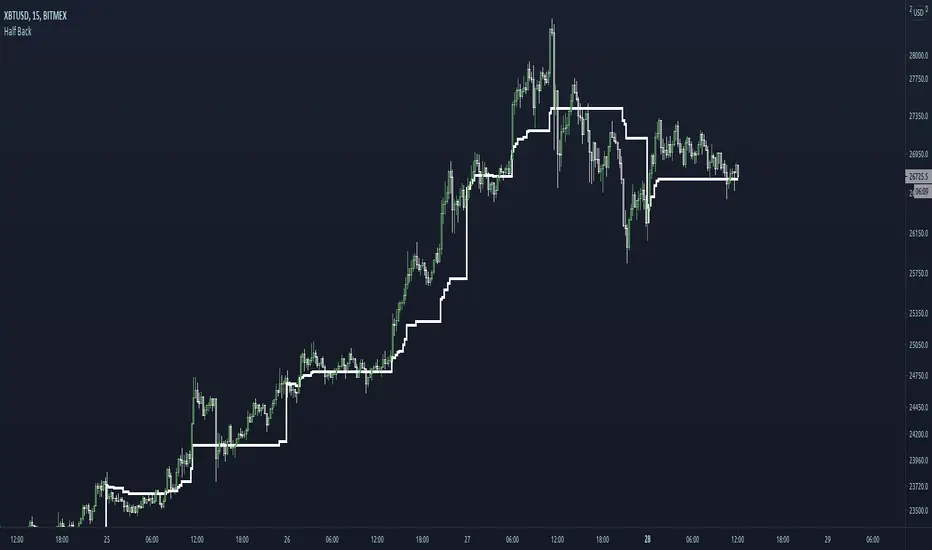
Half BackA dynamic intraday midpoint for Day Timeframe trader reference.
Midpoint is halfway between the day's highest high and lowest low.
Midpoint resets daily.
Intraday Mid PointA moving indicator that is overlaid main chart. Identifies the start of the day, and then applies this formula:
( Current High of Day + Current Low of Day ) / 2, to get the mid point. It is a useful tool to identify buy side or sell side control, along with vwap.

Rolling midpointsThe script made for research purposes which plots these statistics of a given window: Mid-range (max + min)/2, Lower midpoint (mid-range + min)/2, and Higher midpoint (mid-range + max)/2.
This could be interesting when checking periods with sample size <= 0, or checking distros with srs kurtosis values.
Mean & median are also there.

Crypto Market CorrelationThis script utilized some new functions in Pine Script, which compares the correlation between the current symbol to a basket of crypto indexes that are listed on the FTX exchange.
By tracking these indexes we can gauge the reaction across markets that have a different market cap. By that I mean we can have a better idea about where the money is flowing into a specific market.
This script uses data from FTX:BTCPERP, FTX:ALTPERP, FTX:MIDPERP, FTX:SHITPERP, FTX:EXCHPERP, FTX:DRGNPERP.
A value closer to 1 equals to more correlation, closer to 0 equals to less correlation.

Custom Time ranges. Daily price ranges.Addition to previous time range script, now containing daily ranges. You can select a day of the week, and have it show the high, low, mid, and open of that day.
For the time bands:
Monday = 2
Tuesday = 3
Wednesday = 4
Thursday = 5
Friday = 6
Saturday = 7
Sunday = 1
Example 1:
1500-1800:2
This will colour the background between 3pm and 6pm on Mondays.
Example 2:
0000-0600:247
This will colour the background between midnight and 6am on Mondays, Wednesdays, and Saturdays.
For the Daily price ranges:
Just select the tick-box forthe day, and then the price levels you'd like to see.
I want to add specific weekly levels to this, for example: week 06 of year 2020, but I've not figured out how to do it yet. If anyone knows, I'd appreciate it if you let me know. I'll then update this script.
As always, any questions you may have, please leave in comments below and I'll respond when I have time.
If you notice anything good with this indicator, let me know. We are all in this to make money after all! ;)

