Bogdan Ciocoiu - LitigatorDescription
The Litigator is an indicator that encapsulates the value delivered by the Relative Strength Index, Ultimate Oscillator, Stochastic and Money Flow Index algorithms to produce signals enabling users to enter positions in ideal market conditions. The Litigator integrates the value delivered by the above four algorithms into one script.
This indicator is handy when trading continuation/reversal divergence strategies in conjunction with price action.
Uniqueness
The Litigator's uniqueness stands from integrating the above algorithms into the same visual area and leveraging preconfigured parameters suitable for short term scalping (1-5 minutes).
In addition, the Litigator allows configuring the above four algorithms in such a way to coordinate signals by colour-coding or shape thickness to aid the user with identifying any emerging patterns quicker.
Furthermore, Moonshot's uniqueness is also reflected in the way it has standardised the outputs of each algorithm to look and feel the same, and in doing so, enabling users to plug them in/out as needed. This also includes ensuring the ratios of the shapes are similar (applicable to the same scale).
Open-source
The indicator uses the following open-source scripts/algorithms:
www.tradingview.com
www.tradingview.com
www.tradingview.com
www.tradingview.com
MFI

MFI + RSI + MOM With Bull & Bear Trend LabelMOMENTUM + MONEY FLOW INDEX + RELATIVE STRENGTH INDEX WITH BULL & BEAR LABELS
This is a combination of 3 popular indicators. Momentum(MOM), Money Flow Index(MFI) and Relative Strength Index(RSI) along with color changing labels that tell you each indicator's current trend.
The middle white line shows the level that each indicator needs to stay above to be bullish and below for bearish. Watch for all three indicators to cross and hold above or below the mid line for big moves.
It is important to note that these indicators do not need to be going up to be bullish or down to be bearish. They just need to hold above or below the mid line to understand the overall trend.
The momentum indicator is the most relevant in my opinion. If it is holding above the mid line steadily, usually the overall trend will continue upwards so look to buy the dips if the momentum cloud is staying above the white line and vice versa.
It is also important to note that the default settings for this indicator are the 100 period as I find it to be super relevant across most charts but these numbers can be changed in the indicator settings.
Since momentum swings wildly past the normal 0-100 range, it is important to note that the momentum line has been “normalized” to stay within this same range as the rsi and mfi. So if you look at a normal momentum indicator side by side with this indicator it will not look the same however, I find it to be a very good indicator of overall direction so I know the current market sentiment even when price is diverging from the indicator directions.
All of the colors, sources and lengths can be easily customized in the indicator settings input tab.
***HOW TO USE***
When Momentum is above the mid line, it is bullish. When Momentum is below the mid line, it is bearish.
A label on the right side will update in real time to tell you if momentum is Bullish or Bearish for faster recognition of the trend.
When RSI is above the mid line, it is bullish. When Momentum is below the mid line it is bearish.
A label on the right side will update in real time to tell you if RSI is Bullish or Bearish for faster recognition of the trend.
When MFI is above the mid line, it is bullish. When MFI is below the mid line it is bearish.
A label on the right side will update in real time to tell you if MFI is Bullish or Bearish for faster recognition of the trend.
This indicator was built to help you quickly identify the Bullish or Bearish nature of the current trend with a live color changing label so you can glance at the label and understand it's direction without analyzing the indicator data.
***MARKETS***
This indicator can be used as a signal on all markets, including stocks, crypto, futures and forex.
***TIMEFRAMES***
This mom + mfi + rsi indicator can be used on all timeframes.
***TIPS***
Try using numerous indicators of ours on your chart so you can instantly see the bullish or bearish trend of multiple indicators in real time without having to analyze the data. Some of our favorites are our Auto Fibonacci, Directional Movement Index, Volume Profile, Auto Support And Resistance and Money Flow Index in combination with this indicator. They all have real time Bullish and Bearish labels as well so you can immediately understand each indicator's trend.

Adaptive Oscillator constructor [lastguru]Adaptive Oscillators use the same principle as Adaptive Moving Averages. This is an experiment to separate length generation from oscillators, offering multiple alternatives to be combined. Some of the combinations are widely known, some are not. Note that all Oscillators here are normalized to -1..1 range. This indicator is based on my previously published public libraries and also serve as a usage demonstration for them. I will try to expand the collection (suggestions are welcome), however it is not meant as an encyclopaedic resource , so you are encouraged to experiment yourself: by looking on the source code of this indicator, I am sure you will see how trivial it is to use the provided libraries and expand them with your own ideas and combinations. I give no recommendation on what settings to use, but if you find some useful setting, combination or application ideas (or bugs in my code), I would be happy to read about them in the comments section.
The indicator works in three stages: Prefiltering, Length Adaptation and Oscillators.
Prefiltering is a fast smoothing to get rid of high-frequency (2, 3 or 4 bar) noise.
Adaptation algorithms are roughly subdivided in two categories: classic Length Adaptations and Cycle Estimators (they are also implemented in separate libraries), all are selected in Adaptation dropdown. Length Adaptation used in the Adaptive Moving Averages and the Adaptive Oscillators try to follow price movements and accelerate/decelerate accordingly (usually quite rapidly with a huge range). Cycle Estimators, on the other hand, try to measure the cycle period of the current market, which does not reflect price movement or the rate of change (the rate of change may also differ depending on the cycle phase, but the cycle period itself usually changes slowly).
Chande (Price) - based on Chande's Dynamic Momentum Index (CDMI or DYMOI), which is dynamic RSI with this length
Chande (Volume) - a variant of Chande's algorithm, where volume is used instead of price
VIDYA - based on VIDYA algorithm. The period oscillates from the Lower Bound up (slow)
VIDYA-RS - based on Vitali Apirine's modification of VIDYA algorithm (he calls it Relative Strength Moving Average). The period oscillates from the Upper Bound down (fast)
Kaufman Efficiency Scaling - based on Efficiency Ratio calculation originally used in KAMA
Deviation Scaling - based on DSSS by John F. Ehlers
Median Average - based on Median Average Adaptive Filter by John F. Ehlers
Fractal Adaptation - based on FRAMA by John F. Ehlers
MESA MAMA Alpha - based on MESA Adaptive Moving Average by John F. Ehlers
MESA MAMA Cycle - based on MESA Adaptive Moving Average by John F. Ehlers , but unlike Alpha calculation, this adaptation estimates cycle period
Pearson Autocorrelation* - based on Pearson Autocorrelation Periodogram by John F. Ehlers
DFT Cycle* - based on Discrete Fourier Transform Spectrum estimator by John F. Ehlers
Phase Accumulation* - based on Dominant Cycle from Phase Accumulation by John F. Ehlers
Length Adaptation usually take two parameters: Bound From (lower bound) and To (upper bound). These are the limits for Adaptation values. Note that the Cycle Estimators marked with asterisks(*) are very computationally intensive, so the bounds should not be set much higher than 50, otherwise you may receive a timeout error (also, it does not seem to be a useful thing to do, but you may correct me if I'm wrong).
The Cycle Estimators marked with asterisks(*) also have 3 checkboxes: HP (Highpass Filter), SS (Super Smoother) and HW (Hann Window). These enable or disable their internal prefilters, which are recommended by their author - John F. Ehlers . I do not know, which combination works best, so you can experiment.
Chande's Adaptations also have 3 additional parameters: SD Length (lookback length of Standard deviation), Smooth (smoothing length of Standard deviation) and Power ( exponent of the length adaptation - lower is smaller variation). These are internal tweaks for the calculation.
Oscillators section offer you a choice of Oscillator algorithms:
Stochastic - Stochastic
Super Smooth Stochastic - Super Smooth Stochastic (part of MESA Stochastic) by John F. Ehlers
CMO - Chande Momentum Oscillator
RSI - Relative Strength Index
Volume-scaled RSI - my own version of RSI. It scales price movements by the proportion of RMS of volume
Momentum RSI - RSI of price momentum
Rocket RSI - inspired by RocketRSI by John F. Ehlers (not an exact implementation)
MFI - Money Flow Index
LRSI - Laguerre RSI by John F. Ehlers
LRSI with Fractal Energy - a combo oscillator that uses Fractal Energy to tune LRSI gamma
Fractal Energy - Fractal Energy or Choppiness Index by E. W. Dreiss
Efficiency ratio - based on Kaufman Adaptive Moving Average calculation
DMI - Directional Movement Index (only ADX is drawn)
Fast DMI - same as DMI, but without secondary smoothing
If no Adaptation is selected (None option), you can set Length directly. If an Adaptation is selected, then Cycle multiplier can be set.
Before an Oscillator, a High Pass filter may be executed to remove cyclic components longer than the provided Highpass Length (no High Pass filter, if Highpass Length = 0). Both before and after the Oscillator a Moving Average can be applied. The following Moving Averages are included: SMA, RMA, EMA, HMA , VWMA, 2-pole Super Smoother, 3-pole Super Smoother, Filt11, Triangle Window, Hamming Window, Hann Window, Lowpass, DSSS. For more details on these Moving Averages, you can check my other Adaptive Constructor indicator:
The Oscillator output may be renormalized and postprocessed with the following Normalization algorithms:
Stochastic - Stochastic
Super Smooth Stochastic - Super Smooth Stochastic (part of MESA Stochastic) by John F. Ehlers
Inverse Fisher Transform - Inverse Fisher Transform
Noise Elimination Technology - a simplified Kendall correlation algorithm "Noise Elimination Technology" by John F. Ehlers
Except for Inverse Fisher Transform, all Normalization algorithms can have Length parameter. If it is not specified (set to 0), then the calculated Oscillator length is used.
More information on the algorithms is given in the code for the libraries used. I am also very grateful to other TradingView community members (they are also mentioned in the library code) without whom this script would not have been possible.

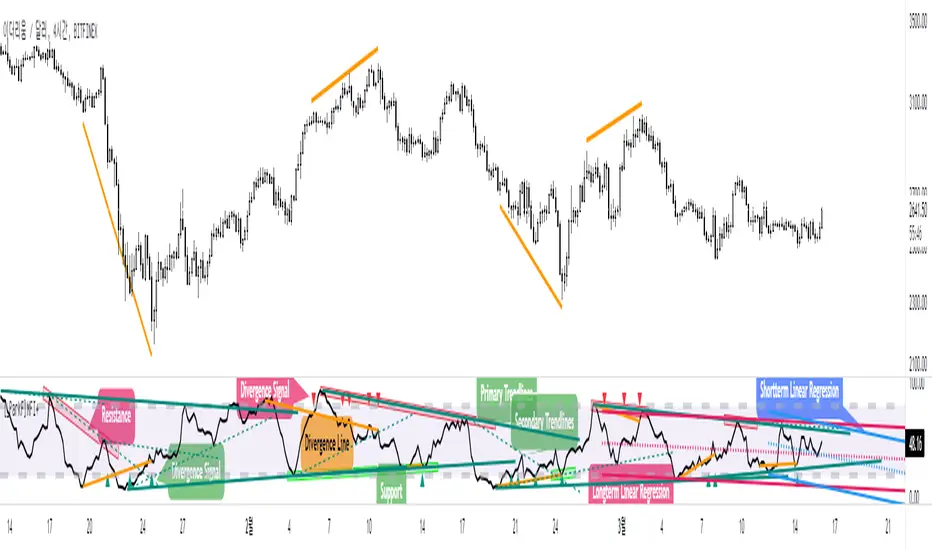
[_ParkF]MFI+Added the Moneyflow Index indicator.
Divergence signals and diversion lines are drawn.
Support and resistance were also confirmed when linear regression and trend lines were used for the Moneyflow Index.
Two linear regression and two trend lines are drawn.
Because the two linear regression values are different, you can see the support and resistance of long-term and short-term linear regression.
Since the periodic values of the two trend lines are also different, support and resistance that could not be identified in linear regression can be identified.
Each linear regression line and trend line can be turned on or off.
In addition, each linear regression line and trend line can arbitrarily modify period values and deviation values.
I hope it will help you trade.
-------------------------------------------------------------------------------------------------------------------------------------------------------------------------------------------
머니플로우인덱스 지표를 추가하였습니다.
다이버전스 신호와 다이버전스 라인이 그려집니다.
머니플로우인덱스에도 선형회귀와 추세선을 이용했을 때 지지와 저항이 확인이 되었습니다.
2개의 선형회귀와 2개의 추세선이 그려지고
두 선형 회귀 값은 서로 다르기 때문에 장기 및 단기 선형 회귀의 지지 및 저항을 확인할 수 있습니다.
두 추세선의 주기 값도 다르므로 선형 회귀 분석에서 확인할 수 없었던 지지 및 저항을 확인할 수 있습니다.
각 선형 회귀선 및 추세선은 켜거나 끌 수 있습니다.
또한 각 선형 회귀선 및 추세선은 주기 값과 편차 값을 임의로 수정할 수 있습니다.
당신의 트레이딩에 도움이 되었으면 합니다.
-------------------------------------------------------------------------------------------------------------------------------------------------------------------------------------------
* I would like to express my gratitude to zdmre for revealing the linear regression source.
* I would like to express my gratitude to aaahopper for revealing the trendlines source.
Measure Volume, Momentum, Trend, VolatilityThis script displays the following indicators in one pane to quickly determine several important factors regarding price action. It allows the user to quickly see all of most important factors surrounding price action in one pane with one quick glance. This should be incredibly helpful and allow things like double divergence and trend confirmation to be spotted much more quickly. I personally use the data in this indicator to replace four separate indicators and it has brought my win rate and profit factor significantly higher. I hadn't seen any place where all of the best J. Welles Wilder indicators such as RSI, Parabolic SAR, and DMI/ADX were brought into one easy to use interface. This is my attempt at fixing that gap. For a much deeper understanding of how to use these indicators, I recommend reading New Concepts in Technical Trading Systems written by J. Welles Wilder.
Momentum via RSI (Relative Strength Index)
Volume via MFI (Money Flow Index)
Volatility via DMI/ADX (Direction Movement Index/Average Directional Index)
Trend via Parabolic SAR (Parabolic Stop and Reverse)
It is worth noting that DMI/ADX and Parabolic SAR can both help determine trend strength and volatility.
The Volatility mechanism is measured by DMI and ADX and displayed at the top of the pane using circles. The top, tiny circles reflect if show if positive DI or negative DI has a higher value. The small circles directly underneath indicate whether or not the ADX is above 20 (configurable, some may choose to increase this to 25 or even 30).
The Momentum mechanism is shown as standard RSI with the default being a white line and default period of 14, which is all configurable.
The Volume mechanism is shown as standard MFI with the default being a fuchsia line and default period of 14, which is also configurable.
The momentum and volume oscillators should be used in conjunction to help spot whether the trend is strong or weak using divergences and the middle, overbought, and oversold levels. These levels are also configurable.
The Trend mechanism is measured by Parabolic SAR and displayed at the bottom of the pane using diamonds. The default is red diamonds when in a bear trend, green when in an uptrend which is configurable. When price is above the Parabolic SAR, it is considered to be an uptrend. When price is below the Parabolic SAR, it is considered to be a downtrend. The way price is measured is also configurable (i.e. open, close, ohlc4, hlc3, etc.). When price crossed above or below the Parabolic SAR, the diamonds will change colors.
All the indicators displayed should be used in a well rounded strategy. For instance, I only trade when ADX is above 20 and rarely trade against the trend shown via PSAR. When trend shifts and divergences helped indicate a trend shift would occur using the RSI and MFI, it can be a great spot to take an entry. RSI/MFI can also confirm the trend is strong when they are not showing divergences and inline with price action. All of this data should be used in conjunction with good fundamental data and technical levels. Divergences with RSI and MFI on double tops or bottoms can also be incredibly powerful. There is no right or wrong way to use all the data displayed in this indicator, however using all four pillars of trading (Momentum, Volume, Trend, Volatility) will help ensure only the best trades are taken.

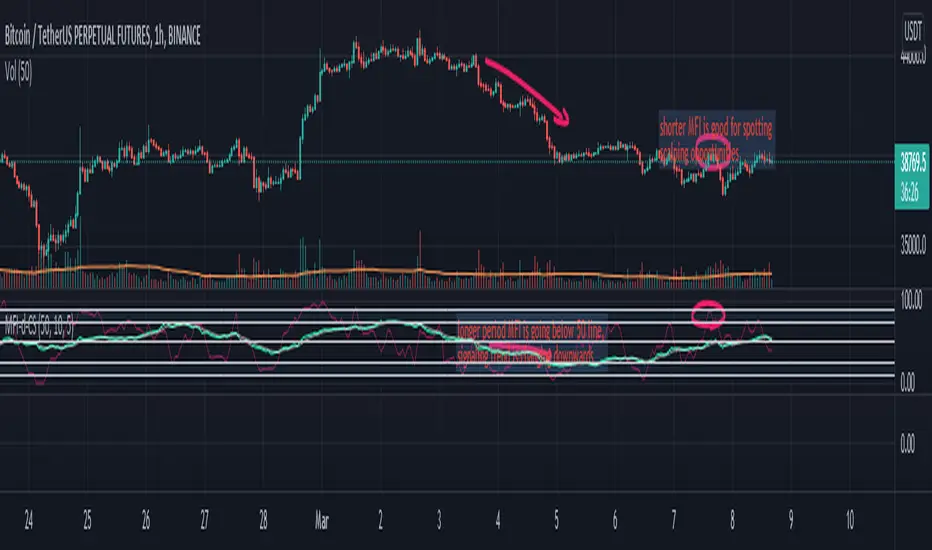
Money Flow Index (double) by CoinStaghey Piners community,
this is an iteration of inbuilt MFI script, with two MFIs of different lengths and one Moving Average which is dependent on MFI 1.
I find it useful to see the trend of longer MFI period, which tells me what direction to trade. On shorter period MFI I'm looking at Oversold or Overbought zones - while quicker MFI index is there, I'm looking to Buy/Sell, depending on trend.
Alternatively, you can use also MFI1 and MA crossovers to spot potential entries.
It seems like a good tool for crypto markets on any timeframes - from 5min, to 4h.
Compound Indicator Strategy - BTC/USDT 3hThis is an Strategy finds and utilise end points of short term market trends and this is a combination of many indicators such as
1. Volume change oscillator
2. Money flow index ( MFI )
3. Momentum Oscillator (MOM)
4. Stochastic Indicator
6. Relative Strength Indicator ( RSI )
7. Relative volatility index (RVI)
8. Balance of power (BOP)
9. Small moving average ( SMA )
10. Exponential moving average ( EMA )
11. Parabolic SAR
12. Super trend indicator
this script forms a compound indicator after analysing movements of those indicators through different time frames and measure its co-relation and variance with the price action. buy doing that, indicator in a position to identify short term market reversals and presented.
after generating a common indicator, it evaluates standard deviation and standard variance with currant market price action and generates a buy and sell signals. you can determine your own trading method based on available options.

Compound IndicatorThis is an indicator finds end points of short term market trends. this is a combination of many indicators such as
1. Volume change oscillator
2. Money flow index (MFI)
3. Momentum Oscillator (MOM)
4. Stochastic Indicator
6. Relative Strength Indicator (RSI)
7. Relative volatility index (RVI)
8. Balance of power (BOP)
9. Small moving average (SMA)
10. Exponential moving average (EMA)
11. Parabolic SAR
12. Super trend indicator
this script forms a compound indicator after analysing movements of those indicators through different time frames and measure its co-relation and variance with the price action. buy doing that, indicator in a position to identify short term market reversals and presented.

Buy / Sell alert indicator [Crypto_BCT]Hello everyone!
I bring to your attention a indicator to determine the point of buy and sell purchase.
It is based on oscillators and a moving average.
It can be used to work with bots, for example 3COMMAS DCA bot.
Signal Condition Settings:
ATR
The current candle is larger than the ATR for this period
EMA
The signal is necessarily below (for buy) and above (for sell) the EMA of the specified period
(Buy) RSI low
The RSI index is below this value
(Sell) RSI High
The RSI index is higher than this value
(Buy) MFI low
The MFI index is below this value
(Sell) MFI High
The MFI index is higher than this value
(Buy) CCI low
CCI index is below this value
(Sell) CCI High
The CCI index is higher than this value
(Buy) Lowest bar from
The closing of the current bar is lower than the closing of the bars back in this range
(Sell) Highest bar from
The closing of the current bar is higher than the closing of bars in this range
(Buy) Lowest EMA bar ago
During a given distance back, the EMA value only decreased
(Sell) Highest EMA bar ago
At a given distance back, the EMA value only increased
I hope it will be useful!

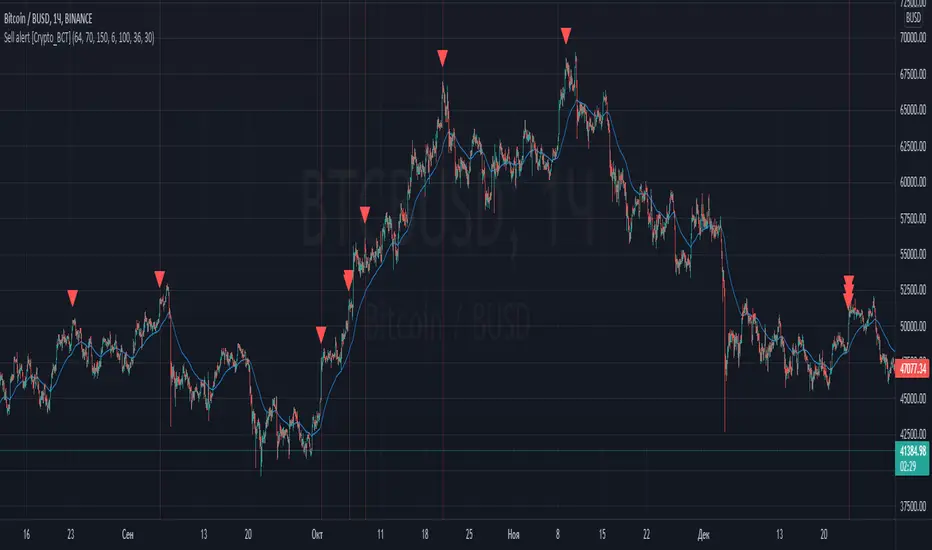
Sell alert [Crypto_BCT]Hello everybody!
I bring to your attention an indicator for determining the point of sell.
It is based on oscillators and a moving average.
Signal Condition Settings:
ATR
The current candle is larger than the ATR for this period
EMA
The signal must be above the EMA of the specified period
MFI High
The MFI index is higher than this value
CCI High
The CCI index is higher than this value
RSI High
The RSI index is higher than this value
Highest bar from
The closing of the current bar is higher than the closing of bars in this range
Highest EMA bar ago
At a given distance back, the EMA value only increased
I hope it will be useful!
Buy alert [Crypto_BCT]Hello everyone!
I bring to your attention a simple indicator to determine the point of purchase.
It is based on oscillators and a moving average.
It can be used to work with bots, for example 3COMMAS DCA bot.
Signal Condition Settings:
ATR
The current candle is larger than the ATR for this period
EMA
The signal is necessarily below the EMA of the specified period
MFI low
The MFI index is below this value
CCI low
CCI index is below this value
RSI low
The RSI index is below this value
Lowest bar from
The closing of the current bar is lower than the closing of the bars back in this range
Lowest EMA bar ago
During a given distance back, the EMA value only decreased
I hope it will be useful!

Williams %R & RSI with Multiple PeriodsDESCRIPTION
1. Calculates %R and RSI with multiple period lengths.
1 period length value is defined by User.
8 period length values follow User's selection of classic number sequences, e.g. Fibonacci, Leonardo, Lucas, Narayana, etc.
2. User selects which indicator and periods to display or hide.
DEFAULTS
%R default custom period: 10.
RSI default custom period: 14.
%R & RSI default number sequence periods: Lucas numbers 11, 18, 29, 47, 76, 123, 199, 322.
CALCULATIONS
%R = (period high - most recent period's close price)/(period high - period low)
RSI = 100 - 1 / (100 + RS), where RS = SMMA(up, period) / SMMA(down, period)
PURPOSE
1. Identify price trends.
CREDITS
1. Williams %R technical analysis momentum oscillator by Larry Williams.
2. Wilder's Relative Strength Index technical analysis momentum oscillator by J. Welles Wilder.
3. "Solarized" color scheme by Ethan Schoonover.
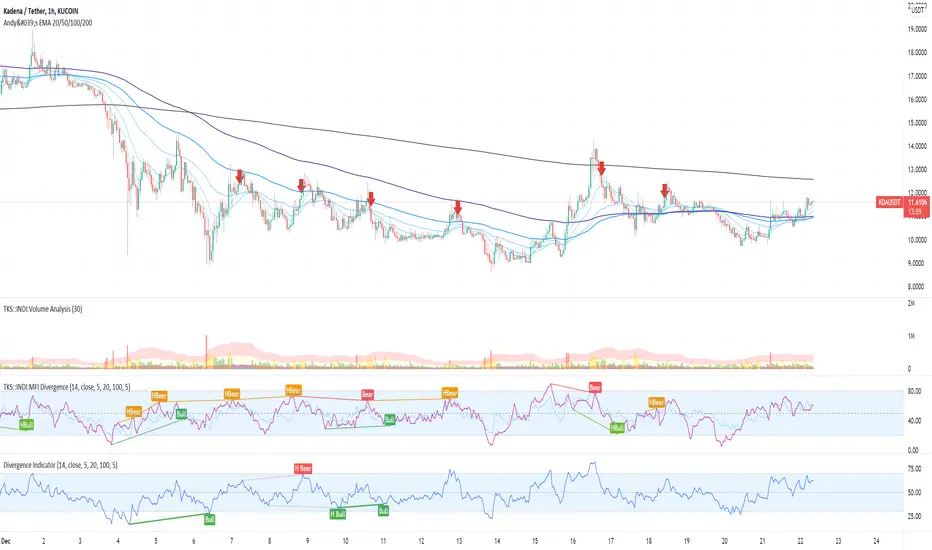
MFI Divergence Indicator Our Developer Malin converted the built-in RSI divergence indicator to MFI (Money Flow Index).
How to apply?
Notice 1: MFI, unlike the RSI, incorporates volume. It thus is an indicator of a higher precision when it comes to finding the the moment to sell - or - the moment to enter.
Notice 2: In Ranging Markets MFI (and RSI) is a solid momentum indicator to buy or sell. The asset displayed shows a slight markdown. Thus, we are looking primarily for short positions. Once can tell by us omitting the first 2 hidden bearish divergence signals and then entering the market.
Notice 3: Divergences depend on pivot points. The drawback with pivot points is that it is a lagging indication of a potential reversal. The more time (bars) one takes to confirm a reversal the less profitable is the trade - but less risky. In the charts one can tell that we enter the market 5 bars later. Usually that is not the tip of the reversal.
Notice 4: One must adapt the left and right periods of the indicator to risk/reward ratio, length of swing / frequency modulation and volatility of the price action.
Credits: Credits go to the Tradingview Team for delivering the original code. And Malin for the conversion. Please keep the copy right as a courtesy.
Oversold / OverboughtMy first script. Based on RSI , CCI , RVI, and MFI . You can customize overbought or oversold thresholds for any indicator.
If you have any ideas - welcome.
Disclaimer
This is not financial advice. Trade on your own risk.

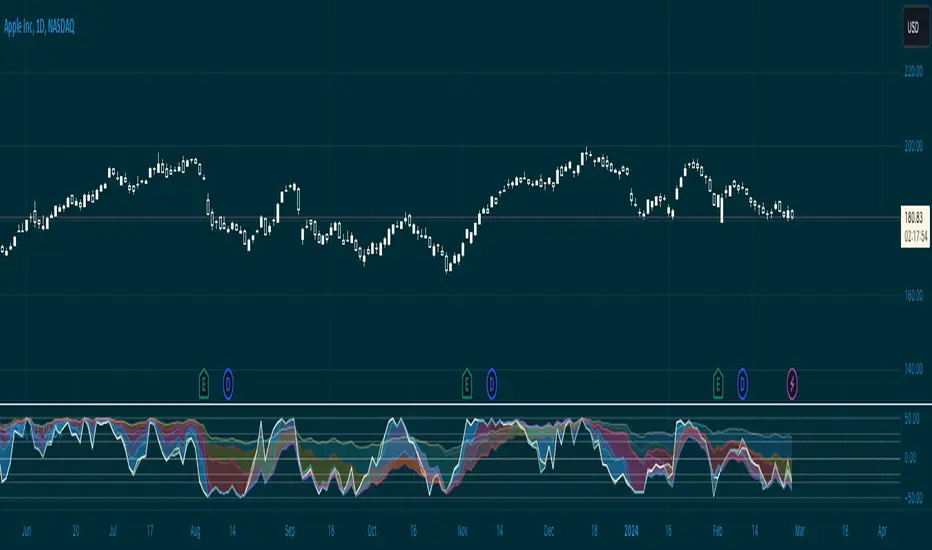
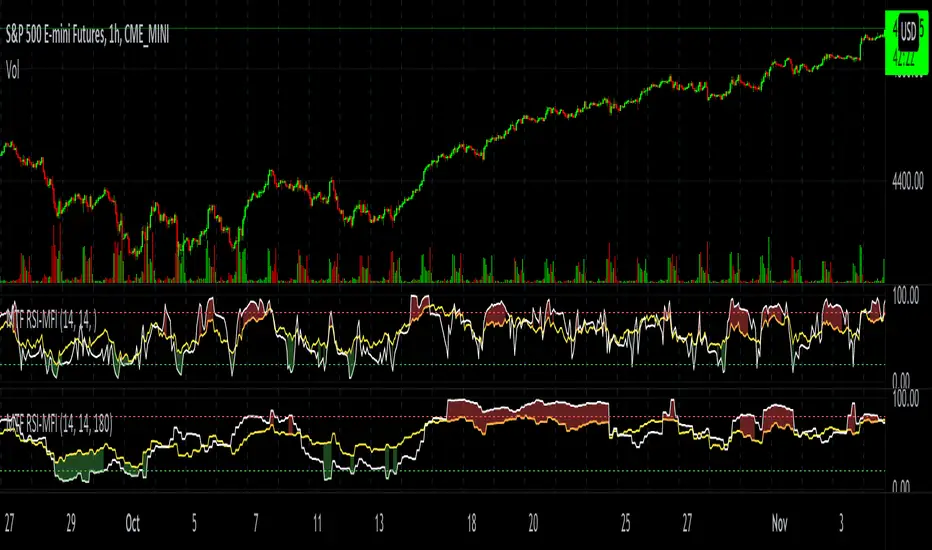
MTF RSI-MFIThe script plots both RSI and MFI of security, automatically highlights oversold and overbought conditions and allows for calculating indicators on timeframes other than the chart.
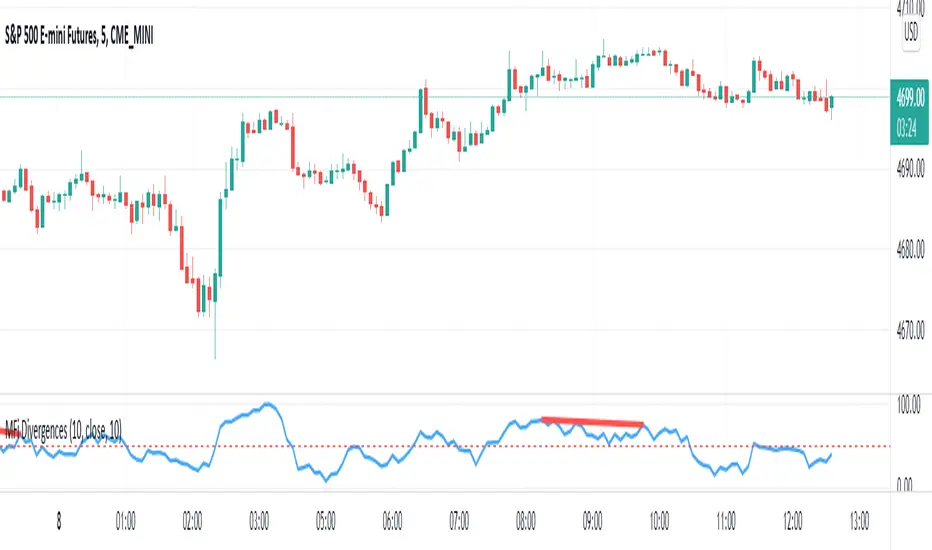
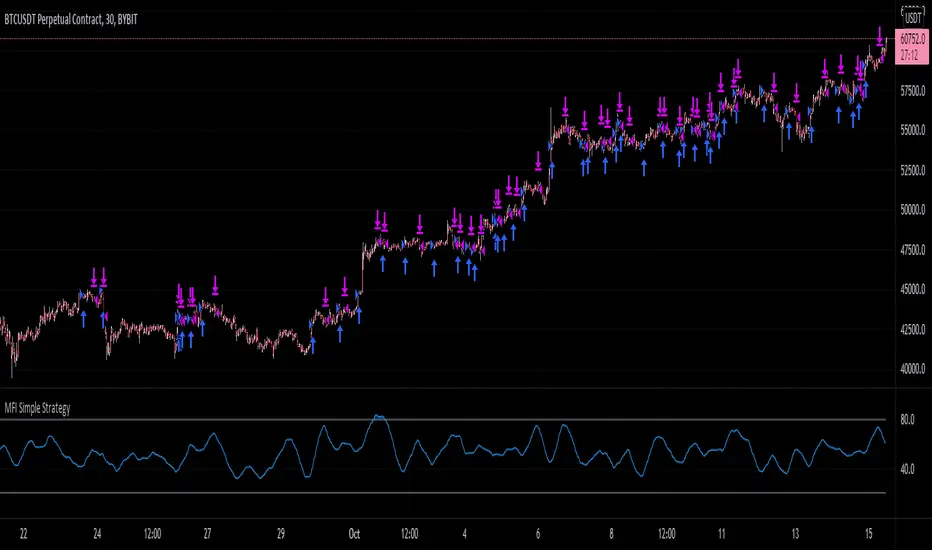
MFI Simple StrategyHere I've made a simple strategy based off a simple moving average of an MFI length.
Back tested on a BYBIT:BTCUSDT 30m chart.
Conditions:
---When the price is above the golden SMA of 200 bars---
- Buy: when MFI is moving up
- Sell: when MFI is moving down
- Stop: golden SMA of 200 bars
If you would like alerts:
1.) Add the strategy to your chart,
2.) Go to "Create Alert",
3.) Select "MFI Simple Strategy" in your alert creator,
4.) Select whatever notifications settings or message settings,
5.) Finally, click "Create" and you're good to go.
Disclaimer: Please do your own research before making any decisions financially. Past results do not guarantee future results.
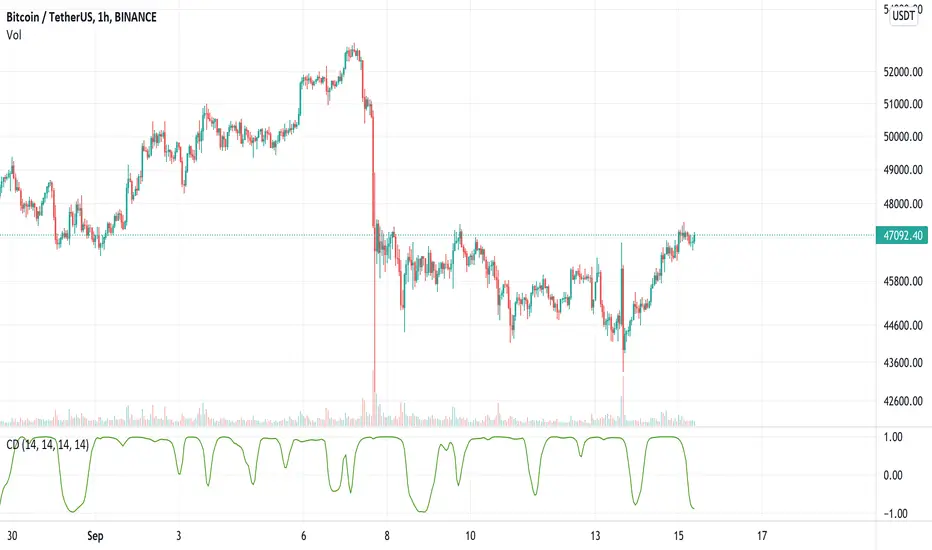
Continuous DivergenceDivergence is generally measured on the RSI and limited to finding either:
1. higher highs on the price and lower highs on the RSI (bearish divergence)
2. lower lows on the price and higher lows on the RSI (bullish divergence)
Continuous Divergence (CD) does two things differently. Firstly, it uses the MFI as its primary source of data, due to its volume component giving it higher accuracy. Secondly, it doesn't measure discrete divergence - i.e. between peaks and troughs - but rather a continuous divergence measurement.
Essentially it is measuring at any given time, the correlation between the price and the MFI. This is smoothed with a moving average (configurable) to get cleaner lines.
CD is used to detect both a slowing down of momentum on the current trend, and a reversal of trend due to changing momentum.
Kifier's MFI/STOCH Hidden Divergence/Trend BeaterMFI/STOCH Hidden Divergence/Trend Beater
General Idea:
My premise around this strategy was to make a general strategy for crypto that would help out with finding entry positions for when you’re bullish on a crypto and want to hold on for a while, and at the same time avoiding massive drops. Essentially a way to mix long term/ swing trading; I somewhat achieved my goal however it still requires a lot of logic tuning of the trend averages.
I’m a huge proponent of volume indicators and coupled with average closing price, I think this gives a really good idea of what is happening with the market. It gives an idea on the market and retail investor sentiment. This generally gives you logical entry positions (Although I don’t know how amazing that will work with all cryptos, there’s a fine line between a good strategy and one that just rides bubble market conditions, some would argue that’s still a success and others not)
How it works:
There are many components to the strategy that try to do different things:
First of all there are two types of entries, a MFI hidden divergence with a STOCH check, essentially it will only fire when a divergence is detected while STOCH is above 50%, however this might be changed in the future as due to the volatile nature of cryptos, the STOCH is not too effective. The second entry is a simple MFI/STOCH trend, if STOCH is above 50% and the trend is detected to be in a trending long, once a MFI crossover over the 50% line is detected an entry is placed, this is designed to get out profit where the divergence would otherwise be less accurate during strongly trending conditions.
-MFI is a great indicator, as a volume weighted momentum indicator I find it the most accurate of all, the STOCH however is a great indicator to get a general picture of simple market conditions and can filter out the emotional noise of retail investors.
-VWMA and an SMA (The bottom oscillator) gives an idea of the trend tacking into account of the volume, this serves as a more short term filter of the trend for filters.
-OBV checks are done between the OBV and an EMA of the OBV, to get the idea of a volume weighted long trend, which is important for crypto as there are massive rallies to go up due to retail greed, it’s great to jump onto it at the beginning, and get off before the stack of cards fall apart.
-ATR is used to detect when the market is relatively just ranging or moving sideways, which is where the hidden divergence entries are done, during predictable and profitable market conditions.
- Stop loss is based on the closest support of the entry, this is a nice medium of room to breath but also an actual stop loss.
Future plans and improvements:
Currently there’s a lot I want to improve, mostly the divergence detection and the overall sharpe ratio could be much better, but the current value of 0.5 gives me hope that the strategy is onto something. I also want to change TP from a percentage stop to something more dynamic but that might be too optimistic. The current plan is to paper trade test this either by manual or by a python bot, to see how it performs with some user input as well.

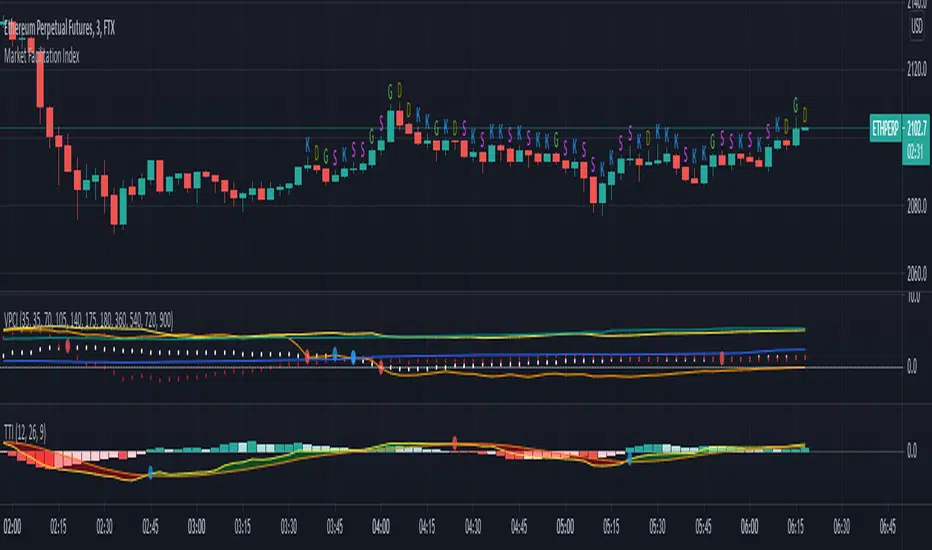
[MFI] Market Facilitation Index Written by Bruce-JSH
Implemented MFI(Market Facilitation Index) of Buff Dormeier
no license, no copyright.
There are no obligations or restrictions on you no matter how you do this script.
version 2021.07.11.a
1. First public release
2. G => Green(++), D => faDe bar(--), K => faKe bar(-+), S => Squat bar(+-)
Dynamic SMAThis script uses dynamic length to create a different sma type.
The length of the "Dynamic SMA" - "dSMA" can be:
'RSI', 'Stoch', 'ATR', 'MFI' or '%R'
For example 'RSI' -> the length of the sSMA will be the RSI itself
The biggest challenge was:
'Pine cannot determine the referencing length of a series. Try using max_bars_back' error
The writer of 'referencing length of a series' issue gave following solution:
bar_index == 0 ? 4999 : len
or in case of values which don't go above 100:
bar_index == 0 ? 100 : len
This assigns the necessary buffer to the function.
I'm most grateful for the given solution!
These dSMA's can give Support/Resistance levels, also crossovers of different dSMA's can give extra information
Examples:
RSI
ATR (close / atr(len)
Stoch
MFI
%R
"show regular SMA" will show the "SMA" with the same length (with default lighter color)

VWMA with kNN Machine Learning: MFI/ADXThis is an experimental strategy that uses a Volume-weighted MA (VWMA) crossing together with Machine Learning kNN filter that uses ADX and MFI to predict, whether the signal is useful. k-nearest neighbours (kNN) is one of the simplest Machine Learning classification algorithms: it puts input parameters in a multidimensional space, and then when a new set of parameters are given, it makes a prediction based on plurality vote of its k neighbours.
Money Flow Index (MFI) is an oscillator similar to RSI, but with volume taken into account. Average Directional Index (ADX) is an indicator of trend strength. By putting them together on two-dimensional space and checking, whether nearby values have indicated a strong uptrend or downtrend, we hope to filter out bad signals from the MA crossing strategy.
This is an experiment, so any feedback would be appreciated. It was tested on BTC/USDT pair on 5 minute timeframe. I am planning to expand this strategy in the future to include more moving averages and filters.

Chart OscillatorI present you the chart oscillator where an oscillator (Stoch or RSI) is plotted
on the chart itself (instead of below the chart)
It is inspired on an idea of @Kablamicus
Instead of having the lines between 0 and 100, here the '0-100' are
- lowest(low, len)
- highest(high, len)
An overbought/oversold and a middle line is derived from these lines
and the oscillator goes in between.
It resembles very much the 'normal' oscillator, with a few extra's:
- you can see the movement of the candles against the oscillator
- S/R levels of oscillator, 50 line, overbought/oversold line, 0-100 line
Stoch:
RSI:
Also a table is included with the Stoch/RSI values
Cheers!
