Volume Sentiment Breakout Channels [AlgoAlpha]🟠 OVERVIEW
This tool visualizes breakout zones based on volume sentiment within dynamic price channels . It identifies high-impact consolidation areas, quantifies buy/sell dominance inside those zones, and then displays real-time shifts in sentiment strength. When the market breaks above or below these sentiment-weighted channels, traders can interpret the event as a change in conviction, not just a technical breakout.
🟠 CONCEPTS
The script builds on two layers of logic:
Channel Detection : A volatility-based algorithm locates price compression areas using normalized highs and lows over a defined lookback. These “boxes” mark accumulation or distribution ranges.
Volume Sentiment Profiling : Each channel is internally divided into small bins, where volume is aggregated and signed by candle direction. This produces a granular sentiment map showing which levels are dominated by buyers or sellers.
When a breakout occurs, the script clears the previous box and forms a new one, letting traders visually track transitions between phases of control. The colored gradients and text updates continuously reflect the internal bias—green for net-buying, red for net-selling—so you can see conviction strength at a glance.
🟠 FEATURES
Volume-weighted sentiment map inside each box, with gradient color intensity proportional to participation.
Dynamic text display of current and overall sentiment within each channel.
Real-time trail lines to show active bullish/bearish trend extensions after breakout.
🟠 USAGE
Setup : Add the script to your chart and enable Strong Closes Only if you prefer cleaner breakouts. Use shorter normalization length (e.g., 50–80) for fast markets; longer (100–200) for smoother transitions.
Read Signals : Transparent boxes mark active sentiment channels. Green gradients show buy-side dominance, red shows sell-side. The middle dashed line is the equilibrium of the channel. “▲” appears when price breaks upward, “▼” when it breaks downward.
Understanding Sentiment : The sentiment profile can be used to show the probability of the price moving up or down at respective price levels.
Meanreversion

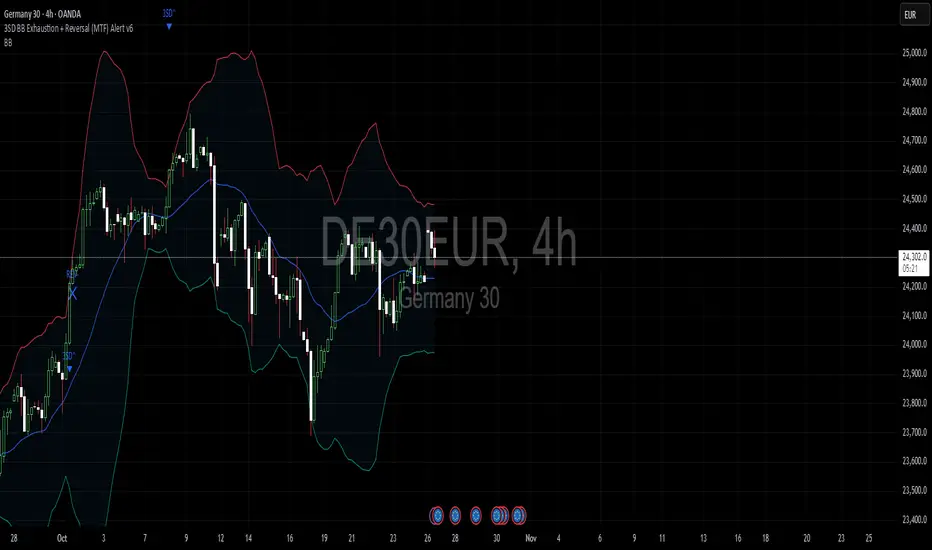
3SD Bollinger Exhaustion & Reversal Alert IndicatorThe Bollinger Band 3 Standard Deviation (3SD) captures roughly 99% of price action within its boundaries.
When price moves beyond these extremes, it often signals temporary overextension — creating opportunities for mean reversion trades, especially when aligned with the prevailing trend.
This indicator alerts you when:
- Price touches the 3SD Bollinger Band on higher timeframes (H4, D1, W1, M1), and
- A reversal reaction occurs — defined by a bullish or bearish candle close on H1 or H4.
Together, these conditions identify potential high-probability entry zones where exhaustion meets trend alignment.
🚀 Coming Soon
A premium version is in development, combining this 3SD exhaustion logic with my proprietary trend-following system.
It will generate confluence-based trade signals when price interacts with both the 3SD band and the trend-following band.
Stay tuned for updates.
VWAP Composites📊 VWAP Composite - Advanced Multi-Period Volume Weighted Average Price Indicator
═══════════════════════════════════════════════════════════════════
🎯 OVERVIEW
VWAP Composite is an advanced volume-weighted average price (VWAP) indicator that goes beyond traditional single-period VWAP calculations by offering composite multi-period analysis and unprecedented customization. This indicator solves a common problem traders face: traditional VWAP resets at arbitrary intervals (session start, day, week), but significant price action and volume accumulation often spans multiple periods. VWAP Composite allows you to anchor VWAP calculations to any timeframe—or combine multiple periods into a single composite VWAP—giving you a true representation of average price weighted by volume across the exact periods that matter to your analysis.
═══════════════════════════════════════════════════════════════════
⚙️ HOW IT WORKS - CALCULATION METHODOLOGY
📌 CORE VWAP CALCULATION
The indicator calculates VWAP using the standard volume-weighted formula:
• Typical Price = (High + Low + Close) / 3
• VWAP = Σ(Typical Price × Volume) / Σ(Volume)
This calculation is performed across user-defined time periods, ensuring each bar's contribution to the average is proportional to its trading volume.
📌 STANDARD DEVIATION BANDS
The indicator calculates volume-weighted standard deviation to measure price dispersion around the VWAP:
• Variance = Σ / Σ(Volume)
• Standard Deviation = √Variance
• Upper Band = VWAP + (StdDev × Multiplier)
• Lower Band = VWAP - (StdDev × Multiplier)
These bands help identify overbought/oversold conditions relative to the volume-weighted mean, with high-volume price excursions having greater impact on band width than low-volume moves.
📌 COMPOSITE PERIOD METHODOLOGY (Auto Mode)
Unlike traditional VWAP that resets at fixed intervals, Auto Mode creates composite VWAPs by combining the current period with N previous periods:
• Period Span = 1: Current period only (standard VWAP behavior)
• Period Span = 2: Current period + 1 previous period combined
• Period Span = 3: Current period + 2 previous periods combined
• And so on...
Example: A 3-period Weekly composite VWAP calculates from the start of 2 weeks ago through the current week's end, creating a single VWAP that represents 21 days of continuous price and volume data. This provides context about where price stands relative to the volume-weighted average over multiple weeks, not just the current week.
═══════════════════════════════════════════════════════════════════
🔧 KEY FEATURES & ORIGINALITY
✅ DUAL OPERATING MODES
1️⃣ MANUAL MODE (5 Independent VWAPs)
Define up to 5 separate VWAP calculations with custom start/end times:
• Perfect for anchoring VWAP to specific events (earnings, Fed announcements, major reversals)
• Each VWAP has independent color settings for lines and deviation band backgrounds
• Individual control over calculation extension and visual extension (explained below)
• Useful for tracking multiple institutional accumulation/distribution zones simultaneously
2️⃣ AUTO MODE (Composite Period VWAP)
Automatically calculates VWAP across combined time periods:
• Supported periods: Daily, Weekly, Monthly, Quarterly, Yearly
• Configurable period span (1-20 periods)
• Always up-to-date, recalculates on each new bar
• Ideal for systematic analysis across consistent timeframes
✅ DUAL EXTENSION SYSTEM (Manual Mode Innovation)
Most VWAP indicators only offer "on/off" for extending calculations. This indicator provides two distinct extension options:
🔹 EXTEND CALCULATION TO CURRENT BAR
When enabled, continues including new bars in the VWAP calculation after the defined end time. The VWAP value updates dynamically as new volume enters the market.
Use case: You anchored VWAP to a major low 3 weeks ago. You want the VWAP to continue evolving with new volume data to track ongoing institutional positioning.
🔹 EXTEND VISUAL LINE ONLY
When enabled (and calculation extension is disabled), projects the "frozen" VWAP value forward as a reference line. The VWAP value remains fixed at what it was at the end time, but the line and deviation bands visually extend to current price.
Use case: You want to see how price is behaving relative to the VWAP that existed at a specific point in time (e.g., "Where is price now vs. the 5-day VWAP that existed at last Friday's close?").
This dual system gives you unprecedented control over whether you're tracking a "living" VWAP that incorporates new data or using historical VWAP levels as static reference points.
✅ CUSTOMIZABLE STANDARD DEVIATION BANDS
• Adjustable multiplier (0.1 to 5.0)
• Independent background colors with opacity control for each VWAP
• Dashed band lines for easy visual distinction from main VWAP
• Bands extend when visual extension is enabled, maintaining zone visibility
✅ COMPREHENSIVE LABELING SYSTEM
Each VWAP displays:
• Current VWAP value
• Upper deviation band value (High)
• Lower deviation band value (Low)
• Extension status indicator (Calc Extended / Visual Extended)
• Color-coded for quick identification
═══════════════════════════════════════════════════════════════════
📖 HOW TO USE THIS INDICATOR
🎯 SCENARIO 1: EVENT-ANCHORED VWAP (Manual Mode)
Use case: A stock gaps down 15% on earnings and you want to track where institutions are positioning during the recovery.
Setup:
1. Switch to Manual Mode
2. Enable VWAP 1
3. Set Start Time to the earnings gap bar
4. Set End Time to current time (or leave far in future)
5. Enable "Extend Calculation to Current Bar"
6. Watch how price respects the VWAP as a dynamic support/resistance
Interpretation:
• Price above VWAP = buyers in control since the event
• Price testing VWAP from above = potential support
• Volume-weighted standard deviation bands show normal price range
• Price outside bands = potential exhaustion/mean reversion setup
🎯 SCENARIO 2: MULTI-WEEK INSTITUTIONAL ACCUMULATION ZONE (Auto Mode)
Use case: You trade swing setups and want to identify where institutions have been accumulating over the past 3 weeks.
Setup:
1. Switch to Auto Mode
2. Select "Weekly" period type
3. Set Period Span to 3
4. Enable standard deviation bands
Interpretation:
• 3-week composite VWAP shows the true average institutional entry
• Price bouncing off VWAP repeatedly = strong support (institutions defending their average)
• Price breaking below VWAP on high volume = potential distribution
• Deviation bands contracting = consolidation; expanding = volatility increase
🎯 SCENARIO 3: COMPARING MULTIPLE TIME HORIZONS (Manual Mode)
Use case: You want to see short-term vs medium-term vs long-term VWAP alignments.
Setup:
1. Switch to Manual Mode
2. VWAP 1: Last 5 trading days (blue)
3. VWAP 2: Last 10 trading days (orange)
4. VWAP 3: Last 20 trading days (purple)
5. Enable "Extend Calculation" for all
6. Set different background colors for visual separation
Interpretation:
• All VWAPs aligned upward = strong trend across all timeframes
• Price between VWAPs = finding equilibrium between different trader timeframes
• Short-term VWAP crossing long-term VWAP = momentum shift
• Price rejecting at higher-timeframe VWAP = that timeframe's traders defending their average
🎯 SCENARIO 4: HISTORICAL VWAP REFERENCE LEVELS (Manual Mode)
Use case: You want to see where the 1-month VWAP was at each month-end as static reference levels.
Setup:
1. Switch to Manual Mode
2. VWAP 1: Set to last month's start/end dates
3. VWAP 2: Set to 2 months ago start/end dates
4. VWAP 3: Set to 3 months ago start/end dates
5. Disable "Extend Calculation"
6. Enable "Extend Visual Line Only"
Interpretation:
• Each VWAP represents the volume-weighted average for that complete month
• These become static support/resistance levels
• Price returning to old monthly VWAPs = institutional memory/gap fill behavior
• Useful for identifying longer-term value areas
═══════════════════════════════════════════════════════════════════
🎨 CUSTOMIZATION OPTIONS
GENERAL SETTINGS
• Show/hide labels
• Line style: Solid, Dashed, or Dotted
• Standard deviation multiplier (impacts band width)
• Toggle standard deviation bands on/off
MANUAL MODE (Per VWAP)
• Custom start and end times
• Line color picker
• Background color picker (with transparency control)
• Extend calculation option
• Extend visual option
• Show/hide individual VWAPs
AUTO MODE
• Period type selection (Daily/Weekly/Monthly/Quarterly/Yearly)
• Period span (1-20 periods)
• Line color
• Background color (with transparency control)
═══════════════════════════════════════════════════════════════════
💡 TRADING APPLICATIONS
✓ Mean Reversion: Use deviation bands to identify stretched prices likely to return to VWAP
✓ Trend Confirmation: Price sustained above VWAP = bullish bias; below = bearish bias
✓ Support/Resistance: VWAP often acts as dynamic S/R, especially on higher volume periods
✓ Institutional Positioning: Multi-day/week VWAPs show where large players have established positions
✓ Entry Timing: Wait for pullbacks to VWAP in trending markets
✓ Stop Placement: Use VWAP ± standard deviation as volatility-adjusted stop levels
✓ Breakout Confirmation: Breakouts from consolidation with price reclaiming VWAP = stronger signal
✓ Multi-Timeframe Analysis: Compare short vs long-period VWAPs to gauge momentum alignment
═══════════════════════════════════════════════════════════════════
⚠️ IMPORTANT NOTES
• The indicator redraws on each bar to maintain accurate visual representation (uses `barstate.islast`)
• Maximum lookback is limited to 5000 bars for performance optimization
• Time range calculations work across all timeframes but are most effective on intraday to daily charts
• Standard deviation bands assume volume-weighted distribution; extreme events may violate assumptions
• Auto mode always calculates to current bar; use Manual mode for fixed historical periods
═══════════════════════════════════════════════════════════════════
This indicator is open-source. Feel free to examine the code, learn from it, and adapt it to your needs.

Mean Reversion Oscillator [Alpha Extract]An advanced composite oscillator system specifically designed to identify extreme market conditions and high-probability mean reversion opportunities, combining five proven oscillators into a single, powerful analytical framework.
By integrating multiple momentum and volume-based indicators with sophisticated extreme level detection, this oscillator provides precise entry signals for contrarian trading strategies while filtering out false reversals through momentum confirmation.
🔶 Multi-Oscillator Composite Framework
Utilizes a comprehensive approach that combines Bollinger %B, RSI, Stochastic, Money Flow Index, and Williams %R into a unified composite score. This multi-dimensional analysis ensures robust signal generation by capturing different aspects of market extremes and momentum shifts.
// Weighted composite (equal weights)
normalized_bb = bb_percent
normalized_rsi = rsi
normalized_stoch = stoch_d_val
normalized_mfi = mfi
normalized_williams = williams_r
composite_raw = (normalized_bb + normalized_rsi + normalized_stoch + normalized_mfi + normalized_williams) / 5
composite = ta.sma(composite_raw, composite_smooth)
🔶 Advanced Extreme Level Detection
Features a sophisticated dual-threshold system that distinguishes between moderate and extreme market conditions. This hierarchical approach allows traders to identify varying degrees of mean reversion potential, from moderate oversold/overbought conditions to extreme levels that demand immediate attention.
🔶 Momentum Confirmation System
Incorporates a specialized momentum histogram that confirms mean reversion signals by analyzing the rate of change in the composite oscillator. This prevents premature entries during strong trending conditions while highlighting genuine reversal opportunities.
// Oscillator momentum (rate of change)
osc_momentum = ta.mom(composite, 5)
histogram = osc_momentum
// Momentum confirmation
momentum_bullish = histogram > histogram
momentum_bearish = histogram < histogram
// Confirmed signals
confirmed_bullish = bullish_entry and momentum_bullish
confirmed_bearish = bearish_entry and momentum_bearish
🔶 Dynamic Visual Intelligence
The oscillator line adapts its color intensity based on proximity to extreme levels, providing instant visual feedback about market conditions. Background shading creates clear zones that highlight when markets enter moderate or extreme territories.
🔶 Intelligent Signal Generation
Generates precise entry signals only when the composite oscillator crosses extreme thresholds with momentum confirmation. This dual-confirmation approach significantly reduces false signals while maintaining sensitivity to genuine mean reversion opportunities.
How It Works
🔶 Composite Score Calculation
The indicator simultaneously tracks five different oscillators, each normalized to a 0-100 scale, then combines them into a smoothed composite score. This approach eliminates the noise inherent in single-oscillator analysis while capturing the consensus view of multiple momentum indicators.
// Mean reversion entry signals
bullish_entry = ta.crossover(composite, 100 - extreme_level) and composite < (100 - extreme_level)
bearish_entry = ta.crossunder(composite, extreme_level) and composite > extreme_level
// Bollinger %B calculation
bb_basis = ta.sma(src, bb_length)
bb_dev = bb_mult * ta.stdev(src, bb_length)
bb_percent = (src - bb_lower) / (bb_upper - bb_lower) * 100
🔶 Extreme Zone Identification
The system automatically identifies when markets reach statistically significant extreme levels, both moderate (65/35) and extreme (80/20). These zones represent areas where mean reversion has the highest probability of success based on historical market behavior.
🔶 Momentum Histogram Analysis
A specialized momentum histogram tracks the velocity of oscillator changes, helping traders distinguish between healthy corrections and potential trend reversals. The histogram's color-coded display makes momentum shifts immediately apparent.
🔶 Divergence Detection Framework
Built-in divergence analysis identifies situations where price and oscillator movements diverge, often signaling impending reversals. Diamond-shaped markers highlight these critical divergence patterns for enhanced pattern recognition.
🔶 Real-Time Information Dashboard
An integrated information table provides instant access to current oscillator readings, market status, and individual component values. This dashboard eliminates the need to manually check multiple indicators while trading.
🔶 Individual Component Display
Optional display of individual oscillator components allows traders to understand which specific indicators are driving the composite signal. This transparency enables more informed decision-making and deeper market analysis.
🔶 Adaptive Background Coloring
Intelligent background shading automatically adjusts based on market conditions, creating visual zones that correspond to different levels of mean reversion potential. The subtle color gradations make pattern recognition effortless.
1D
3D
🔶 Comprehensive Alert System
Multi-tier alert system covers confirmed entry signals, divergence patterns, and extreme level breaches. Each alert type provides specific context about the detected condition, enabling traders to respond appropriately to different signal strengths.
🔶 Customizable Threshold Management
Fully adjustable extreme and moderate levels allow traders to fine-tune the indicator's sensitivity to match different market volatilities and trading timeframes. This flexibility ensures optimal performance across various market conditions.
🔶 Why Choose AE - Mean Reversion Oscillator?
This indicator provides the most comprehensive approach to mean reversion trading by combining multiple proven oscillators with advanced confirmation mechanisms. By offering clear visual hierarchies for different extreme levels and requiring momentum confirmation for signals, it empowers traders to identify high-probability contrarian opportunities while avoiding false reversals. The sophisticated composite methodology ensures that signals are both statistically significant and practically actionable, making it an essential tool for traders focused on mean reversion strategies across all market conditions.

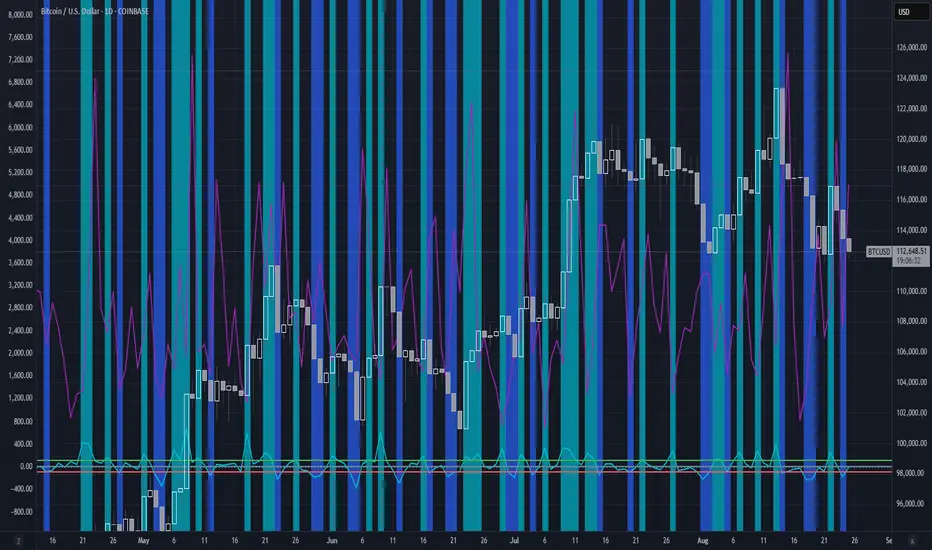
Volume Delta [BigBeluga]🔵 OVERVIEW
The Volume Delta indicator visualizes the dominance between buying and selling volume within a given period. It calculates the percentage of bullish (buy) versus bearish (sell) volume, then color-codes the candles and provides a real-time dashboard comparing delta values across multiple currency pairs. This makes it a powerful tool for monitoring order-flow strength and intermarket relationships in real time.
🔵 CONCEPTS
Each bar’s buy volume is counted when the close is higher than the open.
Each bar’s sell volume is counted when the close is lower than the open.
volumeBuy = 0.
volumeSell = 0.
for i = 0 to period
if close > open
volumeBuy += volume
else
volumeSell += volume
The indicator sums both over a chosen period to calculate the ratio of buy-to-sell pressure.
Delta (%) = (Buy Volume ÷ (Buy Volume + Sell Volume)) × 100.
Gradient colors highlight whether buying or selling pressure dominates.
🔵 FEATURES
Calculates real-time Volume Delta for the selected chart or for multiple assets.
Colors candles dynamically based on the delta intensity (green = buy pressure, red = sell pressure).
Displays a dashboard table showing volume delta % for up to five instruments.
The dashboard features visual progress bars for quick intermarket comparison.
An optional Delta Bar Panel shows the ratio of Buy/Sell volumes near the latest bar.
A floating label shows the exact Buy/Sell percentages.
Works across all symbols and timeframes for multi-asset delta tracking.
🔵 HOW TO USE
When Buy % > Sell % , it often signals bullish momentum or strong accumulation—but can also indicate over-excitement and a possible market top.
Market Tops
When Sell % > Buy % , it typically reflects bearish pressure or distribution—but may also occur near a market bottom where selling exhaustion forms.
Market Bottom
Use the Dashboard to compare volume flow across correlated assets (e.g., major Forex pairs or sector groups).
Combine readings with trend or volatility filters to confirm whether the imbalance aligns with broader directional conviction.
Treat the Delta Bar visualization as a real-time sentiment gauge—showing which side (buyers or sellers) dominates the current session.
🔵 CONCLUSION
Volume Delta transforms volume analysis into an intuitive directional signal.
By quantifying buy/sell pressure and displaying it as a percentage or color gradient, it provides traders with a clearer picture of real-time volume imbalance — whether within one market or across multiple correlated instruments.

Rebound Sigma Pro - IndicatorOverview
Rebound Sigma Pro is a mean-reversion indicator that detects statistically oversold conditions in trending markets.
It helps traders identify potential short-term rebounds based on momentum exhaustion and volatility-adjusted entry zones.
Concept
The indicator combines two quantitative components:
Short-term momentum to detect short-term exhaustion
Trend filter to ensure setups align with the long-term direction
When a stock in an uptrend becomes temporarily oversold, a limit-entry signal is plotted.
The trade is then tracked until short-term conditions normalize or a time-based exit occurs.
Visual Signals
Green Triangle: Suggests placing a limit order for the next session
Green Circle: Confirms entry was filled
Red Triangle: Signals an exit for the next session’s open
Orange Background: Pending order
Green Background: Position active
Red Background: Exit phase
Yellow Line: Entry reference price
User Inputs
Limit Entry (% below previous close) – Default 1 %
Use Limit Entry – Switch between limit or market entries
Enable Time Exit – Optional holding-period constraint
Maximum Holding Days
All other internal parameters (momentum length, filters) are pre-configured.
Alerts
Limit Order Signal: New setup detected
Entry Confirmed: Order filled
Exit Signal: Exit expected next day
Usage
Designed for liquid equities and ETFs
Works best in confirmed uptrends
Backtesting encouraged to adapt parameters per symbol and timeframe
Notes
Not an automated strategy; manual order execution required
Past behavior does not imply future performance
Always apply sound position sizing and risk management
Disclaimer
This indicator is provided for educational and analytical purposes only.
It does not constitute financial advice or performance assurance.

Smart Money Volume Activity [AlgoAlpha]🟠 OVERVIEW
This tool visualizes how Smart Money and Retail participants behave through lower-timeframe volume analysis. It detects volume spikes far beyond normal activity, classifies them as institutional or retail, and projects those zones as reactive levels. The script updates dynamically with each bar, showing when large players enter while tracking whether those events remain profitable. Each event is drawn as a horizontal line with bubble markers and summarized in a live P/L table comparing Smart Money versus Retail.
🟠 CONCEPTS
The core logic uses Z-score normalization on lower-timeframe volumes (like 5m inside a 1h chart). This lets the script detect statistically extreme bursts of buying or selling activity. It classifies each detected event as:
Smart Money — volume inside the candle body (suggesting hidden accumulation or distribution)
Retail — volume closing at bar extremes (suggesting chase entries or panic exits)
When new events appear, the script plots them as horizontal levels that persist until price interacts again. Each level acts as a potential reaction zone or liquidity footprint. The integrated P/L table then measures which class (Retail or Smart Money) is currently “winning” — comparing cumulative profitable versus losing volume.
🟠 FEATURES
Classifies flows into Smart Money or Retail based on candle-body context.
Displays live P/L comparison table for Smart vs Retail performance.
Alerts for each detected Smart or Retail buy/sell event.
🟠 USAGE
Setup : Add the script to any chart. Set Lower Timeframe Value (e.g., “5” for 5m) smaller than your main chart timeframe. The Period input controls how many bars are analyzed for the Z-score baseline. The Threshold (|Z|) decides how extreme a volume must be to plot a level.
Read the chart : Horizontal lines mark where heavy Smart or Retail volume occurred. Bright bubbles show the strongest events — their size reflects Z-score intensity. The on-chart table updates live: green cells show profitable flows, red cells show losing flows. A dominant green Smart Money row suggests institutions are currently controlling price.
See what others are doing :
Settings that matter : Raising Threshold (|Z|) filters noise, showing only large players. Increasing Period smooths results but reacts slower to new bursts. Use Show = “Both” for full comparison or isolate “Smart Money” / “Retail” to focus on one class.

Z-Score Trend Channels [BackQuant]Z-Score Trend Channels
A self-contained price-statistics framework that turns a rolling z-score into price channels, bias states, and trade markers. Run either trend-following or mean-reversion from the same tool with clear, on-chart context.
What it is
A rolling statistical map that measures how far price is from its recent average in standard-deviation units (z-score).
Adaptive channels drawn in price space from fixed z thresholds, so the rails breathe with volatility.
A simple trend proxy from z-score momentum to separate trending from ranging conditions.
On-chart signals for pullback entries, stretched extremes, and practical exits.
Core idea (plain English math)
Rolling mean and volatility - Over a lookback you get the average price and its standard deviation.
Z-score - How many standard deviations the current price is above or below its average: z = (price - mean) / stdev. z near 0 means near average; positive is above; negative is below.
Noise control - An EMA smooths the raw z to reduce jitter and false flickers.
Channels back in price - Fixed z levels are converted back to price to form the upper, lower, and extreme rails.
Trend proxy - A smoothed change in z is used as a lightweight trend-strength line. Positive strength with positive z favors uptrend; negative strength with negative z favors downtrend.
What you see on the chart
Channels and fills - Mean, upper, lower, and optional extreme lines. The area mean->upper tints with the bearish color, mean->lower tints with the bullish color.
Background tint (optional) - Soft green, red, or neutral based on detected trend state.
Signals - Bullish Entry (triangle up) when z exits the oversold zone upward; Bearish Entry (triangle down) when z exits the overbought zone downward; Extreme markers (diamonds) at the extreme bands with a one-bar turn.
Table - Current z, trend state, trend strength, distance to bands, market state tag, and a quick volatility regime label.
Edge labels - MEAN, OB, and OS labels slightly projected forward with level values.
Inputs you will actually use
Z-Score Period - Lookback for mean and stdev. Larger = slower and steadier rails, smaller = more reactive.
Smoothing Period - EMA on z. Lower = earlier but choppier flips; higher = later but cleaner.
Price Source - Default hlc3. Choose close if you prefer session-close logic.
Upper and Lower Thresholds - Default around +2.0 and -2.0. Tighten for more signals, widen for fewer and stronger.
Extreme Upper and Lower - Deeper stretch guards, e.g., +/- 2.5.
Strength Period - EMA on z momentum. Sets how fast the trend proxy flips.
Trend Threshold - Minimum absolute z to accept a directional bias.
Visual toggles - Channels, signals, background tint, stats table, colors, and optional last-bar trend label.
How to use it: trend-following playbook
Read the state - Uptrend when z > Trend Threshold and trend strength > 0. Downtrend when z < -Trend Threshold and trend strength < 0. Neutral otherwise.
Entries - In an uptrend, prefer Bullish Entry signals that fire near the lower channel. In a downtrend, prefer Bearish Entry signals that fire near the upper channel.
Stops - Conservative: beyond the extreme channel on your side. Tighter: just outside the standard band that framed the signal.
Exits - For longs, exit or trim on a cross back through z = 0 or a clean tag of the upper threshold. For shorts, mirror with z = 0 up-cross or tag of the lower threshold. You can also reduce if trend strength flips against you.
Adds - In strong trends, additional signals near your side’s band can be add points. Avoid adding once z hovers near the opposite band for several bars.
How to use it: mean-reversion playbook
Find stretch - Standard reversions: Bullish Entry when z leaves the oversold zone upward; Bearish Entry when z leaves the overbought zone downward. Aggressive reversions: Extreme markers at extreme bands with a one-bar turn.
Entries - Take the signal as price exits the zone. Prefer setups where trend strength is near zero or tilting against the prior push.
Targets - First target is the mean line. A runner can aim for the opposite standard channel if momentum keeps flipping.
Stops - Outside the extreme band beyond your entry. If fading without extremes, place risk just beyond the opposite standard band.
Filters - Optional: skip counter-trend fades against a very strong trend state unless your risk is tight and predefined.
Reading the stats table
Current Z-Score - Magnitude and sign of displacement now.
Trend State - Uptrend, Downtrend, or Ranging.
Trend Strength - Smoothed z momentum. Higher absolute values imply stronger directional conviction.
Distance to Upper/Lower - Percent distance from price to each band, useful for sizing targets or judging room left.
Market State - Overbought, Oversold, Extreme OB, Extreme OS, or Normal.
Volatility Regime - High, Normal, or Low relative to recent distribution. Expect bands to widen in High and tighten in Low.
Parameter guidance (conceptual)
Z-Score Period - Choose longer for a structural mean, shorter for a reactive mean.
Smoothing Period - Lower for earlier but noisier reads; higher for slower but steadier reads.
Thresholds - Start around +/- 2.0. Tighten for scalping or quiet ranges. Widen for noisy or fast markets.
Trend Threshold and Strength Period - Raise to avoid weak, transient bias. Lower to capture earlier regime shifts.
Practical examples
Trend pullback long - State shows Uptrend. Price tests the lower channel; z dips near or below the lower threshold; a Bullish Entry prints. Stop just below extreme lower; first target mean; keep a runner if trend strength stays positive.
Mean-revert short - State is Ranging. z tags the extreme upper, an Extreme Bearish marker prints, then a Bearish Entry prints on the leave. Stop above extreme upper; target the mean; consider a runner toward the lower channel if strength turns negative.
Potential Questions you might have
Why z-score instead of fixed offsets - Because the bands adapt with volatility. When the tape gets quiet the rails tighten, when it runs hot the rails expand. Your entries stay normalized.
Do I need both modes - No. Many users run only trend pullbacks or only mean-reversions. The tool lets you toggle what you need and keep the chart readable.
Multi-timeframe workflow - A common approach is to set bias from a higher timeframe’s trend state and execute on a lower timeframe’s signals that align with it.
Summary
Z-Score Trend Channels gives you an adaptive mean, volatility-aware rails, a simple trend lens, and clear signals. Trade the trend by buying pullbacks in green and selling pullbacks in red, or fade stretched extremes back to the mean with defined risk. One framework, two strategies, consistent logic.

Inversion Fair Value Gap Signals [AlgoAlpha]🟠 OVERVIEW
This script is a custom signal tool called Inversion Fair Value Gap Signals (IFVG) , designed to detect, track, and visualize fair value gaps (FVGs) and their inversions directly on price charts. It identifies bullish and bearish imbalances, monitors when these zones are mitigated or rejected, and extends them until resolution or expiration. What makes this script original is the inclusion of inversion logic—when a gap is filled, the area flips into an opposite "inversion fair value gap," creating potential reversal or continuation zones that give traders additional context beyond classic FVG analysis.
🟠 CONCEPTS
The script builds on the Smart Money Concepts (SMC) principle of fair value gaps, where inefficiencies form when price moves too quickly in one direction. Detection requires a three-bar sequence: a strong up or down move that leaves untraded price between bar highs and lows. To refine reliability, the script adds an ATR-based size filter and prevents overlap between zones. Once created, gaps are tracked in arrays until mitigation (price closing back into the gap), expiration, or transformation into an inversion zone. Inversions act as polarity flips, where bullish gaps become bearish resistance and bearish gaps become bullish support. Lower-timeframe volume data is also displayed inside zones to highlight whether buying or selling pressure dominated during gap creation.
🟠 FEATURES
Automatic detection of bullish and bearish FVGs with ATR-based thresholding.
Inversion logic: mitigated gaps flip into opposite-colored IFVG zones.
Volume text overlay inside each zone showing up vs down volume.
Visual markers (△/▽ for FVG, ▲/▼ for IFVG) when price exits a zone without mitigation.
🟠 USAGE
Apply the indicator to any chart and enable/disable bullish or bearish FVG detection depending on your focus. Use the colored gap zones as areas of interest: bullish gaps suggest possible continuation to the upside until mitigated, while bearish gaps suggest continuation down. When a gap flips into an inversion zone, treat it as potential support/resistance—bullish IFVGs below price may act as demand, while bearish IFVGs above price may act as supply. Watch the embedded up/down volume data to gauge the strength of participants during gap formation. Use the △/▽ and ▲/▼ markers to spot when price rejects gaps or inversions without filling them, which can indicate strong trending momentum. For practical use, combine alerts with your trade plan to track when new gaps form, when old ones are resolved, or when key zones flip into inversions, helping you align entries, targets, or reversals with institutional order flow logic.

Algorithmic Value Oscillator [CRYPTIK1]Algorithmic Value Oscillator
Introduction: What is the AVO? Welcome to the Algorithmic Value Oscillator (AVO), a powerful, modern momentum indicator that reframes the classic "overbought" and "oversold" concept. Instead of relying on a fixed lookback period like a standard RSI, the AVO measures the current price relative to a significant, higher-timeframe Value Zone .
This gives you a more contextual and structural understanding of price. The core question it answers is not just "Is the price moving up or down quickly?" but rather, " Where is the current price in relation to its recently established area of value? "
This allows traders to identify true "premium" (overbought) and "discount" (oversold) levels with greater accuracy, all presented with a clean, futuristic aesthetic designed for the modern trader.
The Core Concept: Price vs. Value The market is constantly trying to find equilibrium. The AVO is built on the principle that the high and low of a significant prior period (like the previous day or week) create a powerful area of perceived value.
The Value Zone: The range between the high and low of the selected higher timeframe.
Premium Territory (Distribution Zone): When the oscillator moves into the glowing pink/purple zone above +100, it is trading at a premium.
Discount Territory (Accumulation Zone): When the oscillator moves into the glowing teal/blue zone below -100, it is trading at a discount.
Key Features
1. Glowing Gradient Oscillator: The main oscillator line is a dynamic visual guide to momentum.
The line changes color smoothly from light blue to neon teal as bullish momentum increases.
It shifts from hot pink to bright purple as bearish momentum increases.
Multiple transparent layers create a professional "glow" effect, making the trend easy to see at a glance.
2. Dynamic Volatility Histogram: This histogram at the bottom of the indicator is a custom volatility meter. It has been engineered to be adaptive, ensuring that the visual differences between high and low volatility are always clear and dramatic, no matter your zoom level. It uses a multi-color gradient to visualize the intensity of market volatility.
3. Volatility Regime Dashboard: This simple on-screen table analyzes the histogram and provides a clear, one-word summary of the current market state: Compressing, Stable, or Expanding.
How to Use the AVO: Trading Strategies
1. Reversion Trading This is the most direct way to use the indicator.
Look for Buys: When the AVO line drops into the teal "Accumulation Zone" (below -100), the price is trading at a discount. Watch for the oscillator to form a bottom and start turning up as a signal that buying pressure is returning.
Look for Sells: When the AVO line moves into the pink "Distribution Zone" (above +100), the price is trading at a premium. Watch for the oscillator to form a peak and start turning down as a signal that selling pressure is increasing.
2. Best Practices & Settings
Timeframe Synergy: The AVO is most effective when your chart timeframe is lower than your selected "Value Zone Source." For example, if you trade on the 1-hour chart, set your Value Zone to "Previous Day."
Confirmation is Key: This indicator provides powerful context, but it should not be used in isolation. Always combine its readings with your primary analysis, such as market structure and support/resistance levels.

Momentum Shift Oscillator (MSO) [SharpStrat]Momentum Shift Oscillator (MSO)
The Momentum Shift Oscillator (MSO) is a custom-built oscillator that combines the best parts of RSI, ROC, and MACD into one clean, powerful indicator. Its goal is to identify when momentum shifts are happening in the market, filtering out noise that a single momentum tool might miss.
Why MSO?
Most traders rely on just one momentum indicator like RSI, MACD, or ROC. Each has strengths, but also weaknesses:
RSI → great for overbought/oversold, but often lags in strong trends.
ROC (Rate of Change) → captures price velocity, but can be too noisy.
MACD Histogram → shows trend strength shifts, but reacts slowly at times.
By blending all three (with adjustable weights), MSO gives a balanced view of momentum. It captures trend strength, velocity, and exhaustion in one oscillator.
How MSO Works
Inputs:
RSI, ROC, and MACD Histogram are calculated with user-defined lengths.
Each is normalized (so they share the same scale of -100 to +100).
You can set weights for RSI, ROC, and MACD to emphasize different components.
The components are blended into a single oscillator value.
Smoothing (SMA, EMA, or WMA) is applied.
MSO plots as a smooth line, color-coded by slope (green rising, red falling).
Overbought and oversold levels are plotted (default: +60 / -60).
A zero line helps identify bullish vs bearish momentum shifts.
How to trade with MSO
Zero line crossovers → crossing above zero suggests bullish momentum; crossing below zero suggests bearish momentum.
Overbought and oversold zones → values above +60 may indicate exhaustion in bullish moves; values below -60 may signal exhaustion in bearish moves.
Slope of the line → a rising line shows strengthening momentum, while a falling line signals fading momentum.
Divergences → if price makes new highs or lows but MSO does not, it can point to a possible reversal.
Why MSO is Unique
Combines trend + momentum + velocity into one view.
Filters noise better than standalone RSI/MACD.
Adapts to both trend-following and mean-reversion styles.
Can be used across any timeframe for confirmation.

Mean Reversion Probability Zones [BigBeluga]🔵 OVERVIEW
The Mean Reversion Probability Zones indicator measures the likelihood of price reverting back toward its mean . By analyzing oscillator dynamics (RSI, MFI, or Stochastic), it calculates probability zones both above and below the oscillator. These zones are visualized as histograms, colored regions on the main chart, and a compact dashboard, helping traders spot when the market is statistically stretched and more likely to revert.
🔵 CONCEPTS
Mean Reversion : The tendency of price to return to its average after significant extensions.
Oscillator-Based Analysis : Uses RSI, MFI, or Stochastic as the base signal for detecting overextension.
Probability Model : The probability of reversion is computed using three factors:
Whether the oscillator is rising or declining.
Whether the oscillator is above or below user-defined thresholds.
The oscillator’s actual value (distance from equilibrium).
Dual-Zone Output :
Upper histogram = probability of downward mean reversion.
Lower histogram = probability of upward mean reversion.
Historical Extremes : The dashboard highlights the recent maximum probability values for both upward and downward scenarios.
🔵 FEATURES
Oscillator Choice : Switch between RSI, MFI, and Stochastic.
Customizable Zones : User-defined upper/lower thresholds with independent colors.
Probability Histograms :
Above oscillator → down reversion probability.
Below oscillator → up reversion probability.
Colored Gradient Zones on Chart : Visual overlays showing where mean reversion probabilities are strongest.
Probability Labels : Percentages displayed next to histogram values for clarity.
Dashboard : Compact table in the corner showing the recent maximum probabilities for both upward and downward mean reversion.
Overlay Compatibility : Works in both chart pane and sub-pane with oscillators.
🔵 HOW TO USE
Set Oscillator : Choose RSI, MFI, or Stochastic depending on your strategy style.
Adjust Zones : Define upper/lower bounds for when oscillator values indicate strong overbought/oversold conditions.
Interpret Histograms :
Orange (upper) histogram → higher chance of a pullback/downward mean reversion.
Green (lower) histogram → higher chance of upward reversion/bounce.
Watch Gradient Zones : On the main chart, shaded areas highlight where probability of mean reversion is elevated.
Consult Dashboard : Use the “Recent MAX” values to understand how strong recent reversion probabilities have been in either direction.
Confluence Strategy : Combine with support/resistance, order flow, or trend filters to avoid counter-trend trades.
🔵 CONCLUSION
The Mean Reversion Probability Zones provides traders with an advanced way to quantify and visualize mean reversion opportunities. By blending oscillator momentum, threshold logic, and probability calculations, it highlights when markets are statistically stretched and primed for reversal. Whether you are a contrarian trader or simply looking for exhaustion signals to fade, this tool helps bring structure and clarity to mean reversion setups.

FSVZO [Alpha Extract]A sophisticated volume-weighted momentum oscillator that combines Fourier smoothing with Volume Zone Oscillator methodology to deliver institutional-grade flow analysis and divergence detection. Utilizing advanced statistical filtering including ADF trend analysis and multi-dimensional volume dynamics, this indicator provides comprehensive market sentiment assessment through volume-price relationships with extreme zone detection and intelligent divergence recognition for high-probability reversal and continuation signals.
🔶 Advanced VZO Calculation Engine
Implements enhanced Volume Zone Oscillator methodology using relative volume analysis combined with smoothed price changes to create momentum-weighted oscillator values. The system applies exponential smoothing to both volume and price components before calculating positive and negative momentum ratios with trend factor integration for market regime awareness.
🔶 Fourier-Based Smoothing Architecture
Features advanced Fourier approximation smoothing using cosine-weighted calculations to reduce noise while preserving signal integrity. The system applies configurable Fourier length parameters with weighted sum normalization for optimal signal clarity across varying market conditions with enhanced responsiveness to genuine trend changes.
// Fourier Smoothing Algorithm
fourier_smooth(src, length) =>
sum = 0
weightSum = 0
for i = 0 to length - 1
weight = cos(2 * π * i / length)
sum += src * weight
weightSum += weight
sum / weightSum
🔶 Intelligent Divergence Detection System
Implements comprehensive divergence analysis using pivot point methodology with configurable lookback periods for both standard and hidden divergence patterns. The system validates divergence conditions through range analysis and provides visual confirmation through plot lines, labels, and color-coded identification for precise timing analysis.
15MIN
4H
12H
🔶 Flow Momentum Analysis Framework
Calculates flow momentum by measuring oscillator deviation from its exponential moving average, providing secondary confirmation of volume flow dynamics. The system creates momentum-based fills and visual indicators that complement the primary oscillator analysis for comprehensive market flow assessment.
🔶 Extreme Zone Detection Engine
Features sophisticated extreme zone identification at ±98 levels with specialized marker system including white X markers for signals occurring in extreme territory and directional triangles for potential reversal points. The system provides clear visual feedback for overbought/oversold conditions with institutional-level threshold accuracy.
🔶 Dynamic Visual Architecture
Provides advanced visualization engine with bullish/bearish color transitions, dynamic fill regions between oscillator and signal lines, and flow momentum overlay with configurable transparency levels. The system includes flip markers aligned to color junction points for precise signal timing with optional bar close confirmation to prevent repainting.
🔶 ADF Trend Filtering Integration
Incorporates Augmented Dickey-Fuller inspired trend filtering using normalized price statistics to enhance signal quality during trending versus ranging market conditions. The system calculates trend factors based on mean deviation and standard deviation analysis for improved oscillator accuracy across market regimes.
🔶 Comprehensive Alert System
Features intelligent multi-tier alert framework covering bullish/bearish flow detection, extreme zone reversals, and divergence confirmations with customizable message templates. The system provides real-time notifications for critical volume flow changes and structural market shifts with exchange and ticker integration.
🔶 Performance Optimization Framework
Utilizes efficient calculation methods with optimized variable management and configurable smoothing parameters to balance signal quality with computational efficiency. The system includes automatic pivot validation and range checking for consistent performance across extended analysis periods with minimal resource usage.
This indicator delivers sophisticated volume-weighted momentum analysis through advanced Fourier smoothing and comprehensive divergence detection capabilities. Unlike traditional volume oscillators that focus solely on volume patterns, the FSVZO integrates volume dynamics with price momentum and statistical trend filtering to provide institutional-grade flow analysis. The system's combination of extreme zone detection, intelligent divergence recognition, and multi-dimensional visual feedback makes it essential for traders seeking systematic approaches to volume-based market analysis across cryptocurrency, forex, and equity markets with clearly defined reversal and continuation signals.

Volatility Cone Forecaster Lite [PhenLabs]📊 Volatility Cone Forecaster
Version: PineScript™v6
📌Description
The Volatility Cone Forecaster (VCF) is an advanced indicator designed to provide traders with a forward-looking perspective on market volatility. Instead of merely measuring past price fluctuations, the VCF analyzes historical volatility data to project a statistical “cone” that outlines a probable range for future price movements. Its core purpose is to contextualize the current market environment, helping traders to anticipate potential shifts from low to high volatility periods (and vice versa). By identifying whether volatility is expanding or contracting relative to historical norms, it solves the critical problem of preparing for significant market moves before they happen, offering a clear statistical edge in strategy development.
This indicator moves beyond lagging measures by employing percentile analysis to rank the current volatility state. This allows traders to understand not just what volatility is, but how significant it is compared to the recent past. The VCF is built for discretionary traders, system developers, and options strategists who need a sophisticated understanding of market dynamics to manage risk and identify high-probability opportunities.
🚀Points of Innovation
Forward-Looking Volatility Projection: Unlike standard indicators that only show historical data, the VCF projects a statistical cone of future volatility.
Percentile-Based Regime Analysis: Ranks current volatility against historical data (e.g., 90th, 75th percentiles) to provide objective context.
Automated Regime Detection: Automatically identifies and labels the market as being in a ‘High’, ‘Low’, or ‘Normal’ volatility regime.
Expansion & Contraction Signals: Clearly indicates whether volatility is currently increasing or decreasing, signaling shifts in market energy.
Integrated ATR Comparison: Plots an ATR-equivalent volatility measure to offer a familiar point of reference against the statistical model.
Dynamic Visual Modeling: The cone visualization directly on the price chart provides an intuitive guide for future expected price ranges.
🔧Core Components
Realized Volatility Engine: Calculates historical volatility using log returns over multiple user-defined lookback periods (short, medium, long) for a comprehensive view.
Percentile Analysis Module: A custom function calculates the 10th, 25th, 50th, 75th, and 90th percentiles of volatility over a long-term lookback (e.g., 252 days).
Forward Projection Calculator: Uses the calculated volatility percentiles to mathematically derive and draw the upper and lower bounds of the future volatility cone.
Volatility Regime Classifier: A logic-based system that compares current volatility to the historical percentile bands to classify the market state.
🔥Key Features
Customizable Lookback Periods: Adjust short, medium, and long-term lookbacks to fine-tune the indicator’s sensitivity to different market cycles.
Configurable Forward Projection: Set the number of days for the forward cone projection to align with your specific trading horizon.
Interactive Display Options: Toggle visibility for percentile labels, ATR levels, and regime coloring to customize the chart display.
Data-Rich Information Table: A clean, on-screen table displays all key metrics, including current volatility, percentile rank, regime, and trend.
Built-in Alert Conditions: Set alerts for critical events like volatility crossing the 90th percentile, dropping below the 10th, or switching between expansion and contraction.
🎨Visualization
Volatility Cone: Shaded bands projected onto the future price axis, representing the probable price range at different statistical confidence levels (e.g., 75th-90th percentile).
Color-Coded Volatility Line: The primary volatility plot dynamically changes color (e.g., red for high, green for low) to reflect the current volatility regime, providing instant context.
Historical Percentile Bands: Horizontal lines plotted across the indicator pane mark the key percentile levels, showing how current volatility compares to the past.
On-Chart Labels: Clear labels automatically display the current volatility reading, its percentile rank, the detected regime, and trend (Expanding/Contracting).
📖Usage Guidelines
Setting Categories
Short-term Lookback: Default: 10, Range: 5-50. Controls the most sensitive volatility calculation.
Medium-term Lookback: Default: 21, Range: 10-100. The primary input for the current volatility reading.
Long-term Lookback: Default: 63, Range: 30-252. Provides a baseline for long-term market character.
Percentile Lookback Period: Default: 252, Range: 100-1000. Defines the period for historical ranking; 252 represents one trading year.
Forward Projection Days: Default: 21, Range: 5-63. Determines how many bars into the future the cone is projected.
✅Best Use Cases
Breakout Trading: Identify periods of deep consolidation when volatility falls to low percentile ranks (e.g., below 25th) and begins to expand, signaling a potential breakout.
Mean Reversion Strategies: Target trades when volatility reaches extreme high percentile ranks (e.g., above 90th), as these periods are often unsustainable and lead to contraction.
Options Strategy: Use the cone’s projected upper and lower bounds to help select strike prices for strategies like iron condors or straddles.
Risk Management: Widen stop-losses and reduce position sizes when the indicator signals a transition into a ‘High’ volatility regime.
⚠️Limitations
Probabilistic, Not Predictive: The cone represents a statistical probability, not a guarantee of future price action. Extreme, unpredictable news events can drive prices outside the cone.
Lagging by Nature: All calculations are based on historical price data, meaning the indicator will always react to, not pre-empt, market changes.
Non-Directional: The indicator forecasts the *magnitude* of future moves, not the *direction*. It should be paired with a directional analysis tool.
💡What Makes This Unique
Forward Projection: Its primary distinction is projecting a data-driven, statistical forecast of future volatility, which standard oscillators do not do.
Contextual Analysis: It doesn’t just provide a number; it tells you what that number means through percentile ranking and automated regime classification.
🔬How It Works
1. Data Calculation:
The indicator first calculates the logarithmic returns of the asset’s price. It then computes the annualized standard deviation of these returns over short, medium, and long-term lookback periods to generate realized volatility readings.
2. Percentile Ranking:
Using a 252-day lookback, it analyzes the history of the medium-term volatility and determines the values that correspond to the 10th, 25th, 50th, 75th, and 90th percentiles. This builds a statistical map of the asset’s volatility behavior.
3. Cone Projection:
Finally, it takes these historical percentile values and projects them forward in time, calculating the potential upper and lower price bounds based on what would happen if volatility were to run at those levels over the next 21 days.
💡Note:
The Volatility Cone Forecaster is most effective on daily and weekly charts where statistical volatility models are more reliable. For lower timeframes, consider shortening the lookback periods. Always use this indicator as part of a comprehensive trading plan that includes other forms of analysis.

High Probability Order Blocks [AlgoAlpha]🟠 OVERVIEW
This script detects and visualizes high-probability order blocks by combining a volatility-based z-score trigger with a statistical survival model inspired by Kaplan-Meier estimation. It builds and manages bullish and bearish order blocks dynamically on the chart, displays live survival probabilities per block, and plots optional rejection signals. What makes this tool unique is its use of historical mitigation behavior to estimate and plot how likely each zone is to persist, offering traders a probabilistic perspective on order block strength—something rarely seen in retail indicators.
🟠 CONCEPTS
Order blocks are regions of strong institutional interest, often marked by large imbalances between buying and selling. This script identifies those areas using z-score thresholds on directional distance (up or down candles), detecting statistically significant moves that signal potential smart money footprints. A bullish block is drawn when a strong up-move (zUp > 4) follows a down candle, and vice versa for bearish blocks. Over time, each block is evaluated: if price “mitigates” it (i.e., closes cleanly past the opposite side and confirmed with a 1 bar delay), it’s considered resolved and logged. These resolved blocks then inform a Kaplan-Meier-like survival curve, estimating the likelihood that future blocks of a given age will remain unbroken. The indicator then draws a probability curve for each side (bull/bear), updating it in real time.
🟠 FEATURES
Live label inside each block showing survival probability or “N.E.D.” if insufficient data.
Kaplan-Meier survival curves drawn directly on the chart to show estimated strength decay.
Rejection markers (▲ ▼) if price bounces cleanly off an active order block.
Alerts for zone creation and rejection signals, supporting rule-based trading workflows.
🟠 USAGE
Read the label inside each block for Age | Survival% (or N.E.D. if there aren’t enough samples yet); higher survival % suggests blocks of that age have historically lasted longer.
Use the right-side survival curves to gauge how probability decays with age for bull vs bear blocks, and align entries with the side showing stronger survival at current age.
Treat ▲ (bullish rejection) and ▼ (bearish rejection) as optional confluence when price tests a boundary and fails to break.
Turn on alerts for “Bullish Zone Created,” “Bearish Zone Created,” and rejection signals so you don’t need to watch constantly.
If your chart gets crowded, enable Prevent Overlap ; tune Max Box Age to your timeframe; and adjust KM Training Window / Minimum Samples to trade off responsiveness vs stability.

Long-Term Trend & Valuation Model [Backquant]Long-Term Trend & Valuation Model
Invite-only. A universal long-term valuation strategy and trend model built to work across markets, with an emphasis on crypto where cycles and volatility are large. Intended primarily for the 1D timeframe. Inputs should be adjusted per asset to reflect its structure and volatility.
If you would like to checkout the simplified and open source valuation, check out:
What this is
A two-layer framework that answers two different questions.
• The Valuation Engine asks “how extended is price relative to its own long-term regime” and outputs a centered oscillator that moves positive in supportive conditions and negative in deteriorating conditions.
• The Trend Model asks “is the market actually trending in a sustained direction” and converts several independent subsystems into a single composite score.
The combination lets you separate “where we are in the cycle” from “what to do about it” so allocation and timing can be handled with fewer conflicts.
Design philosophy
Crypto and many risk assets move in multi-month expansions and contractions. Short tools flip often and can be misleading near regime boundaries. This model favors slower, high-confidence information, then summarizes it in simple visuals and alerts. It is not trying to catch every swing. It is built to help you participate in the meat of long uptrends, de-risk during deteriorations, and identify stretched conditions that deserve caution or patience.
Valuation Engine, high level
The Valuation Engine blends several slow signals into one measure. Exact transforms, windows, and weights are private, but the categories below describe the intent. Each input is standardized so unlike units can be combined without one dominating.
Momentum quality — favors persistent, orderly advances over erratic spikes. Helps distinguish trend continuation from noise.
Mean-reversion pressure — detects when price is far from a long anchor or when oscillators are pulling back toward equilibrium.
Risk-adjusted return — long-window reward to variability. Encourages time in market when advances are efficient rather than merely fast.
Volume imbalance — summarizes whether activity is expanding with advances or with declines, using a slow envelope to avoid day-to-day churn.
Trend distance — expresses how stretched price is from a structural baseline rather than from a short moving average.
Price normalization — a long z-score of price to keep extremes comparable across cycles and symbols.
How the Valuation Engine is shaped
Standardization — components are put on comparable scales over long windows.
Composite blend — standardized parts are combined into one reading with protective weighting. No single family can override the rest on its own.
Smoothing — optional moving average smoothing to reduce whipsaw around zero or around the bands.
Bounded scaling — the composite is compressed into a stable, interpretable range so the mid zone and extremes are visually consistent. This reduces the effect of outliers without hiding genuine stress.
Volatility-aware re-expansion — after compression, the series is allowed to swing wider in high-volatility regimes so “overbought” and “oversold” remain meaningful when conditions change.
Thresholds — fixed OB/OS levels or dynamic bands that float with recent dispersion. Dynamic bands use k times a rolling standard deviation. Fixed bands are simple and comparable across charts.
How to read the Valuation Oscillator
Above zero suggests a supportive backdrop. Rising and positive often aligns with uptrends that are gaining participation.
Below zero suggests deterioration or risk aversion. Falling and negative often aligns with distribution or with trend exhaustion.
Touches of the upper band show stretch on the optimistic side. Repeated tags without breakdown often occur late in cycles, especially in crypto.
Touches of the lower band show stretch on the pessimistic side. They are common in washouts and early bases.
Visual elements
Valuation Oscillator — colored by sign for instant context.
OB/OS guides — fixed or dynamic bands.
Background and bar colors — optional, tied to the sign of valuation for quick scans.
Summary table — optional, shows the standardized contribution of the major categories and the final composite score with a simple status icon.
Trend Model, composite scoring
The trend side aggregates several independent subsystems. Each subsystem issues a vote: long, short, or neutral. Votes are averaged into a composite score. The exact logic of each subsystem is intentionally abstracted. The families below describe roles, not formulas.
Long-horizon price state — checks where price sits relative to multiple structural baselines and whether those baselines are aligned.
Macro regime checks — favors sustained risk-on behavior and penalizes persistent deterioration in breadth or volatility structure.
Ultimate confirmation — a conservative filter that only votes when directional evidence is persistent.
Minimalist sanity checks — keep the model responsive to obvious extremes and prevent “stuck neutral” states.
Higher timeframe or overlay inputs — optional votes that consider slower contexts or relative strength to stabilize borderline periods.
You define two cutoffs for the composite: above the long threshold the state is Long , below the short threshold the state is Short , in between is Cash/Neutral . The script paints a signal line on price for an at-a-glance view and provides alerts when the composite crosses your thresholds.
How it can be used
Cycle framing in crypto — use deep negative valuation as accumulation context, then look for the composite trend to move through your long threshold. Late in cycles, extended positive valuation with weakening composite votes is a caution cue for de-risking or tighter management.
Regime-based allocation — increase risk or loosen take-profits when the composite is firmly Long and valuation is rising. Decrease risk or rotate to stable holdings when the composite is Short and valuation is falling.
Signal gating — run shorter-term entry systems only in the direction of the composite. This reduces counter-trend trades and improves holding discipline during strong uptrends.
Sizing overlay — scale position sizes by the magnitude of the valuation reading. Smaller sizes near the upper band during aging advances, larger sizes near zero after strong resets.
DCA context — for long-only accumulation, schedule heavier adds when valuation is negative and stabilizing, then lighten or pause adds when valuation is very positive and flattening.
Cross-asset rotation — compare symbols on 1D with the same fixed bands. Favor assets with positive valuation that are also in a Long composite state.
Interpreting common patterns
Early build-out — valuation rises from below zero, but the composite is still neutral. This is often the base-building phase. Patience and staged entries can make sense.
Healthy advance — valuation positive and trending up, composite firmly Long. Pullbacks that keep valuation above zero are usually opportunities rather than trend breaks.
Late-cycle stretch — valuation pinned near the upper band while the composite starts to weaken toward neutral. Consider trimming, tightening risk, or shifting to a “let the market prove it” stance.
Distribution and unwind — valuation negative and falling, composite Short. Rallies are treated as counter-trend until both turn.
Settings that matter
Timeframe
This model is intended for 1D as the primary view. It can be inspected on higher or lower frames, but the design choices assume daily bars for crypto and other risk assets.
Asset-specific tuning
Inputs should be adjusted per asset. Coins with high variability benefit from longer lookbacks and slightly wider dynamic bands. Lower-volatility instruments can use shorter windows and tighter bands.
Valuation side
Lookback lengths — longer values make the oscillator steadier and more cycle-aware. Shorter values increase sensitivity but create more mid-zone noise.
Smoothing — enable to reduce flicker around zero and around the bands. Disable if you want faster warnings of regime change.
Dynamic vs fixed thresholds — dynamic bands float with recent dispersion and keep OB/OS comparable across regimes. Fixed bands are simple and make inter-asset comparison easy.
Scaling and re-expansion — keep this enabled if you want extremes to remain interpretable when volatility rises.
Trend side
Composite thresholds — widen the neutral zone if you want fewer flips. Tighten thresholds if you want earlier signals at the cost of more transitions.
Visibility — use the price-pane signal line and bar coloring to keep the regime in view while you focus on structure.
Alerts
Valuation OB/OS enter and exit — the oscillator entering or leaving stretched zones.
Zero-line crosses — valuation turning positive or negative.
Trend flips — composite crossing your long or short threshold.
Strengths
Separates “valuation context” from “trend state,” which improves decisions about when to add, reduce, or stand aside.
Composite voting reduces reliance on any single indicator family and improves robustness across regimes.
Volatility-aware scaling keeps signals interpretable during quiet and wild markets.
Clear, configurable visuals and alerts that support long-horizon discipline rather than frequent toggling.
Final thoughts
This is a universal long-term valuation strategy and trend model that aims to keep you aligned with the dominant regime while giving transparent context for stretch and risk. For crypto on 1D, it helps map accumulation, expansion, distribution, and unwind phases with a single, consistent language. Tune lookbacks, smoothing, and thresholds to the asset you trade, let the valuation side tell you where you are in the cycle, and let the composite trend side tell you what stance to hold until the market meaningfully changes.

Momentum Index [BigBeluga]The Momentum Index is an innovative indicator designed to measure the momentum of price action by analyzing the distribution of positive and negative momentum values over a defined period. By incorporating delta-based calculations and smoothing techniques, it provides traders with a clear and actionable representation of market momentum dynamics.
🔵 Key Features:
Delta-Based Momentum Analysis:
Calculates the momentum of price by comparing its current state to its value from a defined number of bars back.
Inside a loop, it evaluates whether momentum values are above or below zero, producing a delta value that reflects the net momentum direction and intensity.
Double EMA Smoothing:
Smooths the raw delta-based momentum values with a double EMA filter, reducing noise and providing a clearer trend signal.
tmi(len) =>
sum = 0.0
sum1 = 0.0
above = 0.0
below = 0.0
src_ = src - src
for i = 0 to len
sum := sum + (src_ > nz(src_ ) ? 1 : -1)
sum1 := sum1 + (sum > 0 ? 1 : -1)
sum1 := emaEma(sum1, 10)
for i = 1 to len
above := above + (sum1 > 0 ? 1 : 0)
below := below + (sum1 > 0 ? 0 : 1)
Directional Momentum Signals:
Generates momentum shift signals and displays them on both the oscillator and the main chart:
- △ Aqua Triangles: Represent upward momentum shifts.
- ▽ Red Triangles: Represent downward momentum shifts.
Dynamic Gradient Display:
Highlights momentum zones with gradient fills:
- Aqua shades for positive momentum (above zero).
- Red shades for negative momentum (below zero).
Dashboard Display:
A dashboard summarizing the count of momentum values above and below zero for the defined period (Sentiment Length e.g. 100), helping traders assess market sentiment at a glance.
🔵 How It Works:
The indicator takes price momentum as its source and evaluates the number of momentum values above and below zero within a defined period.
The delta calculation aggregates this information, providing a net representation of the prevailing market momentum.
A double EMA filter is applied to the delta values, smoothing the momentum line and enhancing signal clarity.
Momentum shifts are highlighted with visual signals on the oscillator and price chart, while the gradient display provides a visual representation of intensity.
🔵 Use Cases:
Momentum Tracking: Identify whether market momentum is predominantly bullish or bearish.
Signal Confirmation: Use chart-based signals to confirm potential trend reversals or continuation.
Analyze Market Strength: Leverage the dashboard to quickly assess the distribution of momentum over the chosen period.
Overbought/Oversold Conditions: Utilize gradient zones to detect areas of momentum extremes and possible price exhaustion.
Momentum Index offers a refined approach to analyzing momentum dynamics, combining delta-based calculations with smoothing techniques and intuitive visuals, making it an essential tool for traders looking to anticipate market movements effectively.

CandelaCharts - Mean Reversion Oscillator 📝 Overview
The Mean Reversion Oscillator (MRO) is a bounded 0–100 indicator that shows how far the price has deviated from its statistical mean. Normalizing deviations into a consistent scale helps traders spot overbought/oversold conditions, potential mean reversion setups, and momentum shifts around a moving average.
📦 Features
Bounded scale (0–100) for easy recognition of stretched conditions.
Customizable MA & StdDev periods for different trading horizons.
Dynamic coloring: Red = Overbought, Green = Oversold, Blue = Neutral
Visual aids: Background shading in OB/OS zones + 50 midline.
⚙️ Settings
MA Length – Period for the moving average baseline.
StdDev Length – Standard deviation window. Tip: match the MA length for smoother results.
Overbought Level – Threshold for stretched highs.
Oversold Level – Threshold for stretched lows.
⚡️ Showcase
Overbought/Oversold Zones
Divergences
📒 Usage
The Mean Reversion Oscillator (MRO) is best used as a context tool, not as a standalone buy/sell signal generator. Its primary purpose is to tell you when the price is statistically stretched relative to its average, so you can anticipate a potential return toward the mean.
Add to chart – Paste the script in TradingView and load it in a separate pane.
Set MA Length – Use 20–50 for intraday, 100–200 for swing/position trading.
Match StdDev Length – Keep it close to the MA Length to avoid distortion (e.g., MA 200 → StdDev 200).
Interpret readings:
>70 (Overbought) – Price stretched high, reversion or slowdown likely.
<30 (Oversold) – Price stretched low, bounce potential.
50 (Midline) – Neutral, momentum shift point.
Use with confluence – Strongest signals occur when MRO extremes align with S/R levels, trend filters, or volume cues.
Adjust thresholds – 70/30 is balanced; 80/20 gives fewer but stronger signals, 60/40 gives more but weaker ones.
Stay trend-aware – In strong trends, OB/OS can persist. Always check higher timeframe bias before fading moves.
🚨 Alerts
The indicator does not provide any alerts!
⚠️ Disclaimer
These tools are exclusively available on the TradingView platform.
Our charting tools are intended solely for informational and educational purposes and should not be regarded as financial, investment, or trading advice. They are not designed to predict market movements or offer specific recommendations. Users should be aware that past performance is not indicative of future results and should not rely on these tools for financial decisions. By using these charting tools, the purchaser agrees that the seller and creator hold no responsibility for any decisions made based on information provided by the tools. The purchaser assumes full responsibility and liability for any actions taken and their consequences, including potential financial losses or investment outcomes that may result from the use of these products.
By purchasing, the customer acknowledges and accepts that neither the seller nor the creator is liable for any undesired outcomes stemming from the development, sale, or use of these products. Additionally, the purchaser agrees to indemnify the seller from any liability. If invited through the Friends and Family Program, the purchaser understands that any provided discount code applies only to the initial purchase of Candela's subscription. The purchaser is responsible for canceling or requesting cancellation of their subscription if they choose not to continue at the full retail price. In the event the purchaser no longer wishes to use the products, they must unsubscribe from the membership service, if applicable.
We do not offer reimbursements, refunds, or chargebacks. Once these Terms are accepted at the time of purchase, no reimbursements, refunds, or chargebacks will be issued under any circumstances.
By continuing to use these charting tools, the user confirms their understanding and acceptance of these Terms as outlined in this disclaimer.
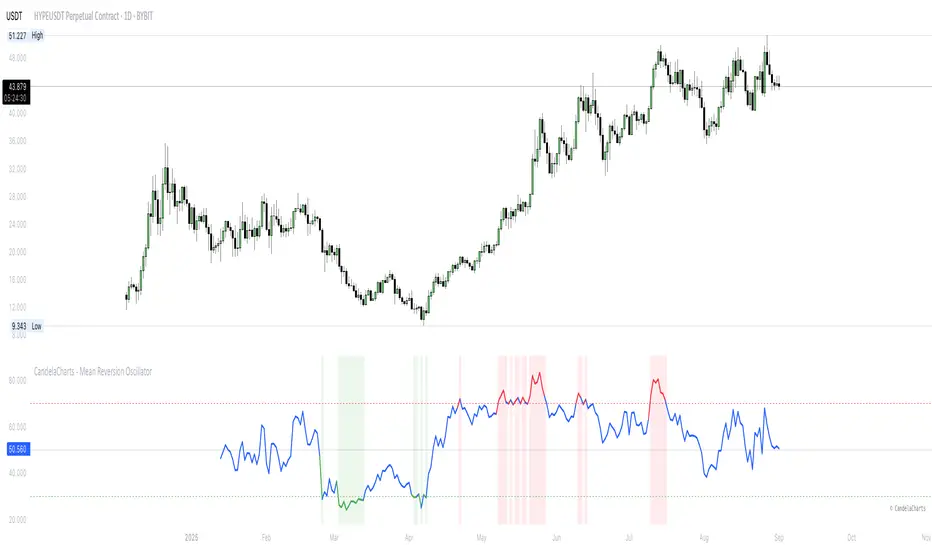
Peak Reversal v3# Peak Reversal v3
## Summary
Peak Reversal v3 adds new configurability, clearer visuals, and a faster trader workflow. The release introduces a new Squeeze Detector , expanded Keltner Channels , and streamlined Momentum signals , with no repaints and improved performance. The menus have been reorganized and simplified. Color swatches have been added for better customization. All other colors will be derived from these swatches.
## Highlights
New Squeeze Detector to mark low-volatility periods and prepare for breakouts.
New: Bands are now fully configurable with independent MA length, ATR length, and multipliers.
Five moving average bases for bands: EMA (from v2), SMA, RMA, VMA, HMA.
Simplified color system: three swatches drive candles, on-chart marks, and band fill.
Reorganized menu with focused sections and tooltips for each parameter making the entire trader experience more intuitive.
No repaints and faster performance across calculations.
## Overview
Configuration : Pick from three color swatches and apply them to candles, plotted characters, and band fill for consistent chart context. Use the reorganized menu to reach Keltner settings, momentum signals, and squeeze detection without extra clicks; tooltips clarify each input.
Bands and averages: Choose the band basis from EMA, SMA, RMA, VMA, or HMA to match your strategy. Configure two bands independently by setting MA length, ATR length, and band multipliers for the inner and outer envelopes.
Signals : Select the band responsible for momentum signals. Choose wick or close as the price source for entries and exits. Control the window for extreme momentum with “Max Momentum Bars,” a setting now exposed in v3 for direct tuning.
Squeeze detection : The Squeeze Detector normalizes band width and uses percentile ranking to highlight volatility compression. When the market falls below a user-defined threshold, the indicator colors the region with a gradient to signal potential expansion.
## Details about major features and changes
### New
Squeeze Detector to highlight low-volatility conditions.
Five MA bases for bands: EMA, SMA, RMA, VMA, HMA.
“Max Momentum Bars” to cap the bars used for extreme momentum.
### Keltner channel improvements
Refactored Keltner settings for flexible inner and outer band control.
MA type selection added; band calculations updated for consistency.
Removed the third Keltner band to reduce noise and simplify setup.
### Display and signals
Gradient fills for band breakouts, mean deviations, and squeeze periods.
“Show Mean EMA?” set to true and default “Signal Band” set to “Inner.”
Clearer tooltips and input descriptions.
### Reliability and performance
No more repaints. The indicator waits for confirmation before drawing occurs.
Faster execution through targeted refactors.
All algorithms have been reviewed and now use a consistent logic, naming, and structure.

Dual Channel System [Alpha Extract]A sophisticated trend-following and reversal detection system that constructs dynamic support and resistance channels using volatility-adjusted ATR calculations and EMA smoothing for optimal market structure analysis. Utilizing advanced dual-zone methodology with step-like boundary evolution, this indicator delivers institutional-grade channel analysis that adapts to varying volatility conditions while providing high-probability entry and exit signals through breakthrough and rejection detection with comprehensive visual mapping and alert integration.
🔶 Advanced Channel Construction
Implements dual-zone architecture using recent price extremes as foundation points, applying EMA smoothing to reduce noise and ATR multipliers for volatility-responsive channel widths. The system creates resistance channels from highest highs and support channels from lowest lows with asymmetric multiplier ratios for optimal market reaction zones.
// Core Channel Calculation Framework
ATR = ta.atr(14)
// Resistance Channel Construction
Resistance_Basis = ta.ema(ta.highest(high, lookback), lookback)
Resistance_Upper = Resistance_Basis + (ATR * resistance_mult)
Resistance_Lower = Resistance_Basis - (ATR * resistance_mult * 0.3)
// Support Channel Construction
Support_Basis = ta.ema(ta.lowest(low, lookback), lookback)
Support_Upper = Support_Basis + (ATR * support_mult * 0.4)
Support_Lower = Support_Basis - (ATR * support_mult)
// Smoothing Application
Smoothed_Resistance_Upper = ta.ema(Resistance_Upper, smooth_periods)
Smoothed_Support_Lower = ta.ema(Support_Lower, smooth_periods)
🔶 Volatility-Adaptive Zone Framework
Features dynamic ATR-based width adjustment that expands channels during high-volatility periods and contracts during consolidation phases, preventing false signals while maintaining sensitivity to genuine breakouts. The asymmetric multiplier system optimizes zone boundaries for realistic market behavior patterns.
// Dynamic Volatility Adjustment
Channel_Width_Resistance = ATR * resistance_mult
Channel_Width_Support = ATR * support_mult
// Asymmetric Zone Optimization
Resistance_Zone = Resistance_Basis ± (ATR_Multiplied * )
Support_Zone = Support_Basis ± (ATR_Multiplied * )
🔶 Step-Like Boundary Evolution
Creates horizontal step boundaries that update on smoothed bound changes, providing visual history of evolving support and resistance levels with performance-optimized array management limited to 50 historical levels for clean chart presentation and efficient processing.
🔶 Comprehensive Signal Detection
Generates break and bounce signals through sophisticated crossover analysis, monitoring price interaction with smoothed channel boundaries for high-probability entry and exit identification. The system distinguishes between breakthrough continuation and rejection reversal patterns with precision timing.
🔶 Enhanced Visual Architecture
Provides translucent zone fills with gradient intensity scaling, step-like historical boundaries, and dynamic background highlighting that activates upon zone entry. The visual system uses institutional color coding with red resistance zones and green support zones for intuitive
market structure interpretation.
🔶 Intelligent Zone Management
Implements automatic zone relevance filtering, displaying channels only when price proximity warrants analysis attention. The system maintains optimal performance through smart array management and historical level tracking with configurable lookback periods for various market conditions.
🔶 Multi-Dimensional Analysis Framework
Combines trend continuation analysis through breakthrough patterns with reversal detection via rejection signals, providing comprehensive market structure assessment suitable for both trending and ranging market conditions with volatility-normalized accuracy.
🔶 Advanced Alert Integration
Features comprehensive notification system covering breakouts, breakdowns, rejections, and bounces with customizable alert conditions. The system enables precise position management through real-time notifications of critical channel interaction events and zone boundary violations.
🔶 Performance Optimization
Utilizes efficient EMA smoothing algorithms with configurable periods for noise reduction while maintaining responsiveness to genuine market structure changes. The system includes automatic historical level cleanup and performance-optimized visual rendering for smooth operation across all timeframes.
Why Choose Dual Channel System ?
This indicator delivers sophisticated channel-based market analysis through volatility-adaptive ATR calculations and intelligent zone construction methodology. By combining dynamic support and resistance detection with advanced signal generation and comprehensive visual mapping, it provides institutional-grade channel analysis suitable for cryptocurrency, forex, and equity markets. The system's ability to adapt to varying volatility conditions while maintaining signal accuracy makes it essential for traders seeking systematic approaches to breakout trading, zone reversals, and trend continuation analysis with clearly defined risk parameters and comprehensive alert integration. Also to note, this indicator is best suited for the 1D timeframe.

Liquidity Swing Points [BackQuant]Liquidity Swing Points
This tool marks recent swing highs and swing lows and turns them into persistent horizontal “liquidity” levels. These are places where resting orders often accumulate, such as stop losses above prior highs and below prior lows. The script detects confirmed pivots, records their prices, draws lines and labels, and manages their lifecycle on the chart so you can monitor potential sweep or breakout zones without manual redrawing.
What it plots
LQ-H at confirmed swing highs
LQ-L at confirmed swing lows
Horizontal levels that can optionally extend into the future
Timed removal of old levels to keep the chart clean
Each level stores its price, the bar where it was created, its type (high or low), plus a label and a line reference for efficient updates.
How it works
Pivot detection
A swing high is confirmed when the highest high has swing_length bars on both sides that are lower.
A swing low is confirmed when the lowest low has swing_length bars on both sides that are higher.
Pivots are only marked after they are confirmed, so they do not repaint.
Level creation
When a pivot confirms, the script records the price and the creation bar (offset by the right lookback).
A new line is plotted at that price, labeled LQ-H or LQ-L.
Rendering and extension
Levels can be drawn to the most recent bar only or extended to the right for forward reference.
Label size and line color/transparency are configurable.
Lifecycle management
On each confirmed bar, the script checks level age.
Levels older than a chosen bar count are removed automatically to reduce clutter.
How it can be used
Liquidity sweeps: Watch for price to probe beyond a level then close back inside. That behavior often signals a potential fade back into the prior range.
Breakout validation: If price pushes through a level and holds on closes, traders may treat that as continuation. Retests of the level from the other side can serve as structure checks.
Context for entries and exits: Use nearby LQ-H or LQ-L as reference for stop placement or partial-take zones, especially when other tools agree.
Multi-timeframe mapping: Plot swing points on higher timeframes, then drill down to time entries on lower timeframes as price interacts with those levels.
Why liquidity levels matter
Prior swing points are focal areas where many strategies set stops or pending orders. Price often revisits these zones, either to “sweep” resting liquidity before reversing, or to absorb it and trend. Marking these areas objectively helps frame scenarios like failed breaks, successful breakouts, and retests, and it reduces the subjectivity of eyeballing structure.
Settings to know
Swing Detection Length (swing_length), Controls sensitivity. Lower values find more local swings. Higher values find more significant ones.
Bars until removal (removeafter), Deletes levels after a fixed number of bars to prevent buildup.
Extend Levels Right (extend_levels), Keeps levels projected into the future for easier planning.
Label Size (label_size), Choose tiny to large for chart readability.
One color input controls both high and low levels with transparency for context.
Strengths
Objective marking of recent structure without hand drawing
No repaint after confirmation since pivots are locked once the right lookback completes
Lightweight and fast with simple lifecycle management
Clear visuals that integrate well with any price-action workflow
Practical tips
For scalping: use smaller swing_length to capture more granular liquidity. Keep removeafter short to avoid clutter.
For swing trading: increase swing_length so only more meaningful levels remain. Consider extending levels to the right for planning.
Combine with time-of-day filters, ATR for stop sizing, or a separate trend filter to bias trades taken at the levels.
Keep screenshots focused: one image showing a sweep and reversal, another showing a clean breakout and retest.
Limitations and notes
Levels appear after confirmation, so they are delayed by swing_length bars. This is by design to avoid repainting.
On very noisy or illiquid symbols, you may see many nearby levels. Increasing swing_length and shortening removeafter helps.
The script does not assess volume or session context. Consider pairing with volume or session tools if that is part of your process.

Adaptive Valuation [BackQuant]Adaptive Valuation
What this is
A composite, zero-centered oscillator that standardizes several classic indicators and blends them into one “valuation” line. It computes RSI, CCI, Demarker, and the Price Zone Oscillator, converts each to a rolling z-score, then forms a weighted average. Optional smoothing, dynamic overbought and oversold bands, and an on-chart table make the inputs and the final score easy to inspect.
How it works
Components
• RSI with its own lookback.
• CCI with its own lookback.
• DM (Demarker) with its own lookback.
• PZO (Price Zone Oscillator) with its own lookback.
Standardization via z-score
Each component is transformed using a rolling z-score over lookback bars:
z = (value − mean) ÷ stdev , where the mean is an EMA and the stdev is rolling.
This puts all inputs on a comparable scale measured in standard deviations.
Weighted blend
The z-scores are combined with user weights w_rsi, w_cci, w_dm, w_pzo to produce a single valuation series. If desired, it is then smoothed with a selected moving average (SMA, EMA, WMA, HMA, RMA, DEMA, TEMA, LINREG, ALMA, T3). ALMA’s sigma input shapes its curve.
Dynamic thresholds (optional)
Two ways to set overbought and oversold:
• Static : fixed levels at ob_thres and os_thres .
• Dynamic : ±k·σ bands, where σ is the rolling standard deviation of the valuation over dynLen .
Bands can be centered at zero or around the valuation’s rolling mean ( centerZero ).
Visualization and UI
• Zero line at 0 with gradient fill that darkens as the valuation moves away from 0.
• Optional plotting of band lines and background highlights when OB or OS is active.
• Optional candle and background coloring driven by the valuation.
• Summary table showing each component’s current z-score, the final score, and a compact status.
How it can be used
• Bias filter : treat crosses above 0 as bullish bias and below 0 as bearish bias.
• Mean-reversion context : look for exhaustion when the valuation enters the OB or OS region, then watch for exits from those regions or a return toward 0.
• Signal confirmation : use the final score to confirm setups from structure or price action.
• Adaptive banding : with dynamic thresholds, OB and OS adjust to prevailing variability rather than relying on fixed lines.
• Component tuning : change weights to emphasize trend (raise DM, reduce RSI/CCI) or range behavior (raise RSI/CCI, reduce DM). PZO can help in swing environments.
Why z-score blending helps
Indicators often live on different scales. Z-scoring places them on a common, unitless axis, so a one-sigma move in RSI has comparable influence to a one-sigma move in CCI. This reduces scale bias and allows transparent weighting. It also facilitates regime-aware thresholds because the dynamic bands scale with recent dispersion.
Inputs to know
• Component lookbacks : rsilb, ccilb, dmlb, pzolb control each raw signal.
• Standardization window : lookback sets the z-score memory. Longer smooths, shorter reacts.
• Weights : w_rsi, w_cci, w_dm, w_pzo determine each component’s influence.
• Smoothing : maType, smoothP, sig govern optional post-blend smoothing.
• Dynamic bands : dyn_thres, dynLen, thres_k, centerZero configure the adaptive OB/OS logic.
• UI : toggle the plot, table, candle coloring, and threshold lines.
Reading the plot
• Above 0 : composite pressure is positive.
• Below 0 : composite pressure is negative.
• OB region : valuation above the chosen OB line. Risk of mean reversion rises and momentum continuation needs evidence.
• OS region : mirror logic on the downside.
• Band exits : leaving OB or OS can serve as a normalization cue.
Strengths
• Normalizes heterogeneous signals into one interpretable series.
• Adjustable component weights to match instrument behavior.
• Dynamic thresholds adapt to changing volatility and drift.
• Transparent diagnostics from the on-chart table.
• Flexible smoothing choices, including ALMA and T3.
Limitations and cautions
• Z-scores assume a reasonably stationary window. Sharp regime shifts can make recent bands unrepresentative.
• Highly correlated components can overweight the same effect. Consider adjusting weights to avoid double counting.
• More smoothing adds lag. Less smoothing adds noise.
• Dynamic bands recalibrate with dynLen ; if set too short, bands may swing excessively. If too long, bands can be slow to adapt.
Practical tuning tips
• Trending symbols: increase w_dm , use a modest smoother like EMA or T3, and use centerZero dynamic bands.
• Choppy symbols: increase w_rsi and w_cci , consider ALMA with a higher sigma , and widen bands with a larger thres_k .
• Multiday swing charts: lengthen lookback and dynLen to stabilize the scale.
• Lower timeframes: shorten component lookbacks slightly and reduce smoothing to keep signals timely.
Alerts
• Enter and exit of Overbought and Oversold, based on the active band choice.
• Bullish and bearish zero crosses.
Use alerts as prompts to review context rather than as stand-alone trade commands.
Final Remarks
We created this to show people a different way of making indicators & trading.
You can process normal indicators in multiple ways to enhance or change the signal, especially with this you can utilise machine learning to optimise the weights, then trade accordingly.
All of the different components were selected to give some sort of signal, its made out of simple components yet is effective. As long as the user calibrates it to their Trading/ investing style you can find good results. Do not use anything standalone, ensure you are backtesting and creating a proper system.

Dynamic Value Zone Oscillator (DVZO) - @CRYPTIK1Dynamic Value Zone Oscillator (DVZO) @CRYPTIK1
Introduction: What is the DVZO?
The Dynamic Value Zone Oscillator (DVZO) is a powerful momentum indicator that reframes the classic "overbought" and "oversold" concept. Instead of relying on a fixed lookback period like a standard RSI or Stochastics, the DVZO measures the current price relative to a significant, higher-timeframe Value Zone (e.g., the previous week's entire price range).
This gives you a more contextual and structural understanding of price. The core question it answers is not just "Is the price moving up or down quickly?" but rather, "Where is the current price in relation to its recently established area of value?"
This allows traders to identify true "premium" (overbought) and "discount" (oversold) levels with greater accuracy, leading to higher-probability reversal and trend-following signals.
The Core Concept: Price vs. Value
The market is constantly trying to find equilibrium or "fair value." The DVZO is built on the principle that the high and low of a significant prior period (like the previous day, week, or month) create a powerful area of perceived value.
The Value Zone: The range between the high and low of the selected higher timeframe. The midpoint of this zone is the equilibrium (0 line on the oscillator).
Premium Territory (Distribution Zone): When price breaks above the Value Zone High (+100 line), it is trading at a premium. This is an area where sellers are more likely to become active and buyers may be over-extending.
Discount Territory (Accumulation Zone): When price breaks below the Value Zone Low (-100 line), it is trading at a discount. This is an area where buyers are more likely to see value and sellers may be exhausted.
By anchoring its analysis to these significant structural levels, the DVZO filters out much of the noise from lower-timeframe price fluctuations.
Key Features
The Oscillator:
The main blue line visualizes exactly where the current price is within the context of the Value Zone.
+100: The high of the Value Zone.
0: The midpoint/equilibrium of the Value Zone.
-100: The low of the Value Zone.
Automatic Divergence Detection:
The DVZO automatically identifies and plots bullish and bearish divergences on both the price chart and the oscillator itself.
Bullish Divergence: Price makes a new low, but the DVZO makes a higher low. This is a strong signal that downside momentum is fading and a reversal to the upside is likely.
Bearish Divergence: Price makes a new high, but the DVZO makes a lower high. This indicates that upside momentum is waning and a pullback is probable.
Value Migration Histogram:
The purple histogram in the background visualizes the width of the Value Zone.
Expanding Histogram: Volatility is increasing, and the accepted value range is getting wider.
Contracting Histogram: Volatility is decreasing, and the price is coiling in a tight range, often in anticipation of a major breakout.
How to Use the DVZO: Trading Strategies
1. Reversion Trading
This is the most direct way to use the indicator.
Look for Buys: When the DVZO line drops below -100, the price is in the "Accumulation Zone." Wait for the price to show signs of strength (e.g., a bullish candle pattern) and the DVZO line to start turning back up towards the -100 level. This is a high-probability mean reversion setup.
Look for Sells: When the DVZO line moves above +100, the price is in the "Distribution Zone." Look for signs of weakness (e.g., a bearish engulfing candle) and the DVZO line to start turning back down towards the +100 level.
2. Divergence Trading
Divergences are powerful confirmation signals.
Entry Signal: When a Bullish Divergence appears, it provides a strong entry signal for a long position, especially if it occurs within the Accumulation Zone (below -100).
Exit/Short Signal: When a Bearish Divergence appears, it can serve as a signal to take profit on long positions or to look for a short entry, especially if it occurs in the Distribution Zone (above +100).
3. Best Practices & Settings
Timeframe Synergy: The DVZO is most effective when your chart timeframe is lower than your selected Value Zone Source.
For Day Trading (e.g., 1H, 4H chart): Use the "Previous Day" Value Zone.
For Swing Trading (e.g., 1D, 12H chart): Use the "Previous Week" or "Previous Month" Value Zone.
Confirmation is Key: The DVZO is a powerful tool, but it should not be used in isolation. Always combine its signals with other forms of analysis, such as market structure, support/resistance levels, and candlestick patterns, for confirmation.