Reversal Pivot
Overview
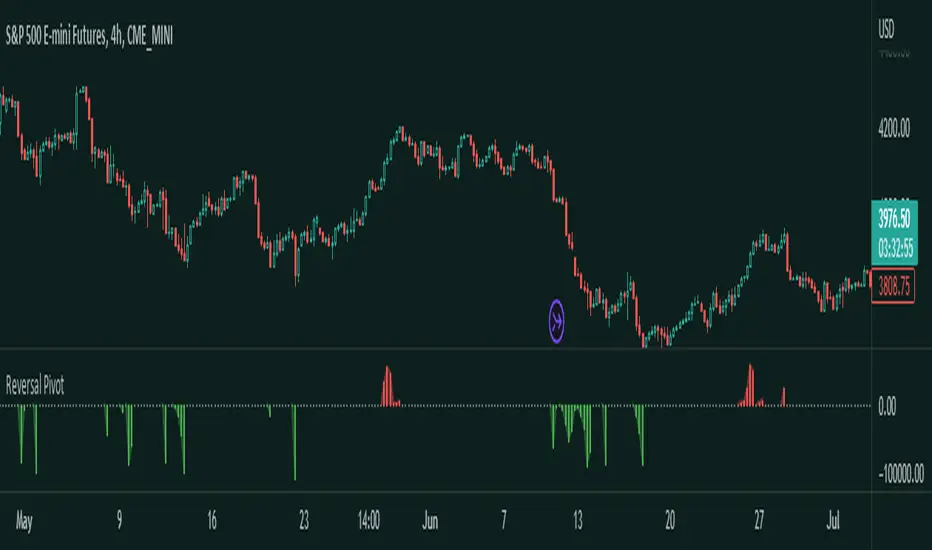
Introducing the Reversal Pivot indicator - a tool for identifying potential reversal points in price. This algorithm takes into account multiple factors, including price action, volume, and pivot points, to give you a clear and accurate picture of where the market is heading to.
How it works
The indicator gets expansions and the highs and lows and uses the conditions along with pivots to determine whether a reversal is possible or not. Then it gets the volume to determine how strong this chance of reversal is.
How to use
The Reversal Pivot indicator alone shouldn't be used to find reversal points but it helps you get a clear insight on where possible reversals could happen for example, you could use it with mean reversion strategies to find the best entries.
Red bars signal a bearish reversal
Green bars signal a bullish reversal
This here is an example of a long entry if you are trading lets say the mean. You can wait for a bullish reversal on the Histogram plot and then enter, a reversal could happen.
This is an example of a short entry if you are also trading the mean.
Other features
This indicator allows you to customize the colors, and the histogram. If you don't like the histogram then you can change its plot style to whatever you would like.
Try the Reversal Pivot indicator today and find more possible reversal points!
Meanreversion
Dual Bollinger Band Mean ReversionSimple but solid mean reversion indicator with sl and tp levels. Most of the code is based on the built in bollinger bands script. Designed for scalping 1-5 minute timeframes.
The indicator consists of two sets of bollinger bands.
Price has to close below the lower (fast) bollinger band, above the moving average of the (slower) bollinger band.
If price now closes above the lower (fast) bb, the indicator draws a label at the open of the next candle (which would be a potential entry point). Take profit becomes the upper bollinger band, stop loss the same distance below the open of the candle.
I've built in a simple backtesting function that calculates the potential win/loss-ratio. Loss and profit levels are 1:1. Exit strategy could be improved on.
Adjusting the lengths depending on the asset proves to be a good idea.
The slower bollinger bands can help to identify ranging markets and/or trends following regular bollinger bands theory.
Feel free to comment with any changes that you'd like to be made.

Cuban's Reversion Bands V2Cuban's Reversion Bands V2
Cubans Reversion Bands, are a great indication of price overextension by using specified standard deviations, extended from a moving average basis line, the Volume Weighted Average Trend.
Reversion Bands V2 builds off the original foundation in a big way but utilizes completely new band logic and a more stable basis line, the stability leads to a more consistent band reversion zones.
The basis line is calculated with volatility metrics and long term range determinants.
The band extension points are then weighted on this basis line with the asset's average extensions taken into consideration to fit each asset individually.
Users gain the ability to customize:
EQ Sensitivity
Band Sensitivity
EQ sensitivity will control the reaction time of the basis line e.g. a comparison of the default 1, and below an increase EQ to 100:
1 EQ Sensitivity (Default)
100 EQ Sensitivity
Band Sensitivity will control the distance of deviation from the basis point, this can be used to fine tune the reversion location which could be useful in higher beta environments.
1 Band Sensitivity
100 Band Sensitivity
As a result of overextension we can take this as a means for a potential market shift, for example, in range bound conditions we expect the market to revert at the given reversion zones in the Cuban Reversion Bands V2.
Failure to revert at a band level, and extension above could signify a change in market structure and lead to a trending environment thus giving us the ability to determine a trending environment.
To Do:
alerts
implement additional confluence via other proprietary tools to increase the signal ratio
Mean Reversion DotsMarkets tend to mean revert. This indicator plots a moving average from a higher time frame (type of MA and length selectable by the user). It then calculates standard deviations in two dimensions:
- Standard deviation of move of price away from this moving average
- Standard deviations of number of bars spent in this extended range
The indicator plots a table in the upper right corner with the % of distance of price from the moving average. It then plots 'mean reversion dots' once price has been 1 or more standard deviations away from the moving average for one or more standard deviations number of bars. The dots change color, becoming more intense, the longer the move persists. Optionally, the user can display the standard deviations in movement away from the moving average as channels, and the user can also select which levels of moves they want to see. Opting to see only more extreme moves will result in fewer signals, but signals that are more likely to imminently result in mean reversion back to the moving average.
In my opinion, this indicator is more likely to be useful for indices, futures, commodities, and select larger cap names.
Combinations I have found that work well for SPX are plotting the 30min 21ema on a 5min chart and the daily 21ema on an hourly chart.
In many cases, once mean reversion dots for an extreme enough move (level 1.3 or 2.2 and above) begin to appear, a trade may be initiated from a support/resistance level. A safer way to use these signals is to consider them as a 'heads up' that the move is overextended, and then look for a buy/sell signal from another indicator to initiate a position.
Note: I borrowed the code for the higher timeframe MA from the below indicator. I added the ability to select type of MA.
Market Meanness Index [CC]The Market Meanness Index was created by Johann Christian Lotter and I added some smoothing of my own, so feel free to try it without any smoothing to see the differences. This indicator relies on the mean reversion theory that all prices will eventually revert to the mean over a long period of time. Obviously there is more to the theory but the basic idea is if you plot a sma or other typical moving average, you will see the price moving up or below the long term moving average such as a 200 day sma but usually heads back to the average in the short term. This is a good statistical analysis used for volatility which is where this indicator comes in. Simply put, we calculate volatility based on how often a price is both above the median and above the previous price or vice versa.
A rising Market Meanness Index means that the market is becoming more volatile and that there is a high likelihood of a change in the underlying trend. A falling Market Meanness Index means that the current trend is dying and there is a high likelihood of a trend reversal. Typically I put general buy and sell signals in red or green but in this particular case, this indicator works best as a overall trend filter and you would want to place a trade when this indicator has a peak or valley. Let me know if you find a good overall buy and sell signal system of course.
I know I keep saying that I will get active again and post more indicators but life is very hectic for me. For those who have been following my updates, my twins were finally born a little over a month ago and as you can imagine, they keep me up at all hours of the day so it is hard to create new indicator scripts when I'm getting no sleep lol. I will do my best to start publishing the giant backlog of scripts I have created but in the meantime, please be patient with me. This indicator was a special request so let me know if you have any special requests of your own!

Gedhusek MasterReversionThe MasterReversion Indicator works as a scanner for possible price reversals.
How does it work?:
The main feature of this indicator is finding extreme price deviations from its mean. This is reached by calculating the average price deviation from its mean and then comparing it with the current price deviation. This deviation is expressed as a percentage in relation to the historically highest price deviation --> if the maximum deviation is 200 points and the current deviation is 180 points, than the percentage displayed is going to be 90%.
With knowing how extreme the current deviation is, we can do some good decision making about whether the market is ready to reverse to its mean or not.
The next feature of this indicator is classic SuperTrend indicator. This tool is mainly used for identifying shifts in the market trend and in this case it becomes very useful when catching the actual price reversion.
The key idea:
The main idea behind this tool is that the price can be away from moving average, but cant stay that way forever. Therefore its convenient to know when the reversion part might happen
How to use:
Generally, you would want to wait until the current price reaches certain percentage (you can see a label on the latest bar displaying current percentage deviation). After that happens, wait for a sign of pullback. For that you can use the built-in SuperTrend indicator or any other strategy that you like. Your potential Take Profit should be somewhere around the main moving average (it has a white colour) as you are speculating on mean reversion.
[
Settings:
MA Period = Period of a moving average. Price deviations will be relative to this moving average, so as the value is larger, you will catch more significant price deviations and vice versa
Percentage Trigger = Specifies what percentage do you consider as significant.
ATR Period = Settings for a SuperTrend. Specifies a period of an ATR indicator. I like to use values 22 or 34. As the value is higher, the indicator will be generally less sensitive
ATR Multiplier = Also specifies a sensitivity of SuperTrend. As the value is higher, the SuperTrend is going to be less sensitive and vice versa
I would personally encourage you to experiment with the indicator first, so you can decide which inputs are the best ones for your style of trading.
Which markets and Time Frame:
This indicator works best on Forex and can be used on any TF.
It is possible to use it also on other instruments, but the settings has to be adjusted more.

Regression Fit Bollinger Bands [Spiritualhealer117]This indicator is best suited for mean reversion trading, shorting at the upper band and buying at the lower band, but it can be used in all the same ways as a standard bollinger band.
It differs from a normal bollinger band because it is centered around the linear regression line, as opposed to the moving average line, and uses the linear regression of the standard deviation as opposed to the standard deviation.
This script was an experiment with the new vertical gradient fill feature.

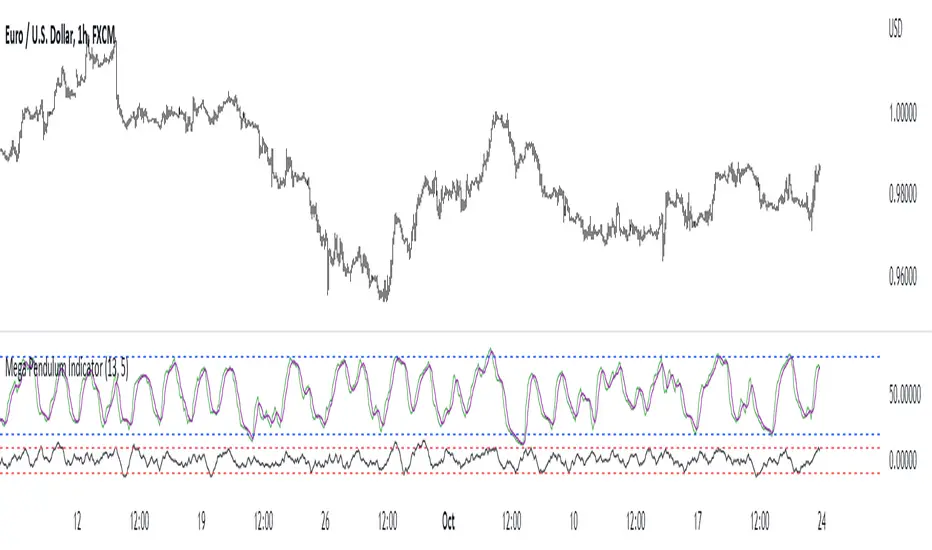
Mega Pendulum IndicatorThe MPI (Mega Pendulum Indicator) is a fusion between the Pendulum Indicator and the Swing Indicator and is used with specific trading rules.
The MPI is a semi-bounded oscillator comprised of two lines. The first bounded line is the Pendulum Indicator which oscillates between 0 and 100 but generally oscillates between 20 and 80. The second semi-bounded line is the Swing Indicator which generally oscillates between -10 and 10.
The conditions for trading the Mega Pendulum Indicator are as follows:
* Buy: Whenever the Pendulum indicator crosses over its signal line (a 5-period moving average) and at the same time, the Swing Indicator must cross over -10 after having been below it.
* Sell: Whenever the Pendulum indicator crosses below its signal line (a 5-period moving average) and at the same time, the Swing Indicator must cross under -10 after having been above it.
Attrition Scalper v2.0Green/Red Arrowed Buy/Sell signals are just simple buy sell signals based on SuperTrend, VWAP, Bollinger, Linear Regression
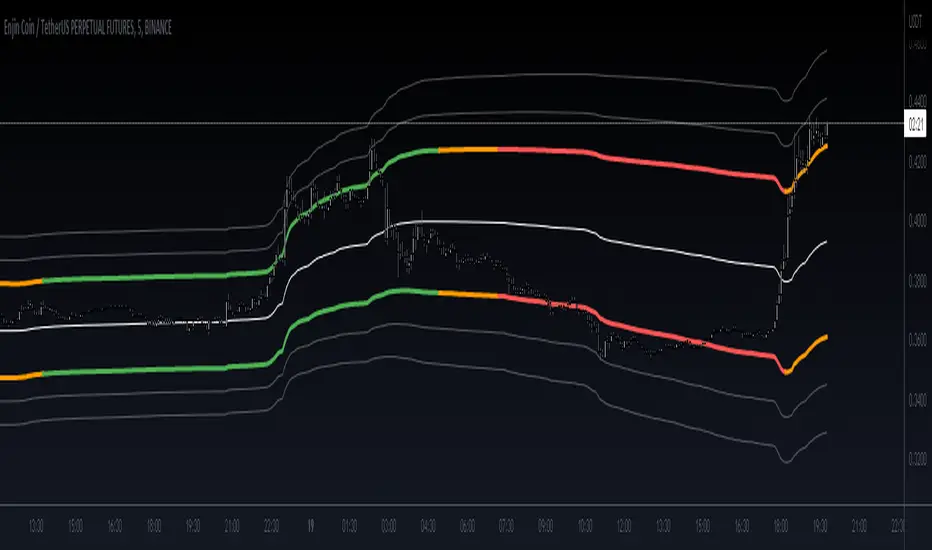
Purple Arrowed Buy/Sell Signals happen when the price/candle cross over or under the yellow outer lines (4.236 fib lines) It's extremely rare and hard for price to stay above these lines therefore we can usually and comfortably buy/sell it, a key information here though when price pumps or dumps super fast and hard to the point of crossing these borders, the trend might also be extremely strong and continous so even if the price temporarily goes back inside the borders as the lines expand over time price can continue riding or crossing these lines back again and continue the uptrend/downtrend, therefore crossing these outer borders doesn't necessarilly and always mean a reversal is due.
When analyzing the instrument you're trading the important factors for support/resistance areas are usually the outer lines like i said previously it's super hard for price to be outside these and will almost always get back inside quickly. The Middle thicker green/red line which is Variable Index Dynamic Average should also be a nice pivot line for major support and resistance . All the other lines are also important dynamic support/resistance lines.
Their Importance Order
1- Outer Yellow Line (4.236 Fibs)
2- Thicker Middle Green/Red Line (VIDYA)
3- Thinner Upper/Lower Green/Red Line (VIDYA +3, VIDYA -3)
4- The Rest Of The Lines (Fib Lines)
You can use this indicator in any market condition in any market to determine key support/resistance levels, use it for mean reversion through price expanding to outside of the most outer line therefore being overbought/oversold basically using the purple buy/sell signals or only follow the normal buy/sell signals or use it in confluence with each other. You can also use this indicator in confluence with your own manual technical analysis or other indicators/strategies you are already using and are comfortable with.
A good part is the support/resistance lines from timeframe to timeframe pictures the whole situation quite well, you can use lower timeframe to find your entry/exit positions and higher timeframe to find your key support/resistance points, they all should be somewhat in confluence from timeframe to timeframe anyways. My recommendation would be to look at 1HR, 4HR and 1D charts for swing trading and 5-15 Min for quick scalping/day trading
You should still probably at least take a look to higher timeframes so that you don't get burned when you realize there is a huge resistance line at price XXXXX on the 4 hour chart but you're expecting it to go above it on the 5 minute chart, it can go above it temporarily but we analyze everything on a closing basis so it most likely won't close above it. Again don't take a position or FOMO when price breaks a support/resistance line, we're looking for a CLOSE above/below them and a retest to see if S/R flip happened would even be better.
Sometimes the most outer line won't be the 4.236 (Yellow) lines as when it gets quite volatile the Thinner Upper/Lower Green/Red Lines (VIDYA +3, VIDYA-3) might cross them to be the most outer line, in this case i have observed that the trend is extremely strong this time price almost always doesn't go above or below the VIDYA line but can stay outside of the Yellow 4.236 Fib line for an extended amount of time (price will still get back inside the channel relatively quickly, just not as fast as the normal condition)
With Proper Risk Management and Discipline this indicator can be of great use to you as it's surprisingly successful especially at mean reversion and pointing out the support/resistance lines, they are so much more successful than your average MA/EMA lines.

Mean Reversion Indicator (Index)Hey everyone! Publishing my first script ever. This script explores the concept of mean reversion and how markets typically react to sub cycle highs and lows. I also added in a divergence formula to make it easier to spot probable turning points in market sentiment. If you are interested in the script, do drop me a DM to request for access.

Bollinger BandsThis strategy is inspired from Power of Stock aka Subhasish Panni.
Target is minimum 1:3 when you get this setup right.
Buy when:
1) Low is greater than upper band of BB and next candle breaks high of that candle, SL is Low of previous candle which is has low above upper band.
2) High is lower than lower band of BB and next candle breaks high of that candle, SL is low of previous candle which has high lower than lower band.
Sell when:
1) Low is greater than upper band of BB and next candle breaks low of that candle, SL is high of previous candle which is has low above upper band.
2) High is lower than lower band of BB and next candle breaks high of that candle, SL is high of previous candle which has high lower than lower band.
Disclaimer: this setup will cause many small stoploss hit, you have to accept that loss but you will be profitable because of R:R.

STD-Filtered, N-Pole Gaussian Filter [Loxx]This is a Gaussian Filter with Standard Deviation Filtering that works for orders (poles) higher than the usual 4 poles that was originally available in Ehlers Gaussian Filter formulas. Because of that, it is a sort of generalized Gaussian filter that can calculate arbitrary (order) pole Gaussian Filter and which makes it a sort of a unique indicator. For this implementation, the practical mathematical maximum is 15 poles after which the precision of calculation is useless--the coefficients for levels above 15 poles are so high that the precision loss actually means very little. Despite this maximal precision utility, I've left the upper bound of poles open-ended so you can try poles of order 15 and above yourself. The default is set to 5 poles which is 1 pole greater than the normal maximum of 4 poles.
The purpose of the standard deviation filter is to filter out noise by and by default it will filter 1 standard deviation. Adjust this number and the filter selections (price, both, GMA, none) to reduce the signal noise.
What is Ehlers Gaussian filter?
This filter can be used for smoothing. It rejects high frequencies (fast movements) better than an EMA and has lower lag. published by John F. Ehlers in "Rocket Science For Traders".
A Gaussian filter is one whose transfer response is described by the familiar Gaussian bell-shaped curve. In the case of low-pass filters, only the upper half of the curve describes the filter. The use of gaussian filters is a move toward achieving the dual goal of reducing lag and reducing the lag of high-frequency components relative to the lag of lower-frequency components.
A gaussian filter with...
One Pole: f = alpha*g + (1-alpha)f
Two Poles: f = alpha*2g + 2(1-alpha)f - (1-alpha)2f
Three Poles: f = alpha*3g + 3(1-alpha)f - 3(1-alpha)2f + (1-alpha)3f
Four Poles: f = alpha*4g + 4(1-alpha)f - 6(1-alpha)2f + 4(1-alpha)3f - (1-alpha)4f
and so on...
For an equivalent number of poles the lag of a Gaussian is about half the lag of a Butterworth filters: Lag = N*P / pi^2, where,
N is the number of poles, and
P is the critical period
Special initialization of filter stages ensures proper working in scans with as few bars as possible.
From Ehlers Book: "The first objective of using smoothers is to eliminate or reduce the undesired high-frequency components in the eprice data. Therefore these smoothers are called low-pass filters, and they all work by some form of averaging. Butterworth low-pass filters can do this job, but nothing comes for free. A higher degree of filtering is necessarily accompanied by a larger amount of lag. We have come to see that is a fact of life."
References John F. Ehlers: "Rocket Science For Traders, Digital Signal Processing Applications", Chapter 15: "Infinite Impulse Response Filters"
Included
Loxx's Expanded Source Types
Signals
Alerts
Bar coloring
Related indicators
STD-Filtered, Gaussian Moving Average (GMA)
STD-Filtered, Gaussian-Kernel-Weighted Moving Average
One-Sided Gaussian Filter w/ Channels
Fisher Transform w/ Dynamic Zones
R-sqrd Adapt. Fisher Transform w/ D. Zones & Divs .

+ Dynamic Fibo-Donchian ChannelsThis is my second Donchian Channels indicator (and will probably be my last because how many does one really need). This version is different from my other one in that, well, it's 'dynamic' which simply means that it self adjusts based on the same formula that my Ultimate Moving Average does. What does that mean? It just means that the script takes an average of 8 different length, in this case, highest highs and lowest lows. The user doesn't need to pick a lookback/length/period/what-have-you. The indicator does it all itself. This, I think, makes for a very nice baseline or bias indicator to fit within a system that utilizes something like that. I also think it makes for a more accurate gauge of higher highs and lower lows within a timeframe, because honestly what does it mean to make a lower low over 20 periods or 8 periods or 50 periods? I don't know. What I do know is that traditional Donchian Channels never made much sense to me, but this does.
Additionally, I've kept (I guess that's not 'additionally') the fibonacci retracement levels from my other Donchian Channels indicator. These are calculated off the high and the low of the Donchian Channels themselves. You will see that there are only three retracement levels (.786, .705, .382), one of which is not a fib level, but what some people call the 'OTE,' or 'optimal trade entry.'' If you want more info on the OTE just web search it. So, why no .618 or .236? Reason being that the .618 overlaps the .382, and the .236 is extremely close to the .786. This sounds confusing, but the retracement levels I'm using are derived from the high and low, so it was unnecessary to have all five levels from each. I could have just calculated from the high, or just from the low, and used all the levels, but I chose to just calculate three levels from the high and three from the low because that gives a sort of mirror image balance, and that appeals to me, and the utility of the indicator is the same.
The plot lines are all colored, and I've filled certain zones between them. There is a center zone filled between both .382 levels, an upper and lower zon filled between the .786 and either the high or the low, and a zone between the .705 and .785
If you like the colored zones, but don't like the plots because they cause screen compression, turn off the plots under the "style" tab, or much more simply right click on the price scale and click 'scale price chart only.' Voila! No more screen compression due to a moving average or some other annoyance.
Besides that basis being a nice baseline indicator the various fib bands (or just the high and low bands) make for excellent mean reversion extremes in ranging environments.
There are alerts for candle closes across every line.
Below is an image of the indicator at default settings.
Below is an image of the indicator with the center .382 channel turned off.
Below is an image of the indicator with just the .786/.705 channel showing .
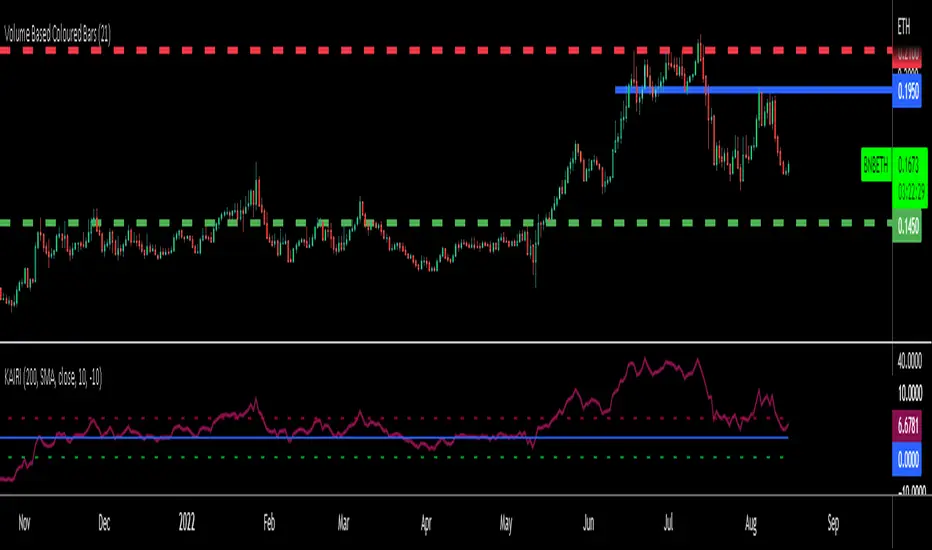
KAIRI RELATIVE INDEXAn old but gold Japanese indicator for Mean Reverting strategies and ideal for Pairs Trading...
The Kairi Relative Index measures the distance between closing prices and a Moving Average in percent value (generally SMA).
Extreme reading in the KRI are considered buy and sell signals.
Extreme readings will vary by asset, with more volatile assets reaching much higher and lower extremes that more sedate assets.
The KRI is not an accurate timing signal, and therefore, should be combined with other forms of analysis to generate trade signals.
You can calculate percent difference between the price and 10 different types of Moving Averages in this version of KAIRI as:
SMA : Simple Moving Average
EMA : Exponential Moving Average
WMA : Weighted Moving Average
TMA : Triangular Moving Average
VAR : Variable Index Dynamic Moving Average a.k.a. VIDYA
WWMA : Welles Wilder's Moving Average
ZLEMA : Zero Lag Exponential Moving Average
TSF : True Strength Force
HULL : Hull Moving Average
VWMA: Volume Veighted Moving Average
Personal advice: try using bigger length of Moving Averages like 50-100-200 for pairs and mean reversion strategies
[Sidders]Std. Deviation from Mean/MA (Z-score)This indicator visualizes in a straight forward way the distance price is away from the mean in absolute standard deviations (Z-score) over a certain lookback period (can be configured). Additionally I've included a moving average of the distance, the MA type can be configured in the settings.
Personally using this indicator for some of my algo mean reversion strategies. Price reaching the extreme treshold (can be configured in settings, standard is 3) could be seen as a point where price will revert to the mean.
I've included alerts for when price crosses into extreme areas, as well as alerts for when crosses back into 'normal' territory again. Both are also plotted on the indicator through background coloring/shapes.
Since I've learned so much from other developers I've decided to open source the code. Let me know if you have any ideas on how to improve, I'll see if I can implement them.
Enjoy!

Fancy Bars v.02.07Hello Lads,
this is the mandatory description to not get this indicator banned by tradingview. :-)
So what you can basically see are different types of colored candles and some weird signs below and above the candles.
In this picture you can see all features that the indicator is providing at the moment of the relase. More to come soon anon.
As first we got different color settings for different candles.
There are two different types of color candles.
Casual Extensions of the source you have chosen in the settings are either green or red by default.
If the market extends a little more, the bars are being colored either blue or purple.
These candles work well to identifiy local exhaustion points after a rallye to the up or the down side. But you can also take them as an entry.
For Example:
A green or blue extension appears after a significant drop in price. Candles like these are usually a first sign of a local bottom to form or a bounce to appear.
In order to view green and blue bars at the opposite, you can take them as an exit for your long after a rally, because the market tends to be exhausted afterwards.
It works the same way for the red and purple bars as you can see here. I hope the screenshot can make that clear aswell. :-)
So on the screenshots you can see aswell many different signs below and above the candles.
Candles with an "F" below or above the candle are showing you that the Fisher Transform indicator has made a turnover.
So this basically means that if there is a green "F" below a bar the value of the Fischer Oscillator is smaller then - 3 and the fast line is crossing the slow line, which is bullish.
If you see a "F" above a candle, this means that the slow line is crossing the fast line and the value of the fisher transform is greater then 3.
If you see an "H" above or below the candle this means that the Indicator "Hull Suite by InSilico" is turning over.
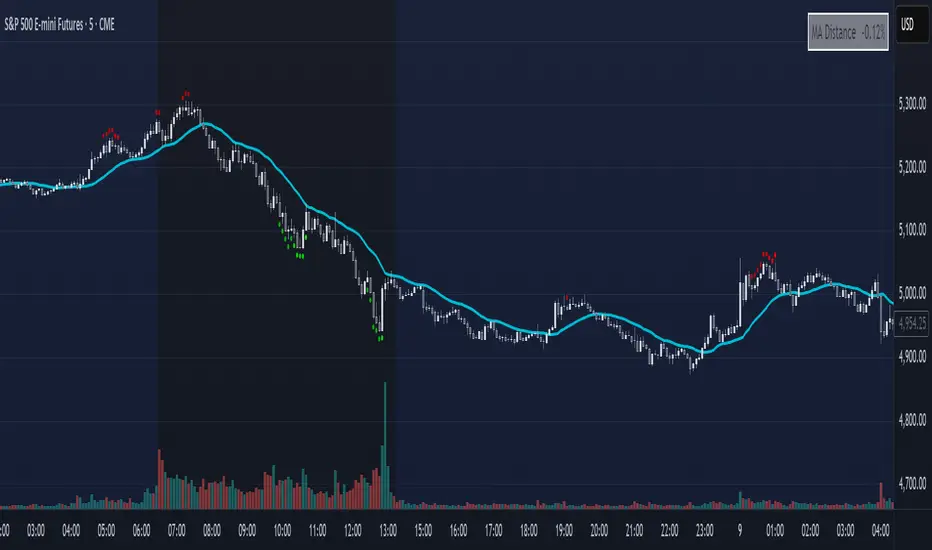
If the "H" is red and above the candle it´s a bearish sign, if it´s green and below the candle, it is a bullish sign.
Well as next we have these white colored "X" appearing form time to time.
Well X stands basically for EXIT.
We have calculated the difference from the current price to a selectable EMA / MA and if the percentage difference in market is bigger then the selected value in the menu, the market will simply print an "X" where you can exit your long or short position.
We recommand to use this function, espacially as all other functions aswell, only for scalping purposes, to catch a possible reversion of the price.
Here you can see the menu at it´s full beauty. You can select every mode and adjust your settings for your personal preferences.
gyazo.com
gyazo.com
You can even chose different modes for the extension bars, which are currently being tested. If you got some feedback, please let us know!
The "Vanilla" mode of the extension bars takes the volume from the current chart that you are looking at. So this mode basically works for all in TradingView existing markets where chart provides you volume.
The second mode aggregates Spot and Perpetual Volume from the biggest exchanges. We recommand to use this and the other modes (except vanilla ofc) only for BTC and ETH.
Furthermore we took the provided Open Interest from Binance to calculate the bars. It is as all the other things aswell highly experimental and hasn´t been tested a lot yet.
Last but not least, we calculated from the given Open Interest by Binance a CVD for BTC and ETH, which expansions are also being plotted as the previous explained candles.
gyazo.com
You can also change the length and the type of the AVG that is being calculated for the bar coloring. As well as for the Exit Bars and the Hull Suite.
gyazo.com
gyazo.com
gyazo.com
For this Project we have used Public Source Code by @InSilico for the HullSuite and ressources by Tradingview for the Fisher Turnover feature.

Infiten's Return Candle OscillatorInfiten's Return Candle Oscillator is an oscillator which shows the percentage return on the open, high, close and low over a customizable period in the form of candlesticks. It may be helpful for seeing volatility, swing trading, or mean reversion trading.
The RCO consists of two plotted elements :
RCO Candles (short length): candlesticks which are plotted with low = the product of the percentage changes in the low over a period, high = the product of the percentage changes in the high over a period, close = the product of the percent changes in close over a period, and open = the product of the percentage changes in return over a period. Similarly to with standard candlesticks, if the percentage change on the close is higher than the percentage change on the open, the candlestick is green, otherwise it is red.
Smoothed RCO Line (long length) : a moving average of the average of the low, close, open and high calculated for the RCO Candles. The line's transparency is determined by the percentage difference between the RCO and the highest or lowest RCO over the long length. A more transparent line means that the RCO is closer to the highest or lowest RCO, and may be indicative of a reversal, or weakening trend.

LNL Keltner ExhaustionLNL Keltner Exhaustion resolves the constant issue of Bands vs. EMAs
With the keltner exhaustion wedges, you can easily see the keltner channel extremes witout using the actual bands. That way, you will know whether the price is outside of the keltner channels + you can use other indicators (such as EMAs) on chart without the bands so the chart does not look messy & hard to read.
Two Types of Wedges:
1. Green/Red Wedge - Price action is extended outside the regular band. More of a "profit taking" zone rather than "entry taking" (default set to 3.0 ATR factor).
2. Purple Wedge - Price action is extended outside of the extreme band. Chances are price will revert to mean soon (default set to 4.0 ATR factor).
Works great as a target tool with the squeeze setup or as an overall extension gauge.
Hope it helps.

LS Volatility Index█ OVERVIEW
This indicator serves to measure the volatility of the price in relation to the average.
It serves four purposes:
1. Identify abnormal prices, extremely stretched in relation to an average;
2. Identify acceptable prices in the context of the main trend;
3. Identify market crashes;
4. Identify divergences.
█ CONCEPTS
The LS Volatility Index was originally described by Brazilian traders Alexandre Wolwacz (Stormer) , Fabrício Lorenz , and Fábio Figueiredo (Vlad)
Basically, this indicator can be used in two ways:
1. In a mean reversion strategy , when there is an unusual distance from it;
2. In a trend following strategy , when the price is in an acceptable region.
Perhaps the version presented here may have some slight differences, but the core is the same.
The original indicator is presented with a 21-period moving average, but here this value is customizable.
I made some fine tuning available, namely:
1. The possibility of smoothing the indicator;
2. Choose the type of moving average;
3. Customizable period;
4. Possibility to show a moving average of the indicator;
5. Color customization.
█ CALCULATION
First, the distance of the price from a given average in percentage terms is measured.
Then, the historical average volatility is obtained.
Finally the indicator is calculated through the ratio between the distance and the historical volatility.
To facilitate visualization, the result is normalized in a range from 0 to 100.
When it reaches 0, it means the price is on average.
When it hits 100, it means the price is way off average (stretched).
█ HOW TO USE IT
Here are some examples:
1. In a return-to-average strategy
2. In a trend following strategy
3. Identification of crashes and divergences
█ THANKS AND CREDITS
- Alexandre Wolwacz (Stormer), Fabrício Lorenz, Fábio Figueiredo (Vlad)
- Feature scaler (for normalization)
- HPotter (for calc of Historical Volatility)

Oasis Trading Group Market Making Bot - Mean Reversion BandsThe OTG Market Making Bot was designed with mean reversion trading in mind. It uses advanced ATR and other volatility formulas to create a set of bands that price should stay within. If price is testing the upper or lower bands then it is "extended" and a mean reversion back to the midline is likely.
The indicator comes with two sets of reversion bands, by default they are set to two and three standard deviations away from the midline, these can be changed to your preference. The indicator will give you Buy and Sell arrows if the conditions are being met. The conditions can be as simple as price hitting the bands or with certain filters, the filters are as follows:
Volatility Filter: Based on your settings it will look at the Current ATR vs Historic ATR Average if the Current ATR is higher than the average it will not show the mean reversion Buy/Sell signals because the volatility is too high. This filter can be turned on and off in the settings.
Trend Filter: Based on your settings it will lookback a certain amount of candles to see if the current price action is ranging or trending. If the current price action is determined to be trending it will not show the mean reversion Buy/Sell signals because it wants to trade within a range. This filter cannot be turned off in the settings, but if you wish to see all the Mean Reversion Buy/Sell signals without any filters you can turn them on in the style settings.
Midline: The midline is color coded based on your Trend Lookback settings. If it determines that the market is ranging it will be colored Green, if it determines that the market is trending it will be colored Red. Green means you are safe to take Mean Reversion trades.
The indicator comes with multiple alerts for all the different Buy/Sell signals. These signals can come from the first set of bands, second set, or unfiltered.
This indicator is designed to be paired with the ATR Improved Indicator I have created which is open source, it can be found here.
Also, paired with the OTG Automated Trading Bot. The OTG Trading Bot is a trend following bot, it excels in trend trading but fails in range trading. This Mean Reversion bot was designed to compliment the OTG Bot perfectly.
The Oasis Trading Group Market Making Bot will be available as a free add-on to all OTG Trading Bot users.
If you have any questions feel free to let me know in the comments or DM me.

Trend Day IndentificationVolatility is cyclical, after a large move up or down the market typically "ranges" during the next session. Directional order flow that enters the market during this subsequent session tends not to persist, this non-persistency of transactions leads to a non-trend day which is when I trade intraday reversionary strategies.
This script finds trend days in BTC with the purpose of:
1) counting trend day frequency
2) predicting range contraction for the next 1-2 days so I can run intraday reversion strategies
Trend down is defined as daily bar opening within X% of high and closing within X% of low
Trend up is defined as daily bar opening within X% of low and closing within X% of high
default parameters are:
1) open range extreme = 15% (open is within 15% of high or low)
2) close range extreme = 15% (close is within 15% of high or low)
There is also an atr filter that checks that the trend day has a larger range than the previous 4 bars this is to make sure we find true range expansion vs recent ranges.
Notes:
If a trend day occurs after a prolonged sideways contraction it can signal a breakout - this is less common but is an exception to the rule. These types of occurrences can lead to the persistency of order flow and result in extended directional daily runs.
If a trend day occurs close to 20 days high or low (stopping just short OR pushing slightly through) then wait an additional day before trading intraday reversion strategies.

Mean Shift Pivot ClusteringCore Concepts
According to Jeff Greenblatt in his book "Breakthrough Strategies for Predicting Any Market", Fibonacci and Lucas sequences are observed repeated in the bar counts from local pivot highs/lows. They occur from high to high, low to high, high to low, or low to high. Essentially, this phenomenon is observed repeatedly from any pivot points on any time frame. Greenblatt combines this observation with Elliott Waves to predict the price and time reversals. However, I am no Elliottician so it was not easy for me to use this in a practical manner. I decided to only use the bar count projections and ignore the price. I projected a subset of Fibonacci and Lucas sequences along with the Fibonacci ratios from each pivot point. As expected, a projection from each pivot point resulted in a large set of plotted data and looks like a huge gong show of lines. Surprisingly, I did notice clusters and have observed those clusters to be fairly accurate.
Fibonacci Sequence: 1, 2, 3, 5, 8, 13, 21, 34...
Lucas Sequence: 2, 1, 3, 4, 7, 11, 18, 29, 47...
Fibonacci Ratios (converted to whole numbers): 23, 38, 50, 61, 78, 127, 161...
Light Bulb Moment
My eyes may suck at grouping the lines together but what about clustering algorithms? I chose to use a gimped version of Mean Shift because it doesn't require me to know in advance how many lines to expect like K-Means. Mean shift is computationally expensive and with Pinescript's 500ms timeout, I had to make due without the KDE. In other words, I skipped the weighting part but I may try to incorporate it in the future. The code is from Harrison Kinsley . He's a fantastic teacher!
Usage
Search Radius: how far apart should the bars be before they are excluded from the cluster? Try to stick with a figure between 1-5. Too large a figure will give meaningless results.
Pivot Offset: looks left and right X number of bars for a pivot. Same setting as the default TradingView pivot high/low script.
Show Lines Back: show historical predicted lines. (These can change)
Use this script in conjunction with Fibonacci price retracement/extension levels and/or other support/resistance levels. If it's no where near a support/resistance and there's a projected time pivot coming up, it's probably a fake out.
Notes
Re-painting is intended. When a new pivot is found, it will project out the Fib/Lucas sequences so the algorithm will run again with additional information.
The script is for informational and educational purposes only.
Do not use this indicator by itself to trade!

Channel of linear regression of rate of change from the mean The indicator calculates the difference between the closing price and the average as a percentage and after that it calculates the average linear regression and then draws it in the form of a channel.
Preferably use it on 30 min or 15 min or 1 Hour or 2H time frames .
Exiting outside the upper or lower channel limits represents high price inflation, and returning inside the channel means the possibility of the price rising or falling for the average or the other limit of the channel.
Channel lines may represent places of support and resistance.
