Advanced Trend Break TargetsIntroduction
The Advanced Trend Break Targets (ATBT) is a semi-automated technical analysis system designed to validate trendline trading strategies with algorithmic precision. While standard trendlines are subjective drawings, the ATBT converts user-defined price structures into a mathematical model. It projects a trajectory based on two specific "Anchor Points" and monitors price action for valid breakouts, applying a strict "Confluence Filter" before generating signals or projecting targets.
Originality & Utility
Most trendline indicators rely on automatic detection, which often draws lines across irrelevant swing points. The ATBT respects the trader's discretion by allowing manual placement of the trendline (via timestamps) while automating the tedious tasks of monitoring for breaks, checking momentum conditions, and calculating Fibonacci risk-to-reward levels. This "Hybrid" approach combines human pattern recognition with machine discipline, ensuring trades are only signaled when specific quantitative conditions are met.
Detailed Methodology
1. The Advanced Projection Logic
The core of the script calculates a linear trajectory between two points in time (Start Date and End Date). Unlike standard drawings, this script calculates the exact slope (m) using the bar index difference
The script automatically detects the "Price Source" at your chosen timestamps. If a Pivot High exists at the start date, it defaults to a Resistance Line (Highs). If a Pivot Low exists, it defaults to a Support Line (Lows). This slope is then projected forward indefinitely:
2. The Confluence Filter (Multi-Condition Validation)
A raw price crossover is often a "fake-out." To combat this, the script includes a Mandatory Conditions engine. A breakout is only confirmed if the user-selected conditions are TRUE at the moment of the cross:
Volume Confirmation: Verifies if the breakout bar's volume is greater than its 20-period SMA.
CHOCH (Change of Character): Checks if the price has broken the most recent Swing High (for bullish setups) or Swing Low (for bearish setups) prior to the trendline break.
Swing Break: A strict check requiring the close to be beyond the last swing point.
Momentum (MACD & RSI): Ensures the MACD line is crossing the Signal line or that RSI is on the correct side of the 50 threshold.
Trend Filter (SMA): Verifies that price is above the 20 SMA (bullish) or below it (bearish).
3. Dynamic Target & Risk Calculation
Upon a validated breakout, the script scans the chart history for the most recent Pivot High or Low (within the lookback period) to define the "Structure Width" or Risk distance (D).
Stop Loss (SL): Placed at the recent Pivot Price.
Target 1: Projected at $1.0 \times D from the breakout point.
Target 2: Projected at $1.618 \times D (Golden Ratio).
Target 3: Projected at $2.618 \times D.
How to Use
1. Identify the Structure: visually identify a trendline on your chart (e.g., the upper resistance of a Wedge or Flag).
2. Set Anchors: Go to the script settings (Inputs tab) and enter the exact timestamp for Point 1 (Start of trendline) and Point 2 (End of trendline).
Tip: Ensure these dates align with the specific high/low candle you want to anchor to.
3. Configure Filters: Toggle the checkboxes in the "Mandatory Conditions" group.
Example: If you want to trade pure price action, enable "Require CHOCH" but leave "Require MACD" unchecked.
4. Interpret Signals:
Blue Labels (1 & 2): Indicate where the script has Advanced the trendline.
"Breakout" / "Breakdown" Label: Appears when price crosses the projected line AND all selected conditions are met.
Green/Red Dotted Lines: represent your Take Profit targets based on the structure width.
Inputs & Settings
TBT Group:
Start/End Date: The timestamps defining the line.
Pivot Left/Right: Controls the sensitivity of the pivot detection used for Stop Loss placement.
Extend Target Line: How far into the future the target lines are drawn.
Mandatory Conditions Group:
Require Volume / CHOCH / MACD / SMA / RSI: Individual toggles to build your specific trade strategy.
Thresholds: Adjust the lengths for SMA and RSI to match your preferred timeframe.
Example:
XAUUSD 4-hour timeframe
We had an uptrend. We added the indicator and set the point at the penultimate low (HL) and then the second point at the last low (HL), as shown in the following image.
You can choose the conditions you prefer to be met to trigger the breakout from the user settings.
Based on the conditions you set, if they are met, the indicator displays all the data, as seen in the following image. A stop-loss point was set, the breakout candle was identified, and the first target was set (you can choose to display the second and third targets from the user settings, noting that they are less likely to be achieved).
As we can see in the last image, the price reached the first target, then continued its path and achieved the second target as well. Afterward, it shifted to a short sideways trend and then reversed.
TBT vs. ATBT: Key Technical & Functional Enhancements
The ATBT (Advanced Trend Break Target) script introduces significant upgrades over the Free TBT, transforming it from a pure geometric breakout tool into a comprehensive strategy scanner with multi-factor confluence capabilities. Below are the primary differences:
1. Integration of Confluence Filters ("Mandatory Conditions")
The most substantial change is the addition of a robust filtering engine. While TBT relied solely on price crossing the trendline to trigger a signal, ATBT introduces a "Mandatory Conditions" input group. Traders can now require specific criteria to be met before a breakout is validated:
Volume Confirmation: Requires volume to exceed its SMA.
Market Structure (CHOCH): Can require a Change of Character to have occurred prior to the entry.
Momentum & Trend Filters: Options to enforce confirmation from MACD (crossovers), RSI (thresholds), and SMA (price location relative to the moving average).
2. Automated Risk Management (Stop-Loss)
ATBT adds a built-in Stop-Loss mechanism, addressing a missing feature in TBT.
TBT: Only projected Profit Targets (T1, T2, T3).
ATBT: Automatically calculates and plots a Stop-Loss (SL) level based on the pivot price used for the setup. This provides an immediate Risk/Reward visualization upon signal generation.
3. Smart Source Detection
ATBT improves user experience with an automation feature regarding the "Price Source" (High vs. Low).
TBT: The user must manually select whether they are anchoring to "High" or "Low" via the settings.
ATBT: The script attempts to automatically detect the correct source at the "Start Date" by checking if a pivot high or low exists at that timestamp, reducing manual configuration errors.
4. Enhanced Visuals & Swing Point Tracking
Visual clarity has been upgraded in the new version.
Swing Points: ATBT includes a `showSwingPoints` toggle that plots visual markers (circles) on Swing Highs and Swing Lows, helping traders visualize the market structure used for CHOCH and pivot calculations , Helping the trader identify the locations of the first and second points .
Signal State Tracking: ATBT uses "latched" logic (e.g., `chochMet`, `swingBrkMet`) to track if conditions were met anytime between Point 2 and the breakout, whereas TBT treated CHOCH largely as a separate visual component unrelated to the main trigger.
5. Refined Signal Logic
TBT: Triggers immediately upon a close across the trendline.
ATBT: Triggers only if the trendline cross occurs AND all enabled "Mandatory Conditions" return true. This significantly reduces noise by filtering out low-quality breakouts that lack structural or momentum support
Disclaimer
This script is a tool for visualizing market structure and calculating potential geometries. It does not guarantee future performance. Breakouts can fail, and "Mandatory Conditions" are lagging indicators that confirm past data. Always manage risk responsibly.
Marketstructureshift

ICT Killzones Pro Suite — ICT & SMC Indicator with AlertsThe ICT Killzones Pro Suite is a complete ICT and Smart Money Concepts (SMC) indicator that brings together the most important institutional concepts into one single tool.
Instead of manually drawing sessions, structure breaks, liquidity levels or imbalances, this ICT indicator for TradingView automatically plots them with precision and full customization.
It is widely used by traders in Forex, Indices, Crypto and Commodities who want to study market structure the same way institutions do.
🔎 Features
✅ Killzones (Asia, London, New York)
Session boxes with customizable colors
50% midline level for equilibrium reference
Real-time status display (“In Killzone” / “Out of Killzone”)
✅ Equal Highs & Equal Lows (Liquidity zones)
Automatic detection of EQH/EQL
Equality tolerance parameter
Zone expiry (bars)
Rejection filter (2 consecutive closes)
Option to show only the latest active EQH/EQL
✅ Break of Structure (BOS) & Market Structure Shift (MSS)
Detects continuation (BOS) and reversal (MSS) structures
Customizable line styles and colors
“Body only” or “Body/Wick” break modes
Option to show only the latest signals
✅ Open Price Range (OPR)
Institutional daily open level in UTC
Historical OPR memory for backtesting
Optional labels for quick identification
✅ Previous Highs and Lows
Daily (PDH/PDL), Weekly (PWH/PWL), Monthly (PMH/PML)
Full label system
Customizable line width/style
Breakout alerts for each level
✅ Fair Value Gaps (FVGs)
Automatic imbalance detection
Wick or body detection modes
Highlighted imbalance candles in yellow
✅ Alerts Engine
One global alert condition
Modular alerts:
• Killzone opens/closes
• EQH/EQL created or broken
• BOS/MSS bullish & bearish signals
• Previous Highs/Lows breakouts
• FVGs
⚙️ Parameters Explained
Killzones: start/end times in UTC, colors, extension lines, 50% midline
EQH/EQL: tolerance (0 = strict equality, >0 = margin allowed), expiry age (bars), rejection filter, body/wick break type, latest only toggle
BOS/MSS: swing bars (pivots), body vs wick detection, line styles & widths, only-latest option
OPR: exact UTC time (HH:MM), history toggle, label size/color
Previous Highs/Lows: daily/weekly/monthly levels, line styles, label settings, breakout alerts
FVGs: wick vs body detection, candle highlight color
Alerts: global condition + per-module toggles (sessions, liquidity, BOS/MSS, FVG)
Every parameter is fully customizable, making this SMC indicator adaptable to any trading style or timeframe.
📌 Why use this ICT & SMC indicator?
Saves time by automating repetitive tasks
Provides an institutional framework directly on charts
Keeps analysis structured and consistent
Optimized for intraday scalping and swing trading
⚠️ Disclaimer
This script is for educational purposes only. It does not guarantee profits or predict markets with certainty. Always use proper risk management.
🔑 Access
This is an invite-only script on TradingView.
Click Request Access on this page to apply.

Trend Break Target
The Trend Break Target indicator helps traders identify and trade potential breakout opportunities with precision. It offers the following key benefits:
Customizable Trend Anchors
Allows traders to set specific start and end dates for the trendline, ensuring analysis is aligned with chosen time windows.
Supports different price sources (High, Low, Close) to fit diverse trading styles.
Automatic Trendline Projection
Dynamically plots a trendline between selected anchor points and extends it forward, providing a clear visual guide for future price interactions.
Breakout Detection
Instantly detects when price breaks above or below the trendline.
Plots breakout markers (▲ / ▼) directly on the chart to highlight actionable trade signals.
Pivot-Based Target Calculation
Uses the nearest valid pivot high/low before the breakout (or a fallback lookback if unavailable).
Measures the distance between the pivot and the trendline, then projects a target price in the breakout direction.
Clear Visual Targets
Draws a dotted target line to show where price may reach after the breakout.
Adds a connector line from breakout to target and a measurement line from pivot to trendline, improving clarity of the setup.
Automatic Reset & Efficiency
Resets calculations when new anchors are applied, keeping charts clean and reducing noise.
Deletes old lines and labels automatically to optimize chart readability.
Strategic Trade Planning
Helps traders quickly identify risk-reward opportunities by visualizing breakout levels and price targets.
Useful for trend continuation as well as reversal trading strategies.
👉 In short, the FTBT indicator provides a structured way to analyse trendlines, confirm breakouts, and project realistic price targets—making it a powerful tool for both discretionary and systematic traders.

[TehThomas- Pro] - Liquidity SignalsOverview
This Pine Script indicator is designed to generate Buy and Sell signals based on liquidity sweeps and market structure shifts (MSS) or break of structure (BOS). The combination of liquidity sweeps and market structure changes provides a highly confluential signal that can be used to identify high-probability trade setups. This indicator is capable of working as a standalone tool or as part of a broader trading strategy.
Core Concepts
Liquidity Sweeps:
A liquidity sweep occurs when the price temporarily breaks a previous high or low, taking out stop losses or inducing breakout traders, only to reverse direction shortly after.
The indicator detects these liquidity sweeps at pivot points defined by a user-set pivotPeriod.
It plots Buyside Liquidity (resistance) or Sellside Liquidity (support) lines on the chart to indicate where liquidity pools are likely positioned.
Market Structure Shifts (MSS) and Break of Structure (BOS):
BOS: This occurs when the price closes above or below a previous swing high or low, indicating a potential shift in trend.
MSS: This is a more aggressive form of market structure change where the price action reverses after a liquidity sweep, signaling a potential reversal before a BOS confirmation.
The script tracks swing highs and swing lows using the pivot_strength setting to define how many bars are required on both sides of a pivot point.
Confluence of Signals:
The main signal is plotted when a Liquidity Sweep is followed by an MSS within a specified number of bars (25 by default).
This creates a high-probability trade signal because it combines both liquidity traps and market structure reversals.
Below, you can see the signals the indicator generates
There is one loss marked by the second circle.
Settings and Inputs
Liquidity Sweep Settings
pivotPeriod: Defines the left and right length of the pivot points to detect swing highs and lows.
maxLine: Maximum number of liquidity lines plotted on the chart.
resistanceColor & supportColor: Colors for Buyside and Sellside liquidity lines.
lineExtend: Number of bars to extend liquidity lines into the future.
hitAction: Determines what happens when liquidity lines are hit (dotted, dashed, or delete).
Market Structure Settings
show_mss: Toggle to display MSS signals on the chart.
show_bos: Toggle to display BOS signals on the chart.
Customizable line styles, colors, and labels for both MSS and BOS.
How to Use the Indicator
Signal Confirmation:
A Buy Signal is most effective when combined with a liquidity sweep of sellside liquidity followed by a bullish market structure shift.
A Sell Signal is most effective when combined with a liquidity sweep of buyside liquidity followed by a bearish market structure shift.
Always check confluence with other indicators such as moving averages or volume analysis.
Trade Management:
Place stop-loss orders below the liquidity sweep low for buys or above the liquidity sweep high for sells.
Use the previous swing high or low as a target or set custom risk-reward ratios.
Why This Indicator Works So Well
✅ Combines liquidity sweeps and market structure for highly accurate signals.
✅ Works across all timeframes and markets.
✅ Automatically plots support and resistance zones.
✅ Provides clear buy and sell signals with customizable alerts.
✅ Helps traders avoid false breakouts by waiting for market structure confirmation.
Conclusion
This indicator is a highly confluential trading tool that combines liquidity sweeps with market structure shifts to generate Buy and Sell signals. It provides a strong edge by confirming liquidity traps with market structure reversals. With customizable settings, it can be adapted to different timeframes and trading styles, making it suitable for both scalping and swing trading strategies.
By automating the detection of these advanced concepts, the indicator helps traders stay objective and disciplined in their decision-making process.
Whether you're a beginner or an advanced trader, this indicator will help you spot high-probability trade setups and improve your overall trading performance.
Disclaimer
This indicator is a powerful tool for identifying potential trading opportunities, but it is not a guarantee of future performance. Use this indicator at your own risk. Trading involves significant risk, and it is essential to have proper knowledge and experience before making any financial decisions. The signals provided by this indicator should be used as part of a comprehensive trading plan and combined with other forms of analysis. The creator is not responsible for any financial losses incurred while using this tool.

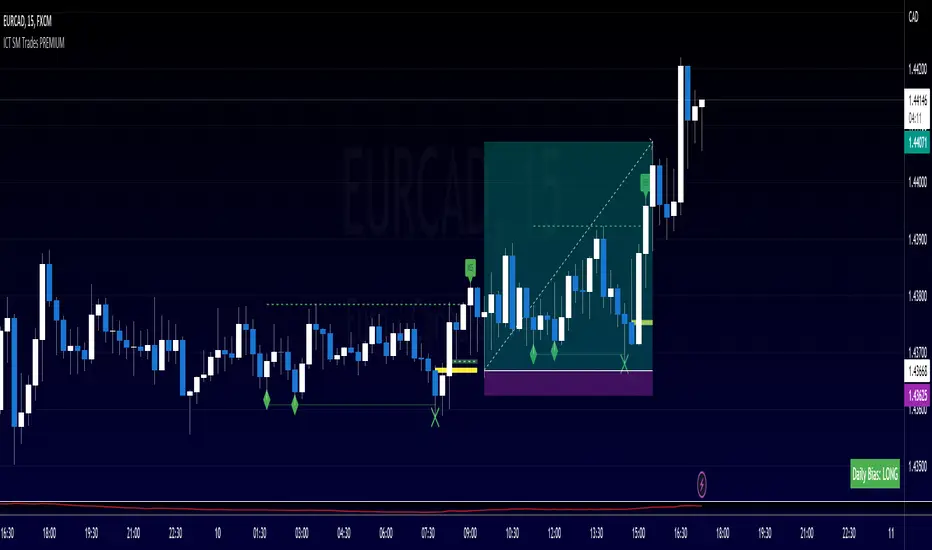
Market Structures SMC [TradingFinder] BOS/CHoCH Major & Minor🟣Introduction
Understanding market structure involves analyzing market behavior. In other words, market structure encompasses how the market forms and evolves within trends.
Market structures are typically fractal and nested, so we categorize them into internal (minor) and external (major) structures. There are various definitions of market structure, with different approaches such as Smart Money and ICT providing their own interpretations.
🟣How to Use
The first step in identifying market structure is to analyze key highs and lows. An uptrend is formed when highs and lows are successively higher than previous ones. Similarly, in a downtrend, lows and highs are successively lower than previous ones.
Market trends consist of two types of movements :
•Impulsive movements
•Corrective movements
Impulsive movements align with the main trend and possess high strength and momentum. Conversely, corrective movements go against the main trend and have lower strength and momentum. The following example illustrates these concepts.
🔵 Identifying Break of Structure (BOS)
In a specific trend, for example in a downtrend, when the price breaks below the previous low and forms a new low (LL), a Break of Structure occurs. In an uptrend, a BOS (Market Structure Break or MSB) happens when the price rises and surpasses the last high.
We need at least one BOS to confirm a trend. Breaking above or below the previous high or low must be confirmed by closing at least one candle after that level.
🔵 Identifying Change of Character (CHOCH)
Change of Character (CHOCH) is a key concept in market structure analysis. A change in structure signals a trend change. In other words, a trend ends with a CHOCH (Market Structure Shift or MSS). For instance, in a downtrend, the price declines with BOS.
BOS indicates the strength of the trend, but when the price increases and surpasses the last high, a CHOCH occurs, signaling a shift from a downtrend to an uptrend.
This does not mean entering a buy trade; instead, we should wait for a BOS in the upward direction to confirm the uptrend. Unlike BOS, confirming a CHOCH does not require a candle to close; simply breaking above or below the previous high or low with the candle's wick is sufficient. The following examples show bearish and bullish CHOCH.
🔵 Range Market Structure
Besides uptrends and downtrends, a third structure often found in the market is the range or sideways structure. In this state, the power of buyers and sellers is almost equal, and the market lacks a clear trend.
Many traders believe that the Forex market ranges 80% of the time. Therefore, it requires a lot of patience to wait for a new trend to start.
🟣 Settings
Through the settings, you can customize the display, visibility, and color of each line as desired.

MTF Market Structure - SMC IndicatorsThe Multi Timeframe Market Structure helps understand and identify bullish or bearish Market Structure by highlighting “KEY” Highs and Lows. It also identifies changes in market direction by identifying a “Shift in Market Structure” (See Point 2 below) or “Break in Market Structure” (See Point 3 Below).
What are Key Highs and Lows?
Not every high or low is a “Key” high or low. “Key” highs and lows are specific highs and lows that form the structure of the market and have significance in understanding the current trend in the market (see point 1 below).
The indicator identifies these “Key” highs and lows on multiple time frames, allowing the trader to keep a perspective of the Market Structure with multiple timeframes simultaneously (see point 5 below).
The key highs and lows identified by the indicator are as follows:
Key Lows : Identify significant Swing Lows, Short-term lows “STL”, Intermediate-Term Lows “ITL”, and Long-Term Lows “LTL”.
Key Highs : Identify significant Swing Highs, Short-term highs “STH”, Intermediate-Term Highs “ITH”, and Long-Term Highs “LTH”.
Significant Swing High : This is a price swing with one lower candle to the right and one lower candle to the left of it.
Significant Swing Low : This is a price swing with one higher candle to the right and one higher candle to the left of it.
Short-Term High “STH” is a price swing with one lower Significant Swing High to the right and one lower Significant Swing High to the left of it.
Short-Term Low “STL” is a price swing with one higher Significant Swing Low to the right and one higher Significant Swing Low to the left of it.
Intermediate-Term High “ITH” is a price swing with one lower STH to the right and one lower STH to the left of it.
Intermediate-Term Low “ITL” is a price swing with one higher STL to the right and one higher STL to the left of it.
Long-Term High “LTH” is a price swing with one lower ITH to the right and one lower ITH to the left of it.
Long-Term Low “ITL” is a price swing with one higher ITL to the right and one higher ITL to the left of it.
By identifying key highs and lows using the Market Structure Indicator, it can be used in multiple ways by using those reference points as follows:
1. Identifying Market Trends by Connecting Key Highs and Lows.
Bullish trend identification is when the indicator is making higher ITLs and ITHs.
Bearish Trend identification when the indicator is making lower ITLs and ITHs.
PS: it’s essential to understand the underlying market trend on multiple timeframes to use the next features correctly. Always use the Shifts and Breaks in Market Structures in line with the 1H or higher timeframes Market Trend for higher probability trade opportunities. This is because, generally, higher timeframes have more importance than lower timeframes.
2. Shift In Market Structure - SMS for Entries
A Shift in Market Structure “SMS” identifies potential reversal in short-term market trend relative to the timeframe where the SMS is identified.
This occurs after a run of any Significant Swing High or Low and then reversing, creating a Fair Value Gap “FVG”.
There can be Bullish and Bearish Market Structure Shifts.
When a Bullish Shift in Market Structure occurs, the indicator identifies an opportunity for the price to change from Bearish to Bullish, as seen in the image below.
When a Bearish Shift in Market Structure occurs, the indicator identifies an opportunity for the price to change from Bullish to Bearish.
3. Break In Market Structure - BMS for Entries
A Break in Market Structure “BMS” has a similar function to the Shift in Market Structure “SMS”; however, when it occurs, it identifies a potential longer-term trend reversal (compared to the SMS) relative to the timeframe where the BMS is identified.
Unlike “SMS”, the BMS occurs after a run only after a run on Key Highs or Lows.
Similar to the SMS, there can be Bullish and Bearish Breaks in Market Structure.
When a Bullish Break in Market Structure occurs, the indicator identifies an opportunity for a longer-term trend change from Bearish to Bullish, as seen in the image below.
The FVG must occur in the lower 50% of the impulse price leg (at Discount).
When a Bearish Break in Market Structure occurs, the indicator identifies an opportunity for a longer-term trend change from Bullish to Bearish.
The FVG must occur in the upper 50% of the impulse price leg (at Premium).
4. Inversion Break and Shift in Market Structure for Early Entries
Inversion “BMS” and “SMS” are similar to the normal SMS and BMS, but they occur:
Bullish: When the FVG of the Bearish BMS/SMS forms in the lower 50% of the impulse price leg (at Discount).
We use the FVG that forms from the Bearish SMS/BMS as an inversion FVG for potential entry after market trend change from Bearish to Bullish.
Bearish: When the FVG of the Bullish BMS/SMS forms in the upper 50% of the impulse price leg (at Premium).
We use the FVG that forms from the Bullish SMS/BMS as an inversion FVG for potential entry after market trend change from Bullish to Bearish.
5. Multi Time Frame analysis
The indicator allows multiple timeframe perspectives to be considered when using it.
The key Highs and Lows have significance not only on the current timeframe they are identified but also on lower or higher timeframes simultaneously.
This is because a ITL/ITH on the 1H means
It’s a LTL/LTH on one or more timeframes lower (15Min, 5M, and 1Min).
And at the same time, it’s a STL/STH on one timeframe higher (4H)
Also, it’s a Significant Low/High (marked with a dot) on two timeframes higher (Daily).
The same logic applies to all other Key Highs and Lows.
Another example is a Significant Low/High (swing marked with a dot below or above it) on the current timeframe (1D) means it’s a STL/STH on one timeframe lower (4H) and an ITL/ITH on two timeframes lower (1H) and a LTH/LTH on three timeframes lower or more (15M, 5M, 1Min, 30 Seconds, etc…).
This Multi-time frame analysis is a great way to help traders understand Market Structure and Market trend on multiple timeframes simultaneously, and it also assists in Top-down analysis.
PS: Note that this multi-timeframe analysis approach and logic can be applied to any timeframe and for any type of trading (swing trading, day trading, scalping, or short-term trading) because the price is fractal.
For example, if a trader is a swing trader, then it’s best to identify trader opportunities on the 1H or higher; however, lower timeframes Market Structure can still be used to help the traders refine their entries and target key highs and lows in the opposite direction.
If a trader is a day trader or a scalper, the trader could use Market Structure on 15M or lower to identify trader opportunities and target key highs and lows in the opposite direction.
6. Setting Targets
The indicator can also be used to identify potential targets after the SMS or BMS occurs. Targets can be chosen above Key Highs or Lows depending on the trade objective and timeframe where the trade idea is identified.
Bonus Features
Highlight Market Structure Trend
This feature is an excellent backtesting visual tool to look at changes in market trends highlighted in colours. These changes are based on the Shift or Break in of Market Structure depending on the selection option.
When "Shift/Break" in Market Structure" is selected, a Bullish trend is highlighted in blue when a Bullish Shift/Break in Market Structure Occurs and in Red when a Bearish Shift/Break in Market Structure Occurs.
Notifications
Sends notifications when there is a Shift or Break in Market Structure on the current timeframe of choice.

ICT HTF MSS & Liquidity (fadi)ICT HTF MSS & Liquidity provides higher timeframe view of where the liquidity may reside and when higher timeframe market structure shift has occurred.
In his 2022 mentorship, ICT has advocated used the 15m chart to watch for liquidity and looking for lower timeframes for entry (5m,4m,3m,2m,1m).
Liquidity will reside above pivot points and ICT pivot points are based on 3 candle formation for the short term, three short term formation for intermediate, and three intermediate formation for the long terms.
Options
Timeframe Timeframe to monitor
Use the Short, Intermediate, or Long Term highs and lows
Liquidity Styles
Open liquidity line style, size, and color
Claimed liquidity line style, size, and color
Extend the open liquidity line beyond the current candle
Number of lines to display, this includes claimed and open

Market Structure (Breakers) [LuxAlgo]The Market Structure (Breakers) indicator aims to detect "Breaker Market Structures", an original concept inspired by breaker blocks, and extend on the original concept of market structures by extending existing MS levels, providing supports/resistances as a result.
Various graphical elements are included that highlight the interactions between price and Breaker structures.
🔶 USAGE
Breaker structures occur when a market structure is confirmed (price breaking a previous swing level). The broken swing point is extended by a dotted line which can be used as potential support or resistance.
After a market structure, the price can eventually reverse and break one or multiple breaker structures at the same time, allowing for the detection of new trends in the price.
A market structure closer to the top/bottom of a trend can return Breaker structures breakouts more indicative of potential reversals.
Breakers MS breakouts can also be useful as exits for entries done using market market structures.
The script additionally highlights support/resistance events by highlighting candle borders, with a border using a green color indicating support events while a red color is indicative of a resistance event.
🔹 Breaker Structure Lifespan
The "lifespan" of Breaker structures, that is the amount of time the script will extend/evaluate them is determined by various user settings.
The Maximum Breaks setting determines the maximum amount of breaks a breaker structure can withstand before it is broken.
For example, a maximum amount of breaks of 3 for a bearish breaker structure would require the price to cross under that precise breaker structure level three times. Using higher values of this setting will also highlight more Breakers MS.
The Breaker Maximum Duration setting on the other hand determines how many bars a breaker structure can be evaluated without being broken. If a breaker structure is not broken after this amount of bars then it will stop being evaluated and will be removed.
🔶 SETTINGS
Swings Period: Period used for the swing detection, with higher values returning longer term markter structures.
Maximum Breaks: Amount of break required for a breaker block to be considered broken.
Breaker Maximum Duration: Maximum duration of a breaker block (in bars).

ICT Institutional Order Flow (fadi)ICT Institutional Order Flow indicator is intended to provide wholistic view to better analyze order flow and where price may go to next. The concept follows ICT principles.
ICT Market Structure
ICT breaks down Pivot points into three categories:
Short Term High/Low (STH/STL) is a 3 candle pattern with a low with higher low on each side (STL), or a high with lower high on each side (STH)
Intermediate Term High/Low (ITH/ITL) uses the calculated STH/STL and marks any STH that has lower or STH on each side, and STL that has higher STL on each side
Long Term High/Low (LTH/LTL) uses the calculated ITH/ITL and marks any ITH that has lower or ITH on each side, and ITL that has higher ITL on each side
Note: ICT also states that if a STH wicks into and closes (almost?) a FVG, he marks it as ITH even if it does not have STH on reach side. This scenario is not covered by this indicator
Liquidity
liquidity is usually present under pivot points. The more prominent the pivot point, the more likely higher values liquidity pools reside under/above it. Liquidity under ITL and LTL as an example, will have better indication of which liquidity the price may seek next.
Displacement
Displacement registers above average move in the price resulting in strong visible move. If requiring a FVG is enabled (in settings), then the displacement could possibly (but never guaranteed) be used to visually recognize a move as it develops.
Full Credit: The calculation for Displacement is derived from TFO's Visualizing Displacement
Imbalances
Imbalances can come in different forms. This indicator identifies three type of imbalances:
1. FVG
2. Volume Imbalance
3. Open Gaps
Imbalances completes the picture by help visualize strong moves, where possible pivot points may develop, and how to enter or manage a trade.

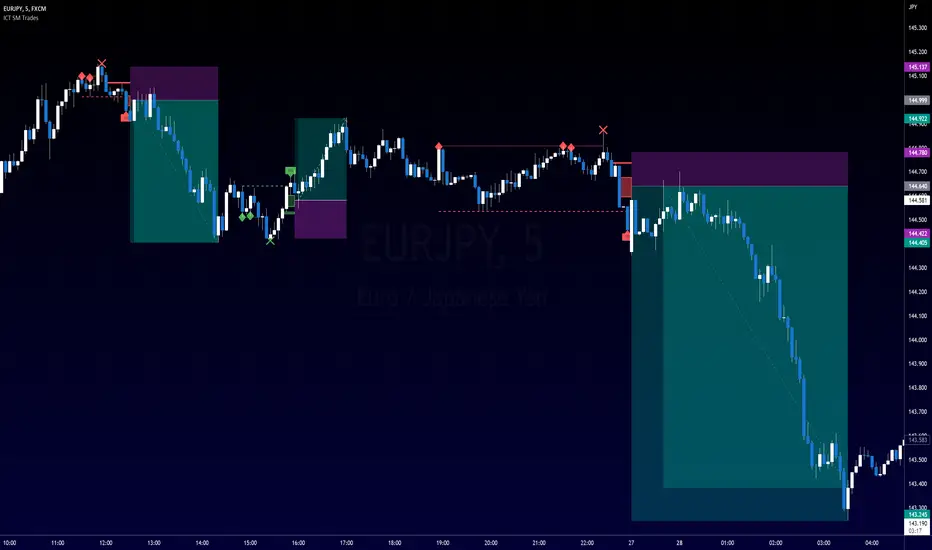
ICT SM Trades PREMIUMIndicator looks for ICT & Smart Money trades on any timeframe. These types of trades reveal how the big institutions, banks and hedge funds trade with big money. If they want their very big positions to be filled they need to find areas in chart where the majority of the money is sitting. Where is it? Where is the majority of orders placed? Right below supports or right above resistance, these orders are stoplosses or stop orders. So they need to push the price to these areas, take all the available stoplosses and trigger all the available stop orders in order to fill their positions and then push the price to the opposite side to make profit (and retail to lose).
Indicator looks for support or resistance (S/R) areas which are represented by dotted lines. This S/R areas are created by minimum of 2 pivot high/low (H/L). Every pivot H/L that creates the S/R area is marked with diamond label. This S/R area is called liquidity. After liquidity is created, indicator looks for liquidity grab (mostly represented by fast spike to this area - it is labeled with x-cross) and then price should go fast to the opposite side of the created structure. Indicator considers as a created structure everything that was created on the other side of the candles from the oldest pivot H/L which creates particular liquidity. For example, if liquidity is created with 3 pivot highs, indicator looks at the oldest pivot high and from there it is looking for the lowest low. Under this lowest low is dashed line which means that this level should be broken with closed candle. This action is called market structure shift (MSS), when the price shifted very fast from highs to lows. After MSS, when the price went fast to one direction, there were some imbalances in prices, in our example selling pressure was a lot bigger than buying pressure and there were created some long untested bearish candles. This untested areas in candles are called imbalances or gaps of fair value gaps (FVG). These are labeled with rectangles. It is expected that these gaps will be tested in near future to "balance the market".
We can put limit orders into these gaps (or into order blocks in PREMIUM indicator) and await some retracement after MSS to open our positions and after the positions are opened we can expect trend continuation in the direction where market structure shift was made (away from liquidity grab). So stoplosses can be placed above/below liquidity grab candle (marked with x-cross).
Alerts can be set for MSS to Long & Short and for liquidity grabs to Long & Short.
All settings of this indicator should be self-explanatory and most of them have tooltips for better understanding.
ICT SM Trades (liquidity find & grab, MSS, FVG, killzones)Indicator looks for ICT & Smart Money trades on any timeframe. These types of trades reveal how the big institutions, banks and hedge funds trade with big money. If they want their very big positions to be filled they need to find areas in chart where the majority of the money is sitting. Where is it? Where is the majority of orders placed? Right below supports or right above resistance, these orders are stoplosses or stop orders. So they need to push the price to these areas, take all the available stoplosses and trigger all the available stop orders in order to fill their positions and then push the price to the opposite side to make profit (and retail to lose).
Indicator looks for support or resistance (S/R) areas which are represented by dotted lines. This S/R areas are created by minimum of 2 pivot high/low (H/L). Every pivot H/L that creates the S/R area is marked with diamond label. This S/R area is called liquidity. After liquidity is created, indicator looks for liquidity grab (mostly represented by fast spike to this area - it is labeled with x-cross) and then price should go fast to the opposite side of the created structure. Indicator considers as a created structure everything that was created on the other side of the candles from the oldest pivot H/L which creates particular liquidity. For example, if liquidity is created with 3 pivot highs, indicator looks at the oldest pivot high and from there it is looking for the lowest low. Under this lowest low is dashed line which means that this level should be broken with closed candle. This action is called market structure shift (MSS), when the price shifted very fast from highs to lows. After MSS, when the price went fast to one direction, there were some imbalances in prices, in our example selling pressure was a lot bigger than buying pressure and there were created some long untested bearish candles. This untested areas in candles are called imbalances or gaps of fair value gaps (FVG). These are labeled with rectangles. It is expected that these gaps will be tested in near future to "balance the market".
We can put limit orders into these gaps and await some retracement after MSS to open our positions and after the positions are opened we can expect trend continuation in the direction where market structure shift was made (away from liquidity grab). So stoplosses can be placed above/below liquidity grab candle (marked with x-cross).
In settings of the indicator you can set whether only long or only short trades will be shown. Long trades are green and short trades are red. You can set if fair value gaps will be shown as well. The last thing in settings is session. You can set custom session which will be shown as background color on your chart.