ICT Macro w/ AlertsWhat it does :
- Highlights the exact 20-minute ICT Macro windows (09:50–10:10, 10:50–11:10, etc.) in real New York time
- One-click “ALL xx:50–xx:10 every hour” mode for London, Asian, or full-day trading
- Optional orange background + black “ICT MACRO” label
- Powerful alert functions that only fire from Sunday 6:00pm to Friday 5:00 PM EST.
How to use it as a perfect filter:
1) Add this script to your chart
2) Add your main strategy (FVG, Order Block, Silver Bullet, etc.)
3) Create alert on your main strategy → in the condition dropdown choose
“Inside Active ICT Macro”
Result: dramatically higher win rate because you only trade when institutions are most active.
Macros

Extended MacrosExtended Macro Times from XX:42 to XX:15.
These are the times to trade and when the Smart Money Reversal is likely to occur.

Equinox Wolf - ICT MacrosEquinox Wolf – ICT Macros plots the key ICT session macro windows on your chart so you can focus on how price behaves inside each time range. The script anchors every session to America/New_York time, updates live or in backtesting, and only keeps the current trading day on screen, avoiding clutter from prior sessions. Each window can be toggled individually, the box fill, borders, and high/low/equilibrium levels share global color and style controls, and the levels extend forward until the next macro begins. Use it to highlight the ICT LND, NYAM, lunch, afternoon, and final-hour ranges and monitor how price reacts around their highs, lows, and midpoints.

ICT Killzones & MacrosICT Killzones & Macros (v1.1.5) — configurable ICT session windows + refined “macro” windows with live High/Low levels, optional extensions, next-window previews, and lightweight opening-price lines. Built to be clock-robust, timezone-aware, and performant on intraday charts.
Tip: All times are interpreted in your chosen IANA timezone (default: America/New_York) and auto-handle DST. You can rename, recolor, enable/disable, and retime every window.
What it plots
- Killzones (5) : Asia (19:00–02:00), London (02:00–05:00), NY AM (07:00–09:30), London Close (10:00–12:00), NY PM (13:30–16:00) — full-height boxes with optional header.
- Macros (8) (defaults tailored for common ICT “refined” windows): Asia-1 (18:00–21:00), Asia-2 (21:00–00:00), London-1 (01:00–04:00), AM-1 (09:45–10:15), AM-2 (10:45–11:15), Lunch (12:00–13:00), PM-1 (13:30–14:30), Power Hour (15:10–16:00).
- Live High/Low lines for the current Macro/Killzone window.
- Optional HL extension to the right until price crosses or the trading day rolls (style selectable).
- “Next” previews : earliest upcoming Macro and Killzone header; optional next-window background band.
- Opening Prices (3 lightweight time lines) : defaults 00:00, 08:30, 09:30 with right-edge labels, scoped to a session you choose (auto-cleans at session end).
- Key inputs & styling
- General : Timezone (IANA), “Sessions to show” (per window) to keep only the last N completed windows.
- Header : height (ticks), gap (ticks), fill opacity, border width/style, text size/color, toggle “Next Macro/Killzone” headers.
- Boxes : global fill opacity, global border width/style (used by both Macros & Killzones).
- High/Low : show HL, HL line style, extend on/off + extension style, optional extension labels.
- Opening Prices : enable Time 1/2/3, set HH:MM for each, session window, per-line colors, style (dotted/dashed/solid), width.
- Per-window controls : each Macro/Killzone has Enable, Session (HHMM-HHMM), Label, Fill color.
How to use (quick start)
- Set Timezone to your preference (default America/New_York).
- Toggle on the Macros and Killzones you trade. Adjust session times if needed.
- (Optional) Turn on Extend High/Low to project levels until crossed/day-roll.
- (Optional) Enable Next… headers to see the next upcoming window at a glance.
- (Optional) Configure Opening Prices (00:00 / 08:30 / 09:30 by default) and the session over which they appear.
Behavior & notes
- Time windows are computed by clock, not by guessing bar timestamps, making them robust across brokers and timeframes.
- With HL extension on, the current window’s levels extend until crossed or the end of the trading day (in your timezone). With it off, completed windows keep static HL markers (limited by “Sessions to show”).
- “Sessions to show” applies per Macro/Killzone to automatically prune older windows and keep charts snappy.
- Opening-price lines exist only within the chosen “Opening Prices Session” and are removed when it ends (keeps charts clean).
Defaults (color cues)
Killzones: Asia (blue), London (purple), NY AM (green), London Close (yellow), NY PM (orange).
Macros: neutral greys with Lunch and PM accents out of the box (all customizable).
Performance tips
- Reduce “Sessions to show” if you scroll far back in history.
- Disable “Next…” previews and/or extension labels on very slow machines.
- Narrow the “Opening Prices Session” window to exactly when you need those lines.
Changelog highlights
- v1.1.5 : Internal refinements and stability.
- v1.1.3 : Live High/Low lines for current windows + optional extension.
- v1.1.2 : Added “next Killzone” preview (to match “next Macro”).
- v1.1.0 : Defaults updated (5 KZ, 8 Macros). Removed “snap-to-killzone” behavior.
- v1.0.0 : Independent Macro vs. Killzone rendering; cleaner header logic.
- Known limitations
If your chart warns about drawings, trim “Sessions to show”.
If your broker session times differ from NY hours, adjust the sessions or change the indicator timezone.
Credits & intent
Inspired by ICT timing concepts; provided for education/mark-up, not financial advice.
Built to be flexible so you can mirror your personal playbook and journaling workflow.

Auto Hourly Deviations {Module+}Description
This indicator automatically calculates and visualizes the prior hour’s price structure and its deviation levels. By combining core reference lines (high, low, EQ, quarters, open) with dynamic deviation levels and shaded zones, it provides a framework for understanding intraday price behavior relative to the most recent hourly range.
The tool has three functional sections that work together:
Core Hourly Structure – Captures the prior hour’s high, low, EQ (50%), and quarter levels (25% and 75%), plus the current open.
Deviation Levels – Projects standardized deviation multiples (±0.33, ±0.5, ±0.66, ±1.0, ±1.33, ±1.66, ±2.0) above and below the prior hour’s range.
Shading & Anchoring – Fills zones between key deviation levels for visual emphasis, while allowing projection offsets and anchor line references for precise chart alignment.
Together, these layers give traders a structured map of price movement around hourly ranges, making it easier to track expansion, retracement, and trend continuation.
1. Core Hourly Structure
Plots the prior hour’s high and low as key reference points.
Automatically calculates EQ (midpoint), 25%, and 75% levels.
Tracks the open of the current hour for immediate orientation.
Optional anchor line marks the start of each hourly window for time alignment.
Use: Frames the “hourly box” and subdivides it for intraday structure analysis.
2. Deviation Levels
Uses the prior hour’s range as a baseline.
Projects deviation levels above and below: ±0.33, ±0.5, ±0.66, ±1.0, ±1.33, ±1.66, and ±2.0.
Each level can be individually toggled with full line/label styling.
Use: Quantifies how far price is moving relative to the last hour’s volatility — useful for spotting overextensions, retraces, and probable reaction zones.
3. Shading & Anchoring
Shaded zones between selected deviation bands (e.g., +0.33 to +0.66 or +1.33 to +1.66) highlight potential liquidity or reaction areas.
Projection offsets allow levels to extend forward into future bars for planning.
Labels and color controls make the chart highly customizable.
Use: Provides quick visual cues for potential trading ranges and deviations without clutter.
Intended Use
This is a visualization tool, not a buy/sell system. Traders can use it to:
Track how price interacts with the prior hour’s high/low.
Measure hourly expansion through deviation levels.
Spot retracements or continuation zones inside and beyond the prior hour’s range.
Limitations & Disclaimers
Levels are derived from completed hourly candles; they do not predict outcomes.
Deviations are static calculations and do not account for fundamentals or volatility shifts.
This indicator does not provide financial advice or trading signals.
For informational and educational purposes only.
Trading involves risk; always apply proper risk management.
Closed-source (Protected): Logic is accessible on charts, but the source code is hidden. A TradingView paid plan is required for protected indicators.

Macro Times by OutOfOptionsThis indicator highlights macro times on the chart and provides visual and system alerts before a macro begins.
Unlike other macro indicators, this one supports unlimited macro configurations using the format 'HH:mm-HH:mm : Description' . By default, it includes a mix of ICT and Hydra macro times. Incorrect formatting in settings triggers an error, and clicking the "!" error message identifies the problematic configuration line.
You can customize all visual elements, including whether to display Top, Bottom, or 50% lines, highlight the macro zone, or label the macro.
To reduce chart clutter, you can also limit the number of past macros displayed.
For alerts, you can set the advance warning time in minutes and customize the visual alert style (e.g., a vertical line) if enabled.
The indicator is compatible with timeframes of 5 minutes or less; higher timeframes will generate an error.
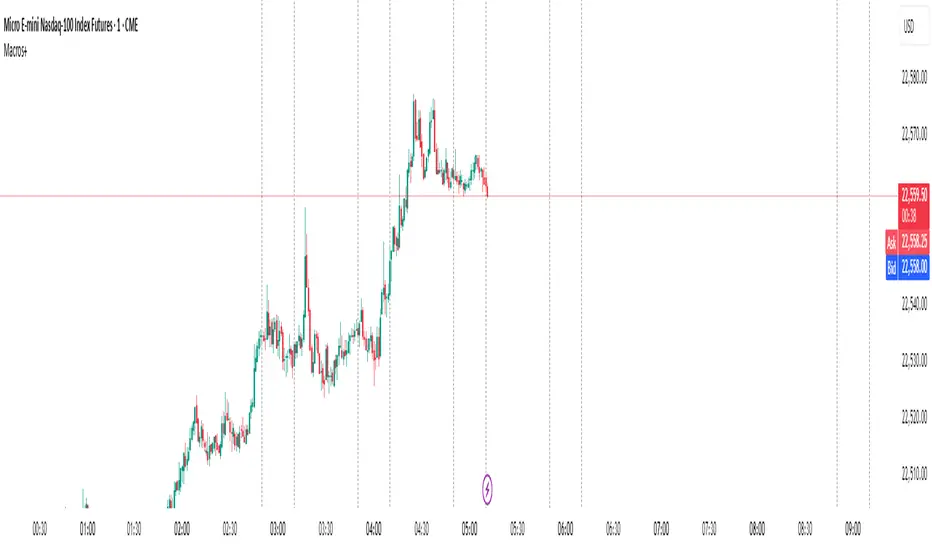
Predictive Time & AlertsPredictive Time Engine (ICT Macros)
Summary
The Predictive Time Engine is a visual tool designed specifically for traders who utilize Time & Price based methodologies, particularly those inspired by ICT (Inner Circle Trader) concepts.
The primary purpose of this indicator is to visualize the critical "time windows" where market liquidity is most likely to be significantly manipulated or distributed. Instead of only appearing in real-time, this indicator is predictive: at the beginning of each day, it will automatically calculate and draw all selected macro sessions for the day ahead, serving as your daily time roadmap.
With this tool, you will no longer miss these crucial moments and can be better prepared to anticipate price action.
Key Features
Predictive Visualization: Automatically projects and draws all macro time windows for the current trading day, giving you a forward-looking view of where the action is likely to occur.
ICT Macro Time Filter: Based on the "Hourly-Macros" concept, which are specific 20-minute periods within each hour (e.g., 09:50 - 10:10) where the price delivery algorithm (IPDA) is often active. You can select and enable each macro window you wish to monitor.
Full Customization: You have complete control over how the information is displayed. Choose between:
Outline: A clean, transparent box frame.
Background: A solid, colored background for the time zone.
Vertical Lines (Dotted, Dashed, Solid): Marks the beginning of each macro session with a vertical line in your chosen style.
Real-time Alerts: Set up notifications in TradingView to get an alert precisely when the price enters one of your selected Macro Time windows.
Automatic Management: Drawings from previous days are automatically cleared to keep your chart clean and focused on the current day's schedule.
The Concept Behind the Indicator
This indicator is inspired by the concept that the market moves in fractal Time Cycles, from yearly down to 90-minute periods. Each of these time cycles often follows a pattern of AMD (Accumulation, Manipulation, Distribution).
Accumulation: A phase of order gathering.
Manipulation: Price is often driven in the opposite direction of its true intent to sweep liquidity (stop losses).
Distribution: The true price move towards a liquidity target (Draw On Liquidity).
The Macro Time windows marked by this indicator are often the stage where the Manipulation phase or the beginning of the Distribution phase occurs. By knowing when these times are approaching, traders can be on high alert and look for confirming trade setups in the most potent areas and times.
How to Use
Configure Sessions: Open the indicator's Settings.
In the "1. General Settings" tab, ensure the Timezone matches your chart's local time (Default: "America/New_York").
In the "2. Active Macro Sessions" tab, check the box for each macro time window you want to monitor.
Choose Display Style: In "General Settings", select your preferred "Display Style" (Outline, Background, or various Line types). You can also change the color.
Set Up Alerts (Optional):
Click the "Alert" clock icon in the TradingView toolbar.
In the "Condition" section, select this indicator: Predictive Time Engine.
From the dropdown below it, ensure "Sesi Makro Dimulai" (Macro Session Start) is selected.
Set your desired notification options and click "Create".
Chart Interpretation: Use the marked time zones as high-alert areas. Pay close attention to how price reacts when entering or leaving these zones to find potential entry opportunities that align with your trading strategy.
Disclaimer: This tool is provided for educational and analytical purposes only. It is not financial advice. All trading decisions are solely your responsibility. Conduct your own research and manage your risk appropriately.
Quarterly Theory ICT 02 [TradingFinder] True Open Session 90 Min🔵 Introduction
The Quarterly Theory ICT indicator is an advanced analytical system built on ICT (Inner Circle Trader) concepts and fractal time. It divides time into four quarters (Q1, Q2, Q3, Q4), and is designed based on the consistent repetition of these phases across all trading timeframes (annual, monthly, weekly, daily, and even shorter trading sessions).
Each cycle consists of four distinct phases: the first phase (Q1) is the Accumulation phase, characterized by price consolidation; the second phase (Q2), known as Manipulation or Judas Swing, is marked by initial false movements indicating a potential shift; the third phase (Q3) is Distribution, where price volatility peaks; and the fourth phase (Q4) is Continuation/Reversal, determining whether the previous trend continues or reverses.
🔵 How to Use
The central concept of this strategy is the "True Open," which refers to the actual starting point of each time cycle. The True Open is typically defined at the beginning of the second phase (Q2) of each cycle. Prices trading above or below the True Open serve as a benchmark for predicting the market's potential direction and guiding trading decisions.
The practical application of the Quarterly Theory strategy relies on accurately identifying True Open points across various timeframes.
True Open points are defined as follows :
Yearly Cycle :
Q1: January, February, March
Q2: April, May, June (True Open: April Monthly Open)
Q3: July, August, September
Q4: October, November, December
Monthly Cycle :
Q1: First Monday of the month
Q2: Second Monday of the month (True Open: Daily Candle Open price on the second Monday)
Q3: Third Monday of the month
Q4: Fourth Monday of the month
Weekly Cycle :
Q1: Monday
Q2: Tuesday (True Open: Daily Candle Open Price on Tuesday)
Q3: Wednesday
Q4: Thursday
Daily Cycle :
Q1: 18:00 - 00:00 (Asian session)
Q2: 00:00 - 06:00 (True Open: Start of London Session)
Q3: 06:00 - 12:00 (NY AM)
Q4: 12:00 - 18:00 (NY PM)
90 Min Asian Session :
Q1: 18:00 - 19:30
Q2: 19:30 - 21:00 (True Open at 19:30)
Q3: 21:00 - 22:30
Q4: 22:30 - 00:00
90 Min London Session :
Q1: 00:00 - 01:30
Q2: 01:30 - 03:00 (True Open at 01:30)
Q3: 03:00 - 04:30
Q4: 04:30 - 06:00
90 Min New York AM Session :
Q1: 06:00 - 07:30
Q2: 07:30 - 09:00 (True Open at 07:30)
Q3: 09:00 - 10:30
Q4: 10:30 - 12:00
90 Min New York PM Session :
Q1: 12:00 - 13:30
Q2: 13:30 - 15:00 (True Open at 13:30)
Q3: 15:00 - 16:30
Q4: 16:30 - 18:00
Micro Cycle (22.5-Minute Quarters) : Each 90-minute quarter is further divided into four 22.5-minute sub-segments (Micro Sessions).
True Opens in these sessions are defined as follows :
Asian Micro Session :
True Session Open : 19:30 - 19:52:30
London Micro Session :
T rue Session Open : 01:30 - 01:52:30
New York AM Micro Session :
True Session Open : 07:30 - 07:52:30
New York PM Micro Session :
True Session Open : 13:30 - 13:52:30
By accurately identifying these True Open points across various timeframes, traders can effectively forecast the market direction, analyze price movements in detail, and optimize their trading positions. Prices trading above or below these key levels serve as critical benchmarks for determining market direction and making informed trading decisions.
🔵 Setting
Show True Range : Enable or disable the display of the True Range on the chart, including the option to customize the color.
Extend True Range Line : Choose how to extend the True Range line on the chart, with the following options:
None: No line extension
Right: Extend the line to the right
Left: Extend the line to the left
Both: Extend the line in both directions (left and right)
Show Table : Determines whether the table—which summarizes the phases (Q1 to Q4)—is displayed.
Show More Info : Adds additional details to the table, such as the name of the phase (Accumulation, Manipulation, Distribution, or Continuation/Reversal) or further specifics about each cycle.
🔵 Conclusion
The Quarterly Theory ICT, by dividing time into four distinct quarters (Q1, Q2, Q3, and Q4) and emphasizing the concept of the True Open, provides a structured and repeatable framework for analyzing price action across multiple time frames.
The consistent repetition of phases—Accumulation, Manipulation (Judas Swing), Distribution, and Continuation/Reversal—allows traders to effectively identify recurring price patterns and critical market turning points. Utilizing the True Open as a benchmark, traders can more accurately determine potential directional bias, optimize trade entries and exits, and manage risk effectively.
By incorporating principles of ICT (Inner Circle Trader) and fractal time, this strategy enhances market forecasting accuracy across annual, monthly, weekly, daily, and shorter trading sessions. This systematic approach helps traders gain deeper insight into market structure and confidently execute informed trading decisions.

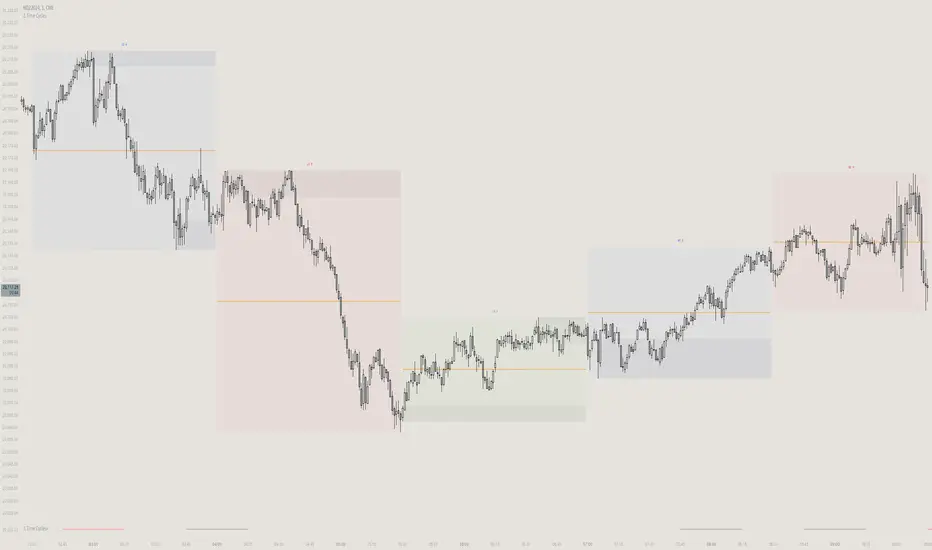
CandelaCharts - OHLC Macro Range Map 📝 Overview
Elevate your candlestick analysis with the OHLC Macro Range Map!
Unlike conventional OHLC charts, this advanced indicator weaves Inner Circle Trader (ICT) principles into its design, helping you decode accumulation, manipulation, and distribution patterns—candle by candle.
ICT traders recognize manipulation through wicks that extend against the candle’s closing direction—a deliberate move to mislead participants into unfavorable positions. These deceptive movements often hint at market manipulation phases. By decoding these subtle signals, traders can anticipate the distribution phase of a candle, where price action reveals potential liquidity targets, retracement zones, and key reversal points.
These levels offer valuable insights into order flow, revealing how price interacts with them and the sequence of movements within the market.
To enhance price analysis, the tool also monitors the average duration of manipulation and distribution phases. By blending historical timing patterns with key price levels associated with these phases, traders can conduct deeper analyses and fine-tune their strategies for better decision-making.
Although grounded in historical data, this indicator does not promise that past patterns will replicate in future market conditions. Instead, it provides a data-driven framework to identify moments when candles are likely to reverse after manipulation phases or retrace following completed distributions. This empowers traders to pinpoint potential market turning points with greater accuracy.
📦 Features
This tool offers a range of powerful features to enhance your trading analysis:
Average Range Accuracy : Simplify candlestick analysis with advanced lines and labels to pinpoint manipulation, distribution, and time pivots. Graph average ranges for your chosen timeframe to navigate market volatility and uncover key support and resistance zones.
Custom Timeframe Selection : Align your analysis with your trading strategy by choosing a timeframe that highlights the candle’s manipulation, distribution, and key timing.
Real-time Data Feed : Stay updated with live candlestick stats, with each new candle updating OHLC data and performing ongoing historical calculations, even on sub-minute timeframes.
Historical Mapping : Backtest past market scenarios with ease using the historical mapping feature. Traders can revisit and analyze previous data, refine strategies, and customize label displays for journaling flexibility.
User-Friendly Interface : Designed for advanced traders, the intuitive interface allows easy navigation and customization of display settings, offering a personalized experience for data-driven analysis.
⚙️ Settings
Macros: Sets the timeframe to which will be drawn.
Lookback: Controls period length in days.
Method: Sets the desired calculation algorithm.
History: Display Macro Range Map drawings for previous sessions.
Timezone: Dsiplay the data based on the selected timezone.
Opn: Style for Open line.
Man: Style for Manipulation line.
Dis: Style for Distribution line.
Time: Style for Timeline.
Labels: Controls the size and abbreviations.
Table Position: Manage the Macro Range Map table position
⚡️ Showcase
Here’s a visual showcase of the tool in action, highlighting its key features and capabilities:
Manipilation & Distribution
Time
📒 Usage
Here’s how you can use the OHLC Macro Range Map to enhance your analysis:
Add OHLC Macro Range Map to your Tradingview chart.
Select a timeframe and customize the styles to fit your preferences.
Watch as calculated manipulation, distribution, and delivery times align with your analysis.
Combine this data with other models and insights to strengthen your trading strategy.
Example 1
By following these steps, you'll unlock powerful insights to refine and elevate your trading strategies.
🔹 Notes
On Bullish candles:
Manipulation: Open - Low
Distribution: Open - High
On Bearish candles:
Manipulation: Open - High
Distribution: Open - Low
Available calculation methods:
Mean
Median
Price patterns on OHLC Macro Range Map:
Open - -Man - +Dis
Open - -Man - Open - +Dis
Open - -Man - +Man - +Dis
Open - -Man - +Man - -Dis
Open - +Man - -Dis
Open - +Man - Open - -Dis
Open - +Man - -Man - -Dis
Open - +Man - -Man - +Dis
🚨 Alerts
The indicator does not provide any alerts!
⚠️ Disclaimer
These tools are exclusively available on the TradingView platform.
Our charting tools are intended solely for informational and educational purposes and should not be regarded as financial, investment, or trading advice. They are not designed to predict market movements or offer specific recommendations. Users should be aware that past performance is not indicative of future results and should not rely on these tools for financial decisions. By using these charting tools, the purchaser agrees that the seller and creator hold no responsibility for any decisions made based on information provided by the tools. The purchaser assumes full responsibility and liability for any actions taken and their consequences, including potential financial losses or investment outcomes that may result from the use of these products.
By purchasing, the customer acknowledges and accepts that neither the seller nor the creator is liable for any undesired outcomes stemming from the development, sale, or use of these products. Additionally, the purchaser agrees to indemnify the seller from any liability. If invited through the Friends and Family Program, the purchaser understands that any provided discount code applies only to the initial purchase of Candela's subscription. The purchaser is responsible for canceling or requesting cancellation of their subscription if they choose not to continue at the full retail price. In the event the purchaser no longer wishes to use the products, they must unsubscribe from the membership service, if applicable.
We do not offer reimbursements, refunds, or chargebacks. Once these Terms are accepted at the time of purchase, no reimbursements, refunds, or chargebacks will be issued under any circumstances.
By continuing to use these charting tools, the user confirms their understanding and acceptance of these Terms as outlined in this disclaimer.

ICT Macro Sessions by @zeusbottradingICT Macro Sessions Indicator
The ICT Macro Sessions Indicator is a powerful tool designed for traders who follow the ICT (Inner Circle Trader) methodology and want to optimize their trading during specific high-probability time intervals. This indicator highlights all the key macro sessions throughout the trading day in the GMT+8 (Hong Kong) time zone.
What Does the Indicator Do?
This indicator visually marks ICT Macro Sessions on your trading chart using background colors and optional labels. Each session corresponds to specific time intervals when institutional activity is most likely to drive price action. By focusing on these periods, traders can align their strategies with market volatility and liquidity, increasing their chances of success.
Highlighted Sessions
The indicator covers all major ICT Macro Sessions, each with a unique color for easy identification:
London Macro 1 (15:33–16:00 GMT+8):
- Marks the early London session, often characterized by strong directional moves.
London Macro 2 (17:03–17:30 GMT+8):
- Captures the mid-London session, where price frequently reacts to liquidity levels.
New York AM Macro 1 (22:50–23:10 GMT+8):
- Highlights the start of the New York session, a prime time for price reversals or continuations.
New York AM Macro 2 (23:50–00:10 GMT+8):
- Focuses on late-morning New York activity, often aligning with key news releases.
New York Lunch Macro (00:50–01:10 GMT+8):
- Covers the lunch period in New York, where price may consolidate or set up for afternoon moves.
New York PM Macro 1 (02:10–02:40 GMT+8):
- Tracks post-lunch activity in New York, often featuring renewed volatility.
New York PM Macro 2 (04:15–04:45 GMT+8):
- Captures late-session moves as institutional traders finalize their positions.
Features of the Indicator
Fixed Time: The indicator is pre-configured for GMT+8 but it will adapt automatically to your timezone. No need to change anything in the code.
Background Highlighting: Each session is visually marked with a unique background color for quick recognition.
Optional Labels: Traders can enable or disable labels for each session, providing flexibility in how information is displayed.
Session Toggles: You can choose which sessions to display based on your trading preferences and strategy.
Intraday Timeframes: The indicator is optimized for intraday charts with timeframes of 45 minutes or less. You can change it to anything you like.
Why Use This Indicator?
The ICT Macro Sessions Indicator helps traders focus on the most critical times of the trading day when institutional activity is at its peak. These periods often coincide with significant price movements, making them ideal for scalping, day trading, or even swing trading setups. By visually highlighting these sessions, the indicator eliminates guesswork and allows traders to plan their trades with precision.

Macros ICT KillZones [TradingFinder] Times & Price Trading Setup🔵 Introduction
ICT Macros, developed by Michael Huddleston, also known as ICT (Inner Circle Trader), is a powerful trading tool designed to help traders identify the best trading opportunities during key time intervals like the London and New York trading sessions.
For traders aiming to capitalize on market volatility, liquidity shifts, and Fair Value Gaps (FVG), understanding and using these critical time zones can significantly improve trading outcomes.
In today’s highly competitive financial markets, identifying the moments when the market is seeking buy-side or sell-side liquidity, or filling price imbalances, is essential for maximizing profitability.
The ICT Macros indicator is built on the renowned ICT time and price theory, which enables traders to track and leverage key market dynamics such as breaks of highs and lows, imbalances, and liquidity hunts.
This indicator automatically detects crucial market times and optimizes strategies for traders by highlighting the specific moments when price movements are most likely to occur. A standout feature of ICT Macros is its automatic adjustment for Daylight Saving Time (DST), ensuring that traders remain synced with the correct session times.
This means you can rely on accurate market timing without the need for manual updates, allowing you to focus on capturing profitable trades during critical timeframes.
🔵 How to Use
The ICT Macros indicator helps you capitalize on trading opportunities during key market moments, particularly when the market is breaking highs or lows, filling Fair Value Gaps (FVG), or addressing imbalances. This indicator is particularly beneficial for traders who seek to identify liquidity, market volatility, and price imbalances.
🟣 Sessions
London Sessions
London Macro 1 :
UTC Time : 06:33 to 07:00
New York Time : 02:33 to 03:00
London Macro 2 :
UTC Time : 08:03 to 08:30
New York Time : 04:03 to 04:30
New York Sessions
New York Macro AM 1 :
UTC Time : 12:50 to 13:10
New York Time : 08:50 to 09:10
New York Macro AM 2 :
UTC Time : 13:50 to 14:10
New York Time : 09:50 to 10:10
New York Macro AM 3 :
UTC Time : 14:50 to 15:10
New York Time : 10:50 to 11:10
New York Lunch Macro :
UTC Time : 15:50 to 16:10
New York Time : 11:50 to 12:10
New York PM Macro :
UTC Time : 17:10 to 17:40
New York Time : 13:10 to 13:40
New York Last Hour Macro :
UTC Time : 19:15 to 19:45
New York Time : 15:15 to 15:45
These time intervals adjust automatically based on Daylight Saving Time (DST), helping traders to enter or exit trades during key market moments when price volatility is high.
Below are the main applications of this tool and how to incorporate it into your trading strategies :
🟣 Combining ICT Macros with Trading Strategies
The ICT Macros indicator can easily be used in conjunction with various trading strategies. Two well-known strategies that can be combined with this indicator include:
ICT 2022 Trading Model : This model is designed based on identifying market liquidity, structural price changes, and Fair Value Gaps (FVG). By using ICT Macros, you can identify the key time intervals when the market is seeking liquidity, filling imbalances, or breaking through important highs and lows, allowing you to enter or exit trades at the right moment.
Silver Bullet Strategy : This strategy, which is built around liquidity hunting and rapid price movements, can work more accurately with the help of ICT Macros. The indicator pinpoints precise liquidity times, helping traders take advantage of market shifts caused by filling Fair Value Gaps or correcting imbalances.
🟣 Capitalizing on Price Volatility During Key Times
Large market algorithms often seek liquidity or fill Fair Value Gaps (FVG) during the intervals marked by ICT Macros. These periods are when price volatility increases, and traders can use these moments to enter or exit trades.
For example, if sell-side liquidity is drained and the market fills an imbalance, the price might move toward buy-side liquidity. By identifying these moments, which may also involve breaking a previous high or low, you can leverage rapid market fluctuations to your advantage.
🟣 Identifying Liquidity and Price Imbalances
One of the important uses of ICT Macros is identifying points where the market is seeking liquidity and correcting imbalances. You can determine high or low liquidity levels in the market before each ICT Macro, as well as Fair Value Gaps (FVG) and price imbalances that need to be filled, using them to adjust your trading strategy. This capability allows you to manage trades based on liquidity shifts or imbalance corrections without needing a bias toward a specific direction.
🔵 Settings
The ICT Macros indicator offers various customization options, allowing users to tailor it to their specific needs. Below are the main settings:
Time Zone Mode : You can select one of the following options to define how time is displayed:
UTC : For traders who need to work with Universal Time.
Session Local Time : The local time corresponding to the London or New York markets.
Your Time Zone : You can specify your own time zone (e.g., "UTC-4:00").
Your Time Zone : If you choose "Your Time Zone," you can set your specific time zone. By default, this is set to UTC-4:00.
Show Range Time : This option allows you to display the time range of each session on the chart. If enabled, the exact start and end times of each interval are shown.
Show or Hide Time Ranges : Toggle on/off for visual clarity depending on user preference.
Custom Colors : Set distinct colors for each session, allowing users to personalize their chart based on their trading style.These settings allow you to adjust the key time intervals of each trading session to your preference and customize the time format according to your own needs.
🔵 Conclusion
The ICT Macros indicator is a powerful tool for traders, helping them to identify key time intervals where the market seeks liquidity or fills Fair Value Gaps (FVG), corrects imbalances, and breaks highs or lows. This tool is especially valuable for traders using liquidity-based strategies such as ICT 2022 or Silver Bullet.
One of the key features of this indicator is its support for Daylight Saving Time (DST), ensuring you are always in sync with the correct trading session timings without manual adjustments. This is particularly beneficial for traders operating across different time zones.
With ICT Macros, you can capitalize on crucial market opportunities during sensitive times, take advantage of imbalances, and enhance your trading strategies based on market volatility, liquidity shifts, and Fair Value Gaps.

Killzones And Macros LibraryKillzones & Macros Library for Trading Sessions
This Pine Script library is designed to help traders identify and act during high-volatility trading windows, commonly referred to as "Killzones." These are specific times during the day when institutional traders are most active, resulting in increased liquidity and price movement. The library provides boolean fields that return true when the current time falls within one of the killzones or macroeconomic event windows, allowing for enhanced trade timing and precision.
Killzones Include:
London Open, New York Open, Midnight Open, London Lunch, New York PM, and more.
Capture high-volume periods like Power Hour, Equities Open, and Asian Range.
Macros:
Identify key moments like London 02:33, New York 08:50, and other significant times aligned with market movements or events.
This library is perfect for integrating into your custom strategies, backtesting, or setting alerts for optimal trade execution during major trading sessions and events.

itradesize /\ Time Cycles x Zeussy supplementaryThis is a supplementary script to my previous itradesize /\ Time Cycles x Zeussy script. It should be displayed in a new pane.
This script will display the 30 and 90 AMD Time Cycles, along with the Asia, London, and New York AM & PM sessions in a new pane, based on the times taught by Zeussy.
You have the option to customize which cycles you would like to display, as well as the arrangement of the cycles based on the location of the pane (above or below the current chart).
The script can also be used for backtesting; just uncheck the 'Draw Today's Only' option.
Session timings are as follows:
Asia: 20:00 - 00:00
London: 02:30 - 07:00
NY AM: 07:00 - 11:30
NY PM: 11:30 - 16:00
London Cycles:
- 02:30 - 04:00
- 04:00 - 05:30
- 05:30 - 07:00
AM Cycles:
- 07:00 - 08:30
- 08:30 - 10:00
- 10:00 - 11:30
PM Cycles:
- 11:30 - 13:00
- 13:00 - 14:30
- 14:30 - 16:00
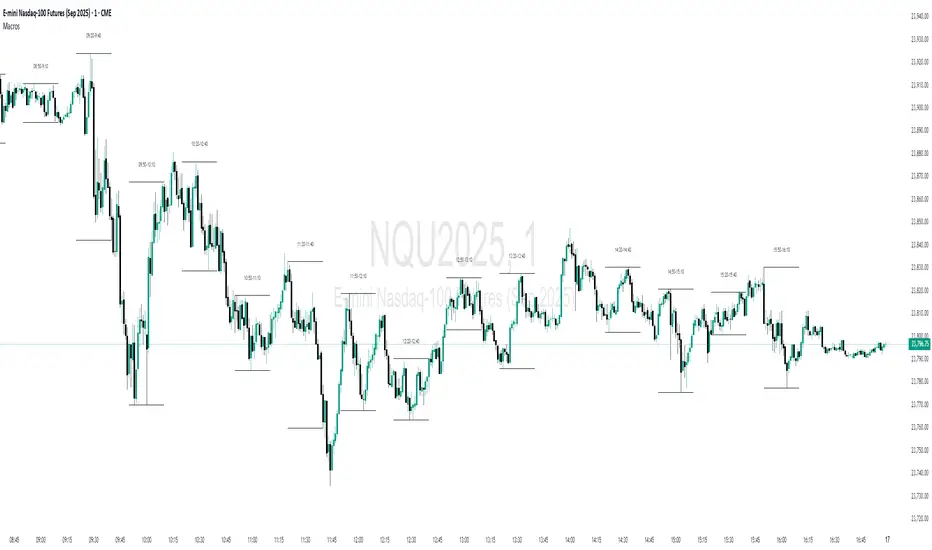
ICT Hydra MacrosThis indicator allows you to set a colored box at each time frame specified as Macro.
The purpose of this customizable color box is to be able to identify the start and end of the desired time frame, as well as the highest and lowest price during that time frame.
It also allows to place the schedule in numbers inside the box in order to quickly identify the painted time frame.
The indicator has up to 26 customizable boxes both in time frame and color. This allows to have different time frames that each Trader considers convenient for his strategy.
Settings:
General Settings:
Limit Days to Draw: Indicates the number of past days in which boxes will be drawn. Default value is 5 past days.
Timeframe Limit: Indicates the maximum time frame in which the boxes will be displayed. Default value is 5 minutes.
Timezone: Indicates the desired Timezone to calculate the schedules that will be configured later.
Macros Settings:
Show Macros Boxes: Enables or disables all boxes. It is enabled by default.
Display Text: Enables or disables all labels inside the boxes containing the time frame corresponding to the box. It is enabled by default.
Macros Transparency: Indicates the transparency percentage of the selected color for all boxes. By default it contains a value of 80% transparency.
Macro 1-26: Indicates the start time and end time, as well as the color of the individual box. Each Macro can be enabled or disabled individually. Note that the boxes of each Macro will be visible only if the "Show Macros Boxes" property is enabled. By default, there are specified certain Macros or time frames with a duration of 20 minutes, which are Manipulation or Expansion Macros that mentor Hydra has taught us based on the knowledge that ICT has provided for everyone.
The objective of this indicator is to provide a visual tool on the Macros or Time Frames in which the Trader can easily observe the desired schedule and which will automatically adjust according to the time and price on all 4 sides of the box.

Daye Quarterly Theory ~ DQT [Liquidity_Pro]Thanks
This indicator puts the time-based research of trader Daye on your chart. Daye studied the ICT killzones and macro times and presented his findings, as “Quarterly Theory” on YouTube. Thank you Daye for sharing!
This indicator is not the first, so S/O to @toodegrees, @a1tmaniac and @joshuuu for their own excellent Quarterly Theory indicators. Last but not least, huge thanks go to ICT for his trading innovation and generous free price action education and to @twingall for his insight, attention to detail and great teamwork coding this indicator.
Daye’s Quarterly Theory
First, the fundamental concept is that all units of time can be divided by four into quarters -- just as we look at the year’s corporate reporting cycle of Q1, Q2, Q3, and Q4.
Dividing the day by four, into six hour quarters and again into 90 minute quarters and again into 22.5 minute ‘Micro’ quarters we reach the smallest unit shown by this indicator. Apply it to your NQ1! or ES1! charts and you may see remarkable confluence with the ICT macro times!
Why would we want to do this? It helps us understand, visualize and predict ICT’s PO3 concept:
• A - Accumulation (required for a cycle to occur)
• M - Manipulation
• D - Distribution
• X - Reversal/Continuation
The bottom line - we want to sell after a manipulation (M) up, or buy after a manipulation down and Quarterly Theory plots times on your chart where this may occur. Every asset is different, so back-test and research it.
Note, this indicator always shows Q1 as the accumulation quarter (by color), but the order is not fixed and instead of AMDX may appear as XAMD, where Q1 is the Reversal/Continuation quarter. We may eventually offer an update to this indicator which would automatically transpose the quarter colors for you.
The Quarters
Yearly:
• Q1 - Jan, Feb, Mar
• Q2 - Apr, May, Jun
• Q3 - Jul, Aug, Sep
• Q4 - Oct, Nov, Dec
Monthly (starts with the first month’s Monday regardless of the date):
• Q1 - Week 1, first Monday of the month
• Q2 - Week 2, second Monday of the month
• Q3 - Week 3, third Monday of the month
• Q4 - Week 4, fourth Monday of the month
Weekly (Daye ignores Friday and Sunday’s price action):
• Q1 - Mon
• Q2 - Tue
• Q3 - Wed
• Q4 - Thu
Daily (times are all EST / New York):
• Q1 - 18:00 - 00:00 Asia
• Q2 - 00:00 - 06:00 London
• Q3 - 06:00 - 12:00 NY AM
• Q4 - 12:00 - 18:00 NY PM
90 Minute:
• Q1 - 18:00 - 19:30
• Q2 - 19:30 - 21:00
• Q3 - 21:00 - 22:30
• Q4 - 22:30 - 00:00
Micro (22.5 minute quarters, DQT only displays Micros on 7 minute TF or lower)
• Q1 - 18:00 - 18:22:30
• Q2 - 18:22:30 - 18:45
• Q3 - 18:45 - 19:07:30
• Q4 - 19:07:30 - 19:30
About the DQT Indicator
This indicator plots the quarterly time boxes in a panel which can be placed above or below your chart. It allows you to add labels with the opening time and dates and also place time of day markers which can be useful for anyone who wants to mark lunch, and of the trading day or perhaps a favorite ICT macro time. It also works on GOLD (CAPITALCOM), DXY (TVC), currencies and stocks in Regular Trading Hour (RTH) mode.
Note the way that the indicator displays quarters is affected by the time frame you are viewing and as a result you may notice imperfections. Also, the indicator is not tuned to work with every broker, so for example with DXY, you will see the TVC feed is displayed nicely but other feeds are not.
Settings
The DQT indicator offers a great deal of flexibility to customize the display of quarters aesthetically. But it’s designed to work out-of-the-box on both light and dark background charts. It's set up to only show 90 minute and micro quarters initially, but in the settings, you can turn on the daily, weekly, monthly, and yearly quarters. Remember you will only see the Micros on the 7 minute TF or lower.
Lastly, the DQT indicator works well with our DOB indicator allowing you to visualize the confluence of high timeframe PDAs or POIs with manipulation quarters.
If you find our indicators useful, please boost, comment and share -- it's very motivational for us to develop them further and publish new ones!

ICT Times [joshu]This TradingView indicator provides a comprehensive view of ICT killzones, Silver Bullet times, and ICT Macros, enhancing your trading experience.
In those time windows price either seeks liquidity or imbalances and you often find the most energetic price moves and turning points.
Features:
Automatic Adaptation: The ICT killzones intelligently adapt to the specific chart you are using. For Forex charts, it follows the ICT Forex times:
Asia: 2000-0000
London: 0200-0500
New York: 0700-1000
London Close: 1000-1200
For other charts, it uses the following session times:
Asia: 2000-0000
London: 0200-0500
New York AM: 0830-1100
New York PM: 1330-1600
Silver Bullet Times:
0300-0400
1000-1100
1400-1500
How to Use:
Simply apply the indicator to your chart, and the session boxes and Silver Bullet times will be plotted automatically.

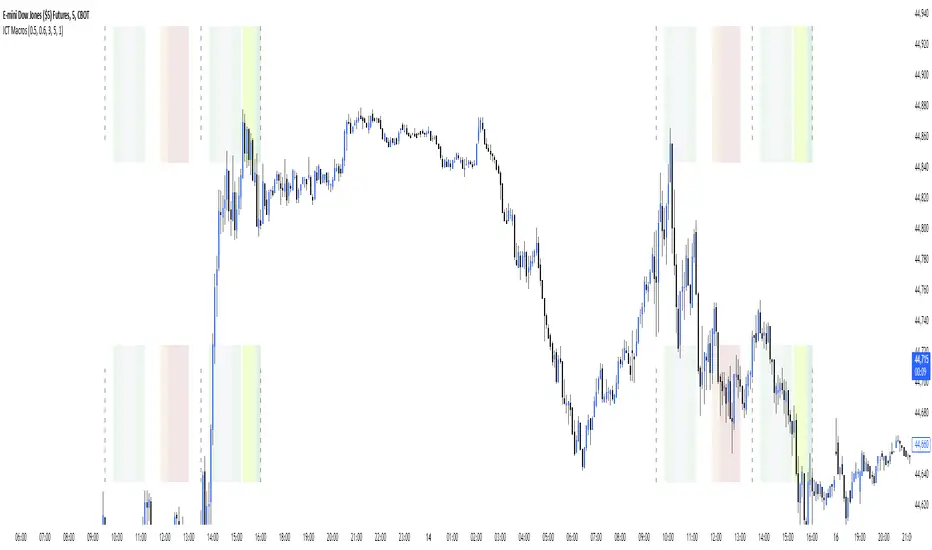
ICT Macros [LuxAlgo]The ICT Macros indicator aims to highlight & classify ICT Macros, which are time intervals where algorithmic trading takes place to interact with existing liquidity or to create new liquidity.
🔶 SETTINGS
🔹 Macros
Macro Time options (such as '09:50 AM 10:10'): Enable specific macro display.
Top Line , Mid Line , Bottom Line and Extending Lines options: Controls the lines for the specific macro.
🔹 Macro Classification
Length : A length to detect Market Structure Brakes and classify macro type based on detection.
Swing Area : Swing or Liquidity Area selection, highest/lowest of the wick or the candle bodies.
Accumulation , Manipulation and Expansion color options for the classified macros.
🔹 Others
Macro Texts : Controls both the size and the visibility of the macro text.
Alert Macro Times in Advance (Minutes) : This option will plot a vertical line presenting the start of the next macro time. The line will not appear all the time, but it will be there based on remaining minutes specified in the option.
Daylight Saving Time (DST) : Adjust time appropriate to Daylight Saving Time of the specific region.
🔶 USAGE
A macro is a way to automate a task or procedure which you perform on a regular basis.
In the context of ICT's teachings, a macro is a small program or set of instructions that unfolds within an algorithm, which influences price movements in the market. These macros operate at specific times and can be related to price runs from one level to another or certain market behaviors during specific time intervals. They help traders anticipate market movements and potential setups during specific time intervals.
To trade these effectively, it is important to understand the time of day when certain macros come into play, and it is strongly advised to introduce the concept of liquidity in your analysis.
Macros can be classified into three categories where the Macro classification is calculated based on the Market Structure prior to macro and the Market Structure during the macro duration:
Manipulation Macro
Manipulation macros are characterized by liquidity being swept both on the buyside and sellside.
Expansion Macro
Expansion macros are characterized by liquidity being swept only on the buyside or sellside. Prices within these macros are highly correlated with the overall trend.
Accumulation Macro
Accumulation macros are characterized by an accumulation of liquidity. Prices within these macros tend to range.
The script returns the maximum/minimum price values reached during the macro interval alongside the average between the maximum/minimum and extends them until a new macro starts. These levels can act as supports and resistances.
🔶 DETAILS
All required data for the macro detection and classification is retrieved using 1 minute data sets, this includes candles as well as pivot/swing highs and lows. This approach guarantees the visually presented objects are same (same highs/lows) on higher timeframes as well as the macro classification remain same as it is in 1 min charts.
8 Macros can be displayed by the script (4 are enabled by default):
02:33 AM 03:00 London Macro
04:03 AM 04:30 London Macro
08:50 AM 09:10 New York Macro
09:50 AM 10:10 New York Macro
10:50 AM 11:10 New York Macro
11:50 AM 12:10 New York Launch Macro
13:10 PM 13:40 New York Macro
15:15 PM 15:45 New York Macro
🔶 ALERTS
When an alert is configured, the user will have the ability to be notified in advance of the next Macro time, where the value specified in 'Alert Macro Times in Advance (Minutes)' option indicates how early to be notified.
🔶 LIMITATIONS
The script is supported on 1 min, 3 mins and 5 mins charts.
🔶 RELATED SCRIPTS

ICT MakrosThis script highlights the ICT trading makros and silverbullet timewindows with different background colors on your chart. The drawings are only visible on the timeframe 1min - 5min because they become useless above and i didnt code the logic for below 1min