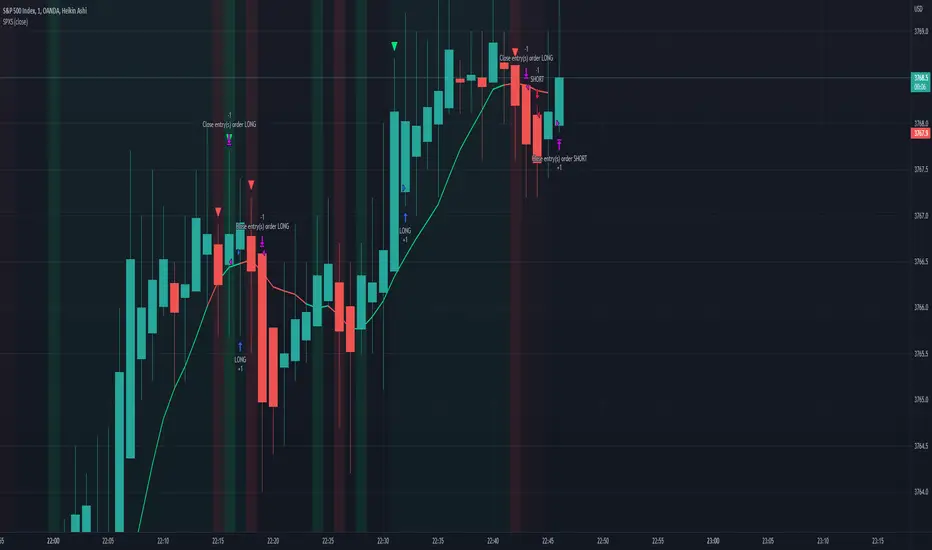
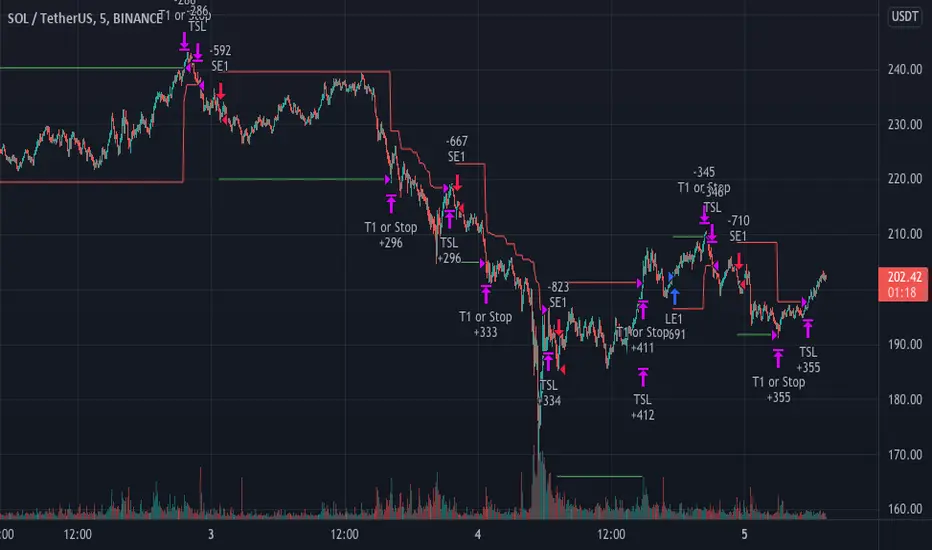
SPX Scalping StrategyThis strategy points out good entries and exits to go with the direction of SPY
Used with:
Ticker: SPX 500 USD
Heiken Ashi Candles
1, 3, 5 min timeframe
Macd-v
Adaptive, Zero lag Schaff Trend Cycle Backtest (Simple) [Loxx]Simple backtest for "Adaptive, Zero lag Schaff Trend Cycle" found here:
What this backtest includes:
-Customization of inputs for Schaff Trend Cycle calculation
-Take profit 1 (TP1), and Stop-loss (SL), calculated using standard RMA-smoothed true range
-Activation of TP1 after entry candle closes
-Zero-cross entry signal plots
-Longs and shorts
-Continuation longs and shorts
Happy trading!

Cyatophilum 3Commas DCA Bot BacktesterAn indicator to backtest and automate 3Commas DCA Bots.
═════════════════════════════════════════════════════════════════════════
█ HOW IT WORKS
The indicator allows you to replicate your bot settings and get backtest results from the Strategy Tester and also a backtest panel with additional information on the safety orders.
You can also create alerts for each of the strategy events.
█ HOW TO USE
Choose a symbol that corresponds to your bot pair and exchange.
Pick a chart time frame as small as possible, usually 1 minute. The timeframe should always be smaller or equal to the deal start conditions timeframes.
Always use regular candle type.
Configure your deal start condition . You can combine several technical indicators to trigger an entry using a AND logical gate.
Configure your profit target
Use the Take Profit feature to set a target in percentage of price. You can also make it trail.
There is also a Stop Loss feature that is turned off by default.
Configure your safety orders
Replicate the safety orders from your bot into the indicator inputs.
Check your backtest parameters
Make sure that the initial capital and order size make sense. Since it is a pyramiding strategy with safety orders, the sum of all deals should not be bigger than the initial capital.
In this example: Initial capital is 0.02 BTC, which around 600$. I used 1000$ to be safe.
If you use % equity as order size, please note that it will create compounding.
Check the fees, by default they are set to 0.1%.
I also recommend to set a slippage that corresponds to your exchange's spread.
█ FEATURES
• Strategy direction
Configure wether to go long or short.
• Deal Start Conditions
The current conditions available are:
- Up to 4 MTF Trading View ratings conditions (Buy/Sell, Strong Buy/Sell)
- Up to 4 MTF RSI with configurable start conditions (Less/Greater than, Crossing Up/Down)
- Up to 2 MTF Ultimate Oscillator with configurable start conditions (Less/Greater than, Crossing Up/Down)
- MTF BB%-20-1 (length-deviation) with configurable start conditions (Less/Greater than, Crossing Up/Down)
- MTF BB%-20-2 (length-deviation) with configurable start conditions (Less/Greater than, Crossing Up/Down)
- Up to 2 MTF TA presets with the following options (Bollinger Bands, MFI, CCI, MACD, PSAR, SMA crosses, Heikin Ashi)
• Stop Loss and Take Profit
Configure your stop loss and take profit for long and short trades.
You can also make a trailing take profit.
• DCA (Safety orders)
Create up to 100 safety orders with configurable options for step and volume scaling, take profit from total volume, base and safety order size.
• Backtest Settings
Choose a backtest period, longs or shorts, wether to use limit orders or not.
Graphics
A Configuration panel with all the indicator settings, useful for sharing/saving a strategy.
A Backtest Results panel with additional information from the strategy tester.
█ ALERTS
The indicator is using the alert() calls: it only uses 1 alert slot to send order messages for each event (Long/Short entry, stop loss, take profit, safety order). This means free TV plans can create 1 complete strategy.
To set your alert messages, open the indicator settings and scroll to the bottom of the "inputs" tab.
Create your alert after you set the messages in the indicator settings, and make sure "Any alert() function call" is set in the alert option.
█ BACKTEST RESULTS
The backtest settings used in this snapshot are the following:
Initial Capital: 1000€
Order size: 0.003 BTC
Commission: 0.1 % per order
Slippage : 1 tick
Please read the author instructions below for access.

Hybrid, Zero lag, Adaptive cycle MACD Backtest (Simple) [Loxx]Simple backtest for Hybrid, Zero lag, Adaptive cycle MACD Backtest (Simple) found here:
What this backtest includes:
-Customization of inputs for MACD calculation
-Take profit 1 (TP1), and Stop-loss (SL), calculated using standard RMA-smoothed true range
-Activation of TP1 after entry candle closes
-Zero-cross entry signal plots
-MACD-Signal cross entry continuations
-Longs and shorts
Happy trading!

5 Minute Scalping StrategyTaking entrys based on the 1 minute timeframe MACD
only taking longs when all emas are in the correct order and there is a bigger than usual MACD downtick and the RSI is above 51
only taking shorts when all emas are in the opposite order and there is a bigger than usual uptick on the MACD and the RSI is bellow 49
bigger than usual ticks are defined by bollinger bands around the Macd and the ticks have to be higher than 35 and lower than -10
you can change whatever setting you like to make the strategy more profitible. pls share when you find a more profitible setting than me
the stoploss doesnt work correct if it would be hit in the same candle you enter the trade. pls share when you have a solution for this
the stratagy is profitible when i backtested it for the last month, but i dont know how it will play out in the future, so you enter the signals at your own risk

Customizable Non-Repainting HTF MACD MFI Scalper Bot StrategyThis script was originally shared by Wunderbit as a free open source script for the community to work with.
WHAT THIS SCRIPT DOES:
It is intended for use on an algorithmic bot trading platform but can be used for scalping and manual trading.
This strategy is based on the trend-following momentum indicator . It includes the Money Flow index as an additional point for entry.
HOW IT DOES IT:
It uses a combination of MACD and MFI indicators to create entry signals. Parameters for each indicator have been surfaced for user configurability.
Take profits are fixed, but stop loss uses ATR configuration to minimize losses and close profitably.
HOW IS MY VERSION ORIGINAL:
I started trying to deploy this script myself in my algorithmic trading but ran into some issues which I have tried to address in this version.
Delayed Signals : The script has been refactored to use a time frame drop down. The higher time frame can be run on a faster chart (recommended on one minute chart for fastest signal confirmation and relay to algotrading platform.)
Repainting Issues : All indicators have been recoded to use the security function that checks to see if the current calculation is in realtime, if it is, then it uses the previous bar for calculation. If you are still experiencing repainting issues based on intended (or non intended use), please provide a report with screenshot and explanation so I can try to address.
Filtering : I have added to additional filters an ABOVE EMA Filter and a BELOW RSI Filter (both can be turned on and off)
Customizable Long and Close Messages : This allows someone to use the script for algorithmic trading without having to alter code. It also means you can use one indicator for all of your different alterts required for your bots.
HOW TO USE IT:
It is intended to be used in the 5-30 minute time frames, but you might be able to get a good configuration for higher time frames. I welcome feedback from other users on what they have found.
Find a pair with high volatility (example KUCOIN:ETH3LUSDT ) - I have found it works particularly well with 3L and 3S tokens for crypto. although it the limitation is that confrigurations I have found to work typically have low R/R ratio, but very high win rate and profit factor.
Ideally set one minute chart for bots, but you can use other charts for manual trading. The signal will be delayed by one bar but I have found configurations that still test well.
Select a time frame in configuration for your indicator calculations.
Select the strategy config for time frame. I like to use 5 and 15 minutes for scalping scenarios, but I am interested in hearing back from other community memebers.
Optimize your indicator without filters (trendFilter and RSI Filter)
Use the TrendFilter and RSI Filter to further refine your signals for entry. You will get less entries but you can increase your win ratio.
I will add screenshots and possibly a video provided that it passes community standards.
Limitations: this works rather well for short term, and does some good forward testing but back testing large data sets is a problem when switching from very small time frame to large time frame. For instance, finding a configuration that works on a one minute chart but then changing to a 1 hour chart means you lose some of your intra bar calclulations. There are some new features in pine script which might be able to address, this, but I have not had a chance to work on that issue.

Hulk Strategy x35 Leverage 5m chart w/Alerts This strategy is a pullback strategy that utilizes 2 EMAs as a way of identifying trend, MACD as an entry signal, and RSI and ADX to filter bad trades. By using the confirmation of all of these indicators the strategy attempts to catch pullbacks, and it is optimized to wait for high probability setups. Take not that the strategy is optimized for use on BTCUSDT along with 35 times leverage(Using leverage is risky). The Hulk Strategy waits for strong trend confirmation and then attempts to identify pullbacks using MACD and RSI. By using these it identifies strong short term movement against the trend(hence the name Hulk). To use the strategy wait for the strategy to make an entry, and then enter with a stop loss of 1.1% and a take profit of 1.35% with respect to if it is a long or short position. The trade frequency of this strategy is high as it is made for use on the 5m timeframe. But this does not mean you will have to be staring at your computer constantly as an average of 1 trade takes place each day. This will vary a lot though, somedays the strategy enters up to 4 times. I wish you good trading and hope that you like this strategy!
P.S. The indicators on my chart are visualizations of the indicators used in the strategy, they are not necessary for the strategy to work though. Also the colored in cloud on the price chart is an EMA cloud and it comes with the strategy when you add it to your chart. This EMA cloud consists of two EMAs a 50 and a 200 EMA.

The Brain Trust Presets Strategies [BTC / ETH] [PrismBot] [Lite]This strategy contains 9 different timeframe strategies (2 strategy types with pre-adjusted filter options for the different timeframes) tailored to BTC ( Bitcoin ) and ETH ( Ethereum ) on Binance. While I've listed these prebuilt strategies for specific timeframes, they are versatile enough to be checked and tested on other timeframes, and exchanges as well. I have been careful to avoid any curvefitting or overfitting. Included is useful default order settings, but we wanted to ensure you, the user, has control over the order settings for your own equity and trading.
These strategies are created, tailored, tested, and actively used by me.
It is up to you to do your own due diligence when testing these strategies on your exchange, and for your use, and PrismBot bears no responsibility for losses from the use of these strategies.
These strategies employ a variety of methods. Notable inclusions are other live strategies of mine including but not limited to:
ADX + MACD
RSI
Consolidations
Bull Bear Power
Volume Calculations
Open Interest Data
All of these setups include trend trading methods intended to maximize profitability in strong trending markets, and filters deployed to prevent failures in consolidation, though nothing is failproof.
You can control your leverage, quantity calculations, and other order settings. However, all other strategy input parameters are controlled by the strategy selectors.
Some strategies use 1.5 to 1 Risk to Reward ratio while others use 1:1.
How we execute trades for each strategy:
For 10m and 45m
we use a variety of settings for a Normalized MACD and ADX indicator. The thesis is we detect Normalized MACD crossovers at specific values and only allow trading of the strategy when the ADX is above a specific value.
For 15m, 1H, and 45m
we utilize the RSI crossovers of overbought and oversold and use the RSI moving average to filter trades. The thesis is we detect overbought for long and oversold for short.
For each strategy we use additional filters such as Bull Bear Power, Volume Flow, and Open Interest calculations to simply validate a trade.
Automatic Mode
In automatic mode, we detect your timeframe and current coin chart to decide one of the strategies from our database. If you want to manually select a different strategy or try the strategies on different cryptocurrencies, you can disable automatic mode entirely.

MACD Strategy [Trading Nerd]This Strategy uses a EMA as a trend filter and MACD for entries. The stoploss can be calculated by the last highs/lows or by the ATR.
Entry Conditions
Long:
close price must be above the EMA
MACD-Line crossover MACD-Signal-Line
MACD-Signal- Line mus be below 0
Short:
close price must be below the EMA
MACD-Line crossunder MACD-Signal-Line
MACD-Signal- Line mus be above 0
Exit Conditions
The Stoploss can be set in two different ways:
1. By the calculated ATR value of the entry Candle. This Value can be multiplied with the ATR multiplier for SL .
For Longs: SL = entry Price - ATR * ATR-multiplier
For Shorts: SL = entry Price + ATR * ATR-multiplier
2. By the previous highest high or lowest low (also called Donchain Channels). The lookback length can be changed in the at Lookback length for HH/LL SL .
For Longs: SL = LL of the last X candles
For Shorts: SL = HH of the last X candles
Take Profit
The TP is calculated by the Risk * Risk Reward Ratio . The Risk Reward Ratio can be changed in the Settings. The Risk is the difference of entry price and stoploss price: Risk = absolute(entry price - stoploss price)
For Longs: TP = entry Price + Risk * Risk Reward Ratio.
For Shorts: TP = entry Price - Risk * Risk Reward Ratio.
Risk Management
You can set the Risk % per Trade in the settings. A Value of 2 means that the position size is calculated in a way that at a loosing trade the strategy will only loose 2% of the current capital (initial capital + net profit).
E.g.: The current capital is $1000 and a trade hits the SL. The strategy will only loose $20.
Info for Alerts: Alert message conversion of JSON Strings. You don't need to add any or \" to the alert String.
When you create the Alert the Message must be: {{strategy.order.alert_message}}

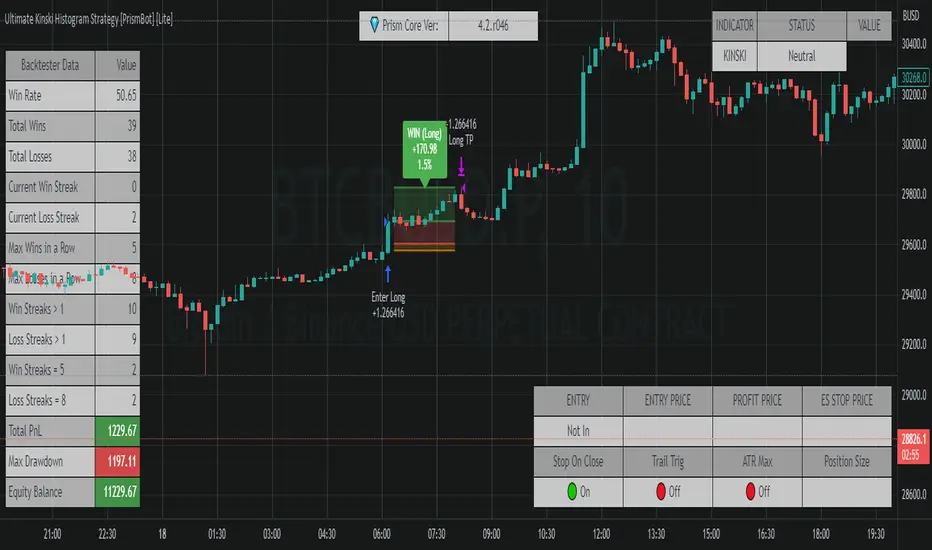
Ultimate Kinski Histogram Strategy [PrismBot] [Lite]This is an anti-curve fitting strategy that has no value inputs for the strategy settings. It just works , as they say.
This is based on the @KINSKI Buy-Sell Signal , but also incorporates other confluence (an MACD and histogram) and incorporates it into a fully automatable strategy with customizable order settings and quantity calculations.
The strategy has potential in scalping, but works best (in my testing) on higher timeframes (15M and up) with the default strategy.
Included in this Strategy:
✔️ Tweak a multitude of specific settings (MA lengths, R:R, SL distance etc)
✔️ Enable advanced setup filters
✔️ Use money management and risk calculations
✔️ Draw trade info directly to chart (eg. SL size in percent, win rate etc)
✔️ Use various filters (eg. time filter, date filter, MA slope angle etc)
✔️ Manage risk per position when auto-trading forex through AutoView
✔️ Choose from various alert conditions!
✔️ Sync to any bot or algorithmic trading system
Pro Divergence [regular + hidden] by TradingClue█ Pro Divergence is my new divergence-based toolkit that will help you to spot lucrative opportunities in all kinds of markets.
I've developed toolkits and strategies that use divergences for many years, e.g. AutoDivergence and CCIDivergence . Pro Divergence is my latest development and benefits from those yearlong experiences.
The main algorithm to detect divergences has changed from using linear regressions and moving averages to algorithmic trendline detection like I've been using in TD Lines .
This new approach supports the detection of regular divergences but also hidden divergences can be identified.
Before going more into the details of the mechanics of Pro Divergence, let's recap, what divergences are all about when it comes to trading.
█ Regular Divergence
The basic idea is pretty simple: If price goes in the opposite direction than some other technical indicator - in most cases an oscillator - we speak of a divergence. A regular divergence might be a signal for a trend reversal. That's it.
For example, if the price is currently rising, while at the same time Momentum is falling - it might be time for a reversal and the price of an asset is about to fall soon. If there are additional indications to confirm the signal, e.g. if RSI is in the overbought area, it might be a good idea to go short on that specific asset.
Regular bullish divergences are indicated when price is forming lower lows while an oscillator shows higher lows.
Regular bearish divergences are indicated when price is forming higher highs while an oscillator shows lower highs.
█ Hidden Divergence
While regular divergences indicate trend reversals, hidden divergences indicate a trend continuation.
When the price is making higher lows and the oscillator is showing lower lows, we speak of a bullish hidden divergence. When the price is making lower highs and the oscillator shows higher highs, it's a bearish hidden divergence.
These rules for identifying divergences are pretty simple and straightforward. And they are also confusing at times. But that's what Pro Divergence is helping you with: trade based on customizable signals to identify all kinds of divergences.
You could either use the strategy settings of the toolkit to optimize the properties to show winning backtesting results. Or you use the signals as an extra confirmation to some other kind of signal/ strategy you are working with.
█ Summary of all current features
• Oscillator: choose between CCI, Momentum, MACD, or RSI. All oscillators-settings are customizable.
• RSI-filter: in some cases, the quality of the signals can be improved by an RSI filter, e.g. a bullish signal would only be valid if RSI is in the oversold area. Set the RSI period and the oversold/ overbought levels to your preferred values.
• You can display all divergences on the chart to get an idea of the current price action. Or you can pick any combination of signals you would like to include in a backtest. Possible signals are: regular bullish divergence, regular bearish divergence, hidden bullish divergence, hidden bearish divergence
• Exits: there are many ways to get exit signals - combinations of the below options are possible:
• fixed profit targets/ stop losses based on ticks
• Exit when momentum reverses
• Exit when price touches the opposite Bollinger Band (e.g. a long position will be closed when price touches the upper Bollinger Band). The settings for the Bollinger Bands are customizable.
• Entry: you can choose only to enter a trade if momentum is going in the same direction as the direction of your trade (e.g. only go long if momentum is rising)
• time and date filer
• Do a backtest only in a given time range (maybe you're not interested in the whole range of historical data when trading in a higher timeframe. Or you would like to do some kind of walk forward analysis)
• Only trade during special times of a day, e.g. only trade during the first hours of a trading session
Since this strategy is making heavy use of math and technical indicators, it is not tied to a certain asset class or timeframe. It was tested successfully on a large number of financial instruments like stocks, crypto, forex, and others.

MATIC/USD 1H Bot for 3commas (works w/o 3commas too)This is a MATIC/USD or USDT specific implementation of my BNB/USD 1 hour bot. It should work out of the gate correctly for MATIC, at least based on what has been happening with it for the past seven weeks. You can fiddle with the following settings using the gear icon:
Fast and slow MACD length
The decision to use RSI thresholds as requirements for buys and/or sells, as well as the chart timeframe to use for that (make sure you use the same timeframe as your chart or a higher timeframe. You don't want to use a 1m RSI on a one hour chart but you can use a 4 hour RSI on a 1 hour chart with no issues.)
Buy and/or sell RSI threshold limits
Trailing stop loss %
Start date (for backtesting, I usually leave mine with 1-2 months trailing as those are usually better indicators than how they would have performed over the past few years)
Stress levels
Moving Average length and type
Linear regression amount
The gist of this bot is that it will use a smoothed EMA to make informed buys and sells. The smoothing prevents most noise from affecting your orders. It also allows you to set a trailing stop loss. If you don't want to use this feature set the value to 100 and it will effectively disable it.
Finally, you can disable RSI threshold point visibility. This won't affect bot operation, it just makes it cleaner to look at on your chart. Disabling RSI buys or sells will also disable visibility.
This bot takes a shotgun strategy to buys and sells. It makes a lot of buys and the majority of them are closed with little to no movement up or down. However, the ones that are profitable make a LOT as you will see once you start testing.
I make the full version of these bots available (though the script is protected) so users can test them, however if you want to use it with 3commas you will need access to the full script. Message me if you want the code and we can figure something out.

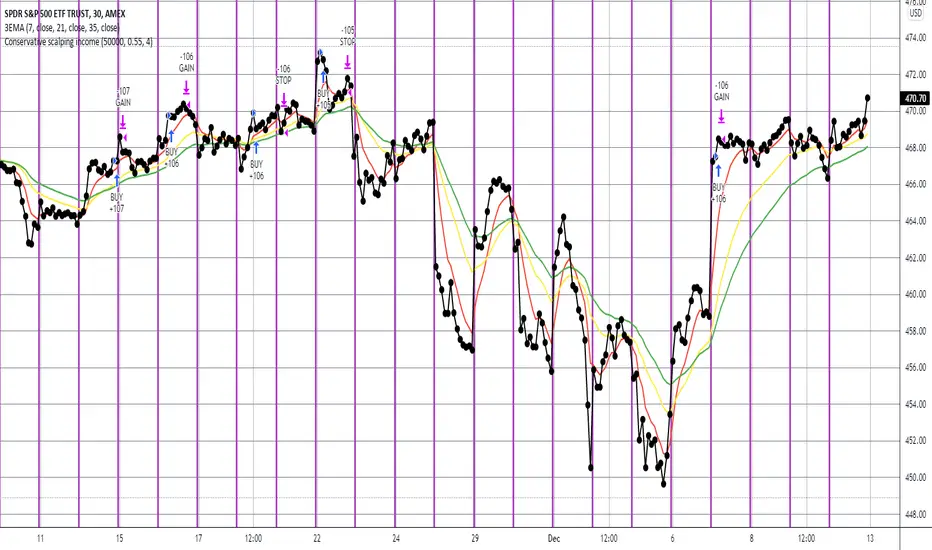
Conservative scalping incomeThis fully automated scalping strategy aims for an 10-12% annual return using LONG positions only (i.e. no SHORTs), with 2 to 1 number of winning trades and 1.5 to 1 avg win amount vs avg loss amount. It should generally make from zero to four trades per day depending on market conditions. It should remain in a position for roughly an hour. It leverages numerous indicators, including multiple moving averages, ADX, and MACD.
Note that this strategy does not try to time tops and bottoms. Rather it waits to clearly identify a trend, and then rides that trend for a short while making a defined profit. Thus it may enter and exit a trade under profitable conditions, but not at the most profitable conditions possible. It gets in when it's sure of the trend, and then generally leaves that trend as soon as a defined profit is made or before a meaningful loss is incurred.
This strategy will work well with any index (e.g. SPY) and most stocks. It works best on a five minute time interval and when the index or stock is either generally increasing over time or bouncing back and forth between a medium to wide range.
Trend Following with Donchian Channels and MACDThis is a trend following system based on the Donchian Channels. Instead of using a simple moving average crossover, this system uses the MACD as the trendfilter:
Long positions:
* Price makes a new 50 day high,
* The MACD-line crosses above or is above the Signal-line.
* Both the MACD and the Signal-lines are above the zero-line.
Short positions:
* Price makes a new 50 day low,
* The MACD-line crosses below or is below the Signal-line.
* Both the MACD and the Signal-lines are below the zero-line.
Stoploss:
The initial and the trailing stoploss are 4 ATRs away from the price.

The MACDMI T/SLThis is a combined MACD and DMI strategy script with multiple options for targets and stoploss.
Stoploss and targets sizes are ATR based calculations.
Each of these contains a sets an initial ATR based that will close the entire position if hit. From there, differences between them are as follows:
Trailing stop - immediately begins trailing stoploss from your entry. Entire position is closed when hit.
Single Target - closes entire position once target is hit
T1 + Trail - closes half of the position when first target is hit and then begins trailing stop on the remaining position.
T1 + Trail/T2 + Trail - closes a third of the position at T1 and begins trailing a stop on the rest. Will close another third at T2, continue the trailing stop, and close the final third when the stop is hit.
5min MACD scalp by JoelThis strategy is inspired by a youtuber called Joel on Crypto. He trades this using Ema, MACD indicators and his own experience. For more information, check out his Best Crypto Scalping Strategy for the 5 Min Time Frame video. I have tried to automate this a little.
Long or Short trades are determined with a crossing of the fast Ema over the slow Ema for Long and the opposite for Short. Trades should only happen close to the crossovers. Then for Long we use the MACD indicator with a 1min TF (I had better results using the 5min) where we look for high peaks in negative values for Long and vice versa for Shorts. These should be significantly higher than other peaks (or if you will lower peaks for a Long).
Hence, the key is to detect high peaks on the histogram, which I try to achieve by checking if the last 2 values were higher than X bars back. If you want to make it even more specific, then you can turn on the additional checkbox which compares the current value to the average value of X bars back, and if it is greater than, say, 50% the value of the average (= 1.5x the average), then it's ok for the trade.
I also noticed that the strategy often bought at the top or bottom, so I added a check that compares whether the last evaluated bar is the first rising bar (for Long) or falling bar (for Short). This can be turned on or off.
Target profit 0,5% and stop loss 0,4% are based on his recommendation. The strategy is set to take only 1 trade at a time , and you can have a back tester table on.
I'm still a pine script beginner, so the strategy is certainly not perfect and could be improved. If you have any tips on how to improve it further, please let me know. I will try to update it when I have time.
I would also like to thank Joel on Crypto for sharing the strategy and @ZenAndTheArtOfTrading for his great library and code (thanks to him we have a back tester table in here), but especially his educational videos on youtube, which taught me a lot about pine script.
(Short) EMA200+Parabolic SAR+MACD+TP&SL By Nussara (strategy)This indicator is backtest of “ (Short) EMA 200 + Parabolic SAR + MACD + Take Profit and Stop Loss”
You can simulate trading by setting your own funds and trading fees. And you can adjust various parameter settings to get the results you want.
Exponential Moving Average
Moving averages smooth the price data to form a trend following indicator. They do not predict price direction, but rather define the current direction, though they lag due to being based on past prices. Despite this, moving averages help smooth price action and filter out the noise.
EMA=Price(t)×k+EMA(y)×(1−k)
where:
t=today
y=yesterday
N=number of days in EMA
k=2÷(N+1)
Parabolic SAR
The Parabolic SAR is a technical indicator developed by J. Welles Wilder to determine the direction that an asset is moving. The indicator is also referred to as a stop and reverse system, which is abbreviated as SAR . It aims to identify potential reversals in the price movement of traded assets.
MACD
Moving average convergence divergence ( MACD ) is a trend-following momentum indicator that shows the relationship between two moving averages of a security’s price. The MACD is calculated by subtracting the 26-period exponential moving average ( EMA ) from the 12-period EMA . The result of that calculation is the MACD line. A nine-day EMA of the MACD called the "signal line," is then plotted on top of the MACD line, which can function as a trigger for buy and sell signals. Traders may buy the security when the MACD crosses above its signal line and sell—or short—the security when the MACD crosses below the signal line.
EMA 200 + Parabolic SAR + MACD (Short) formula
1. The price closes below the ema200 line.
2. MACD Line cross down Signal Line"
3. Parabolic SAR above the bar means that it is a downtrend.
If all three are true, the indicator will have a Short signal.
Risk to Reward Ratio = 1:1
Stop loss = Parabolic SAR point.
This indicator is just a tool for technical analysis . It shouldn't be used as the only indication of trade because it causes you to lose your money. You should use other indicators to analyze together.

MacD Short and/or Long with Bi-Directional TP and SL This tool allows you to test any variable value for MacD and Signal for going Long or Short with each market direction having customizable values for stop loss and take profit.
For example, sometimes the MacD and Signal values are better with different lengths between Short and Long. You can use this tool to see them overlaid and determine the best settings for going one direction or the other.
This script was preset for use with XBTUSD on the 4 hour time frame. Another example with this in mind, is take profits and stop losses might not work in the Long market direction but going Short does! Without this tool that would be hard to see since typically stop loss and take profit is applied to both directions. I found with this tool that a 20% take profit seems to be a good sweet spot for going short with this strategy.
You can customize which MacD histogram you see by going to the style section and turning off the Short or Long parameters so you can see only 1 histogram at a time if you wish.
If you have any questions, please PM me.
Scalping Trading System bot Crypto and StocksThis is a trend trading strategy scalping bot that can work with any type of market. However I concluded my tests so far with Crypto, Stocks and Forex, and with optimizations always could be found some profitable settings.
Indicators
SImple Moving Average
Exponential Moving Average
Keltner Channels
MACD Histogram
Stochastics
Rules for entry
long= Close of the candle bigger than both moving averages and close of the candle is between the top and bot levels from Keltner. At the same time the macd histogram is negative and stochastic is below 50.
short= Close of the candle smaller than both moving averages and close of the candle is between the top and bot levels from Keltner. At the same time the macd histogram is positive and stochastic is above 50.
Rules for exit
We exit when we meet an opposite reverse order.
This strategy has no risk management inside, so use it with caution !

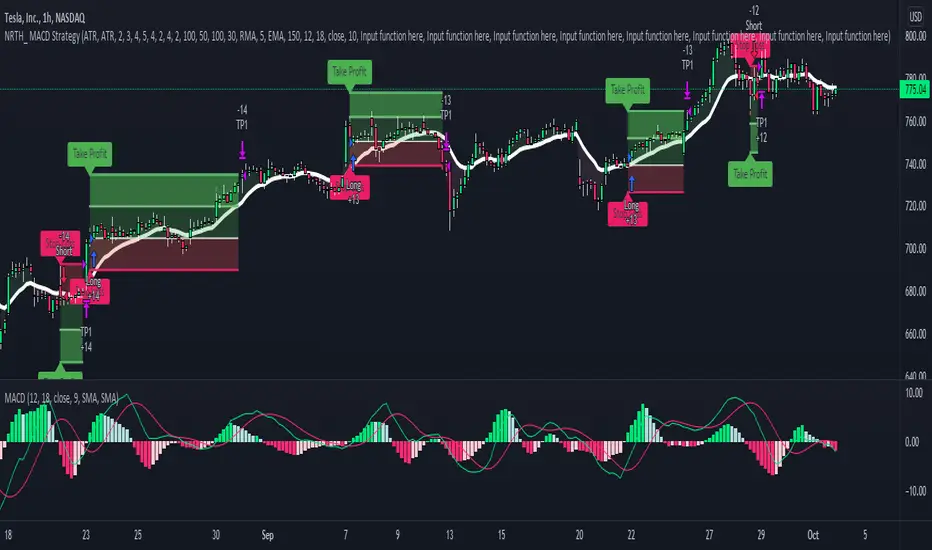
MACD StrategyNRTH_ MACD strategy, packed with alerts, visual backtesting, and ready for automation.
Comes included with the Premium Package.
Indicator features
Built-In Alerts
Visual Risk Management
Customizable Entry Rules
Usage Tips
Works on any timeframe, tweak period lengths accordingly.
Recommended for use on higher timeframes, with the MA Filter
Simple, and customizable MACD strategy, trade with a defined exit strategy and entry parameters.
Works for all markets with the ability to customize to your liking.
Backtesting Results Info
Period 1/1/2021-1/10/2021
Entry value at $1000 with 10x leverage
ATR Exits : 1:2 RR
-------------------------------------------
Disclaimer
Copyright NRTH_ Indicators 2021.
NRTH_ and all affiliated parties are not registered as financial advisors. The products & services NRTH_ offers are for educational purposes only and should not be construed as financial advice. You must be aware of the risks and be willing to bear any level of risk to invest in financial markets. Past performance is not necessarily indicative of future results. NRTH_ and all individuals associated assume no responsibility for your trading results or investments.
All investments involve risk, and the past performance of a security, industry, sector, market, financial product, trading strategy, or individual’s trading does not guarantee future results or returns. Investors are fully responsible for any investment decisions they make. Such decisions should be based solely on an evaluation of their financial circumstances, investment objectives, risk tolerance, and liquidity needs.
MACD + BB + RSI Strategy [Alorse]A very simple and highly effective strategy that combines 3 famous indicators:
MACD
Bollinger Bands
RSI
Entry conditions are:
The MACD line crosses over the signal line.
RSI less than 50
Price below the BB baseline
Exit conditions are:
RSI greater than 70
Closing price higher than the upper BB
Or when the price hits the Stop Loss defined by you (Feature).

MACD + CMF + EMA + Supertrend by TradeSmartHello everyone and welcome to our first script release!
This script is one of many upcoming scripts. This one is a test for us, how it works, how you guys like this kind of stuff, and for feedback what we should change/improve at.
SCRIPT IS OPTIMIZED FOR:
EUR/USD 30 MINUTE TIMEFRAME
Video of the Strategy:
Search for “MACD + CMF + 200 EMA + Supertrend Trading Strategy Tested 100 Times with Great Results!” on our channel.
In this video you can find the exact strategy we programmed, just one added feature: Supertrend trailing stop loss. (position gets closed once the price hits the Supertrend indicator)
Now you can modify the following:
MACD settings
Supertrend settings
EMA settings
CMF settings
We will update the script with more and more features.
The first update will be:
Modifiable risk to reward ratio.
I will make a video of how to use this indicator next week, explaining all the features and more!
Hope you like it! Don't forget to let us know what we should change or improve. Thanks, and have a great day!
STRATEGY ENTRY RULES
LONG
When CMF is above 0 and price is under EMA. Also MACD has made a double cross above the zero line (meaning one cross down and one cross up by the MACD line). Then go long!
Note:
MACD or Signal must return under 0 in order to start a new position
If either of the MACD lines touches the 0 line before entry, we skip the trade and wait for the next signal.
SHORT
When CMF is under 0 and price is under EMA. Also MACD has made a double cross under the zero line (meaning one cross up and one cross down by the MACD line). Then go short!
Note:
MACD or Signal must return under 0 in order to start a new position.
If either of the MACD lines touches the 0 line before entry, we skip the trade and wait for the next signal.
TAKE PROFIT
When price hits the exit price (calculated from stop loss with the risk ratio), then exit with 50% of the position. The other 50% will stay open until the price hits the supertrend or the base stop loss.
STOP LOSS
When price hits stop loss then exit the position. Stop loss is calculated from the Supertrend and it is a trailing one, meaning it changes based on the movement of the price.
QUANTITY TO BUY
The quantity to buy is based on the Risk Per Trade % attribute. This means that we can set how much money we want to risk on one trade. Meaning that if we lose that particular position, then a Risk Per Trade % value of our equity will be lost.
Example: if you set the Risk Per Trade % to 1 % and you have a 100$ account balance, then if you loose the trade you will loose 1$ max.

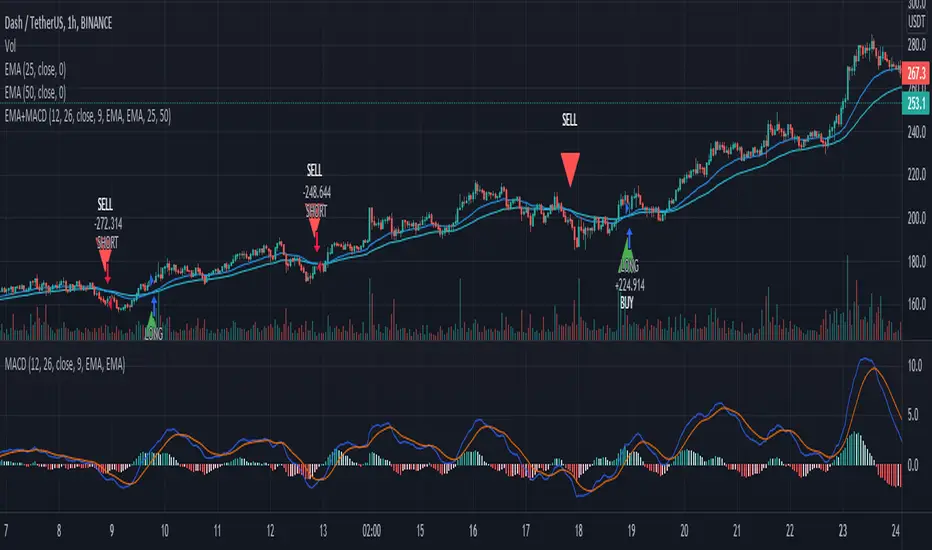
EMA+MACDA simple script using EMA 25 and EMA 50 with MACD. Enter long when EMA 25 crossover ema 50 and MACD line > 0, enter short when EMA 50 crossover ema 25 and MACD < 0