M-oscillator

Double 7's StrategyStrategy described in the book "Short Term Trading Strategies that Work", written by Larry Connors and Cesar Alvarez.
It is the simplest strategy I know and has only 3 rules:
- Price must be above the arithmetic moving average of 200 periods.
- Buy when the price closes below the closing of the last 7 days.
- Sale when the price closes above the closing of the last 7 days.
Simple as it may seem, this strategy works very well in some stocks and/or graphical times (in some stocks it overcomes many RSI 2 strategies). It was developed for the daily chart and does not usually work well on weekly or monthly charts, but can be used for day trades if the back-test proves to be favorable.
If you want, you can change the input and output rules by setting other values for the input or output period and thus find more positive results for specific stocks.
There is no stop loss because in tests the stop loss usually reduces the gains of the strategy.
Good luck and good trades.
================================
Estrategia descrita no livro "Short Term Trading Strategies that Work", escrito por Larry Connors e Cesar Alvarez.
É a estratégia mais simples que eu conheço e tem apenas 3 regras:
- Preço deve estar acima da média móvel aritmética de 200 períodos.
- Compre quando o preço fechar abaixo do fechamento dos ultimos 7 dias.
- Venda quando o preço fechar acima do fechamento dos ultimos 7 dias.
Por mais simples que pareça, esta estratégia funciona muito bem em alguns papeis e/ou tempos gráficos (em alguns papeis a mesma supera muitas estratégias pelo IFR2). A mesma foi desenvolvida para o gráfico diário e normalmente não funciona muito bem em gráficos semanais ou mensais, mas pode ser utilizado no intraday caso o backtest se mostre favorável.
Caso você queira, é possível alterar a regra de entrada e saída definindo outros valores para o período de entrada ou saída e assim encontrar resultados mais positivos para cada papel.
Não existe stop loss pois nos testes normalmente o stop loss reduz os ganhos da estratégia.
Boa sorte e bons trades.

BTC crypto bot indicator 3 MIN - PhilMEXBTC Crypto bot indicator
Can be used on all BTC USD / XBT USD
Must be used on 3 minutes timeframe only
Signals are pretty accurate and this code has no repaint.
Hope this help for your trading and Bitmex.
Some updates may come soon.

Gage Updated Strategy 2019Based on Divergence and hidden divergences, most useful when using the Money Flow Index to spot the reversal and locate the bottom of the market.

Gage StrategyBased on Divergence and hidden divergences, most useful when using the Money Flow Index to spot the reversal and locate the bottom of the market.

Combo Backtest 123 Reversal & Bull Power This is combo strategies for get a cumulative signal.
First strategy
This System was created from the Book "How I Tripled My Money In The
Futures Market" by Ulf Jensen, Page 183. This is reverse type of strategies.
The strategy buys at market, if close price is higher than the previous close
during 2 days and the meaning of 9-days Stochastic Slow Oscillator is lower than 50.
The strategy sells at market, if close price is lower than the previous close price
during 2 days and the meaning of 9-days Stochastic Fast Oscillator is higher than 50.
Second strategy
Bull Power Indicator
To get more information please see "Bull And Bear Balance Indicator"
by Vadim Gimelfarb.
WARNING:
- For purpose educate only
- This script to change bars colors.

Trend Volatility Strategy TesterImproved the code, by filtering out bad trades: Using 240 days of Data in the Strategy Tester.
ETH/USD (Coinbase): 3 5 25 settings
BTC/USD (Coinbase): 5 5 25 settings
Date/Time can be changed from settings
Amazing results compared to old script. I will update the actual "Trend Volatility" script soon with new filter added.

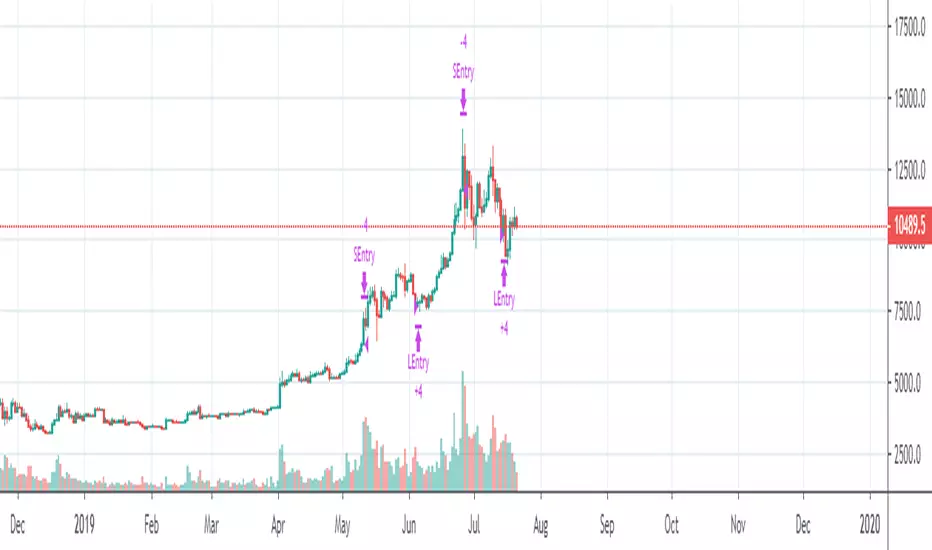
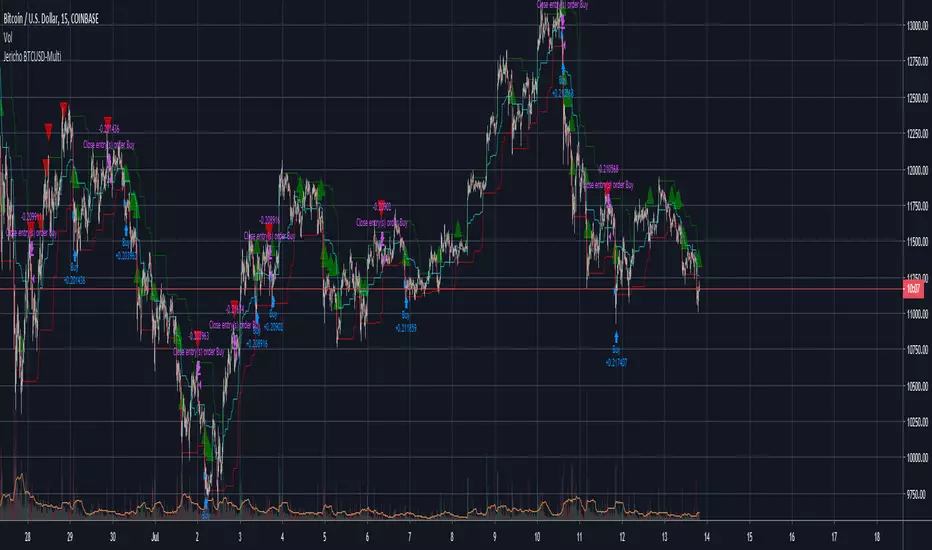
Jericho USDBTCUse the options to select between the different Jericho settings.
The Red Triangles indicate possible sell
The green Triangles Indicate possible Buy point
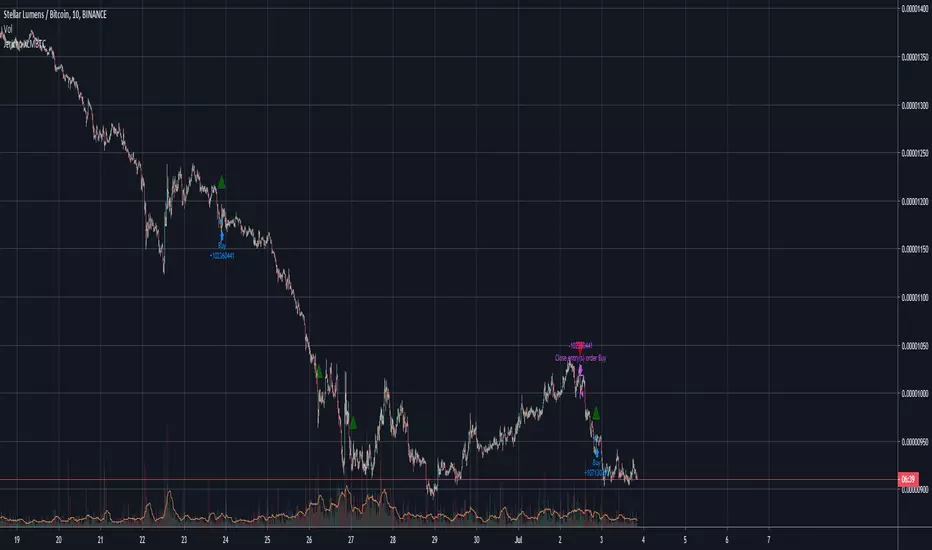
Jericho XLMBTCUse the options to select between the different Jericho settings.
The Red Triangles indicate possible sell
The green Triangles Indicate possible Buy point
Cyatophilum Scalping Bot V2 [BACKTEST]Improved version of Cyatophilum Scalping Bot
Default settings for BITMEX:XBTUSD
2% stop loss
2% trailing take profit

Combo Backtest 123 Reversal & Bull And Bear Balance This is combo strategies for get a cumulative signal.
First strategy
This System was created from the Book "How I Tripled My Money In The
Futures Market" by Ulf Jensen, Page 183. This is reverse type of strategies.
The strategy buys at market, if close price is higher than the previous close
during 2 days and the meaning of 9-days Stochastic Slow Oscillator is lower than 50.
The strategy sells at market, if close price is lower than the previous close price
during 2 days and the meaning of 9-days Stochastic Fast Oscillator is higher than 50.
Second strategy
This new indicator analyzes the balance between bullish and
bearish sentiment.
One can cay that it is an improved analogue of Elder Ray indicator.
To get more information please see "Bull And Bear Balance Indicator"
by Vadim Gimelfarb.
WARNING:
- For purpose educate only
- This script to change bars colors.


Combo Backtest 123 Reversal & Breakout Range Short This is combo strategies for get a cumulative signal.
First strategy
This System was created from the Book "How I Tripled My Money In The
Futures Market" by Ulf Jensen, Page 183. This is reverse type of strategies.
The strategy buys at market, if close price is higher than the previous close
during 2 days and the meaning of 9-days Stochastic Slow Oscillator is lower than 50.
The strategy sells at market, if close price is lower than the previous close price
during 2 days and the meaning of 9-days Stochastic Fast Oscillator is higher than 50.
Second strategy
Breakout Range Short Strategy
WARNING:
- For purpose educate only
- This script to change bars colors.

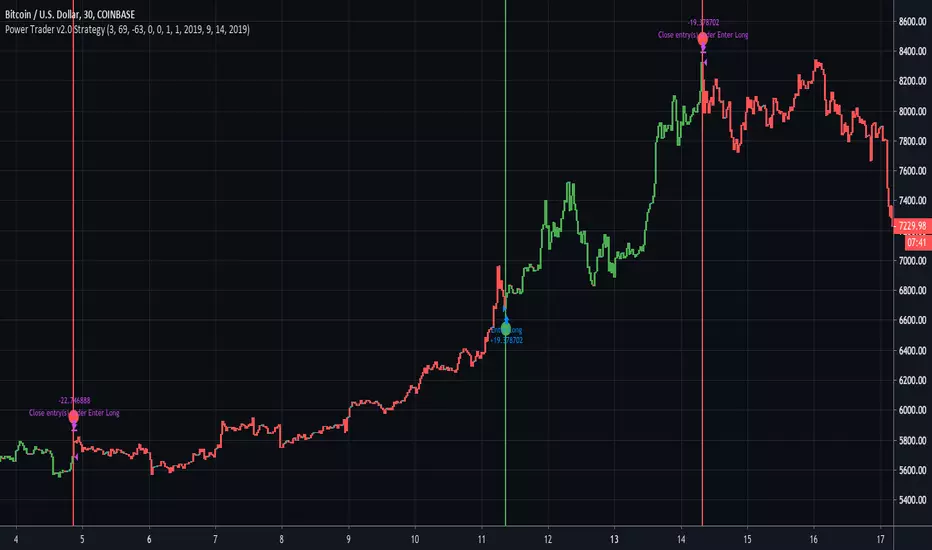
MACD/EMA/SMA/Ichimoku Confluence StrategyThis strategy uses a number of chart indicators to provide a Bullish/Bearish signal. Using a combination of the 200 SMA, the 20 EMA, the MACD and the Ichimoku cloud, the strategy logic will adjust the amount of confluence required between the indicators depending on how bullish or bearish the chart is looking. The logic looks for the following:
- Are we above or below the 200 SMA?
- Are we above or below the 20 EMA?
- Have we had a bullish MACD cross?
- Where are we in relation to the Ichimoku cloud?
If the coin is below the 200 SMA, then the strategy will only give a buy signal if the coin closes a candle above the 20 EMA AND the MACD is bullish and either the Ichimoku cloud is green, or the coin is above the Ichimoku cloud (regardless of colour).
If the coin is above the 200 SMA, Then the strategy will give a buy signal if the coin closes a candle above the 20 EMA AND the MACD is bullish and the coin is either IN the cloud (not necessarily above it) or the cloud is green.
The reverse is true for a sell signal, i.e. when the coin is above the 200 SMA it must close a candle below the Ichimoku cloud and be bearish in relation to the 20 EMA and MACD. If it is below the 200 SMA, then the strategy will give a sell signal if the the EMA/MACD conditions are true and the coin enters the cloud.
This strategy gives a fairly conservative signal for entry and exit points, but is fairly successful across a number of time frames, both short term and long term. As with all my strategies, I only include LONG entries and closes, not SHORT entries (as I find they make for inaccurate backtesting).
Please feel free to like, share, critique and suggest any improvements to this strategy. All feedback, positive and negative, is appreciated.


Combo Backtest 123 Reversal & Breakout Range Long This is combo strategies for get a cumulative signal.
First strategy
This System was created from the Book "How I Tripled My Money In The
Futures Market" by Ulf Jensen, Page 183. This is reverse type of strategies.
The strategy buys at market, if close price is higher than the previous close
during 2 days and the meaning of 9-days Stochastic Slow Oscillator is lower than 50.
The strategy sells at market, if close price is lower than the previous close price
during 2 days and the meaning of 9-days Stochastic Fast Oscillator is higher than 50.
Second strategy
Breakout Range Long Strategy
WARNING:
- For purpose educate only
- This script to change bars colors.