RSI Trendline Pro - Multi Confirmation
Overview
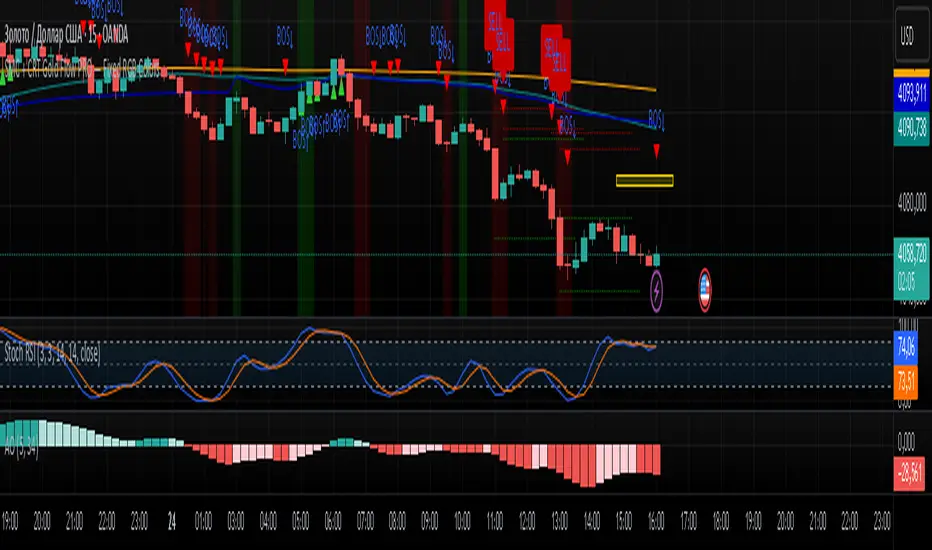
RSI Trendline Pro is an advanced Pine Script indicator that automatically draws trendlines on the RSI (Relative Strength Index) to detect support and resistance breakouts. It generates high-quality trading signals through a multi-confirmation system.
Key Features
Auto Trendlines: Detects pivot points on RSI to create intelligent support and resistance lines
Multi-Confirmation System: Combines Volume, Stochastic RSI, ADX, and Divergence filters to reduce false signals
RSI Divergence Detection: Automatically identifies bullish/bearish divergences between price and RSI
Live Dashboard: Displays RSI value, active trendlines, ADX strength, and last signal info on a visual panel
Smart Breakout Detection: Identifies trendline breaks and generates LONG/SHORT signals
How to Use
Add to TradingView: Paste code into Pine Editor and add to chart
Configure Parameters:
RSI Length: RSI period (default: 14)
Pivot Strength: Trendline sensitivity (lower = more lines)
Filters: Enable/disable Volume, Divergence, Stoch RSI, and ADX confirmations
Follow Signals:
LONG (Green): When RSI breaks resistance upward
SHORT (Red): When RSI breaks support downward
Divergence: "D" markers indicate potential trend reversals
Alert Setup
Script offers 4 alert types:
LONG Breakout: Resistance break
SHORT Breakout: Support break
Bullish/Bearish Divergence: Divergence detection
Any Signal: Combined alert for all signals
Best Practices
Prioritize high-volume breakouts (Volume Filter enabled)
Trends are stronger when ADX > 25
Confirm divergence signals with price action
Trade when 2-3 confirmations align
Pine Script® göstergesi