Simple Line📌 Understanding the Basic Concept
The trend reverses only when the price moves up or down by a fixed filter size.
It ignores normal volatility and noise, recognizing a trend change only when price moves beyond a specified threshold.
Trend direction is visually intuitive through line colors (green: uptrend, red: downtrend).
⚙️ Explanation of Settings
Auto Brick Size: Automatically determines the brick/filter size.
Fixed Brick Size: Manually set the size (e.g., 15, 30, 50, 100, etc.).
Volatility Length: The lookback period used for calculations (default: 14).
📈 Example of Identifying Buy Timing
When the line changes from gray or red to green, it signals the start of an uptrend.
This indicates that the price has moved upward by more than the required threshold.
📉 Example of Identifying Sell Timing
When the line changes from green to red, it suggests a possible downtrend reversal.
At this point, consider closing long positions or evaluating short entries.
🧪 Recommended Use Cases
Use as a trend filter to enhance the accuracy of existing strategies.
Can be used alone as a clean directional indicator without complex oscillators.
Works synergistically with trend-following strategies, breakout strategies, and more.
🔒 Notes & Cautions
More suitable for medium- to long-term trend trading than for fast scalping.
If the brick size is too small, the indicator may react to noise.
Sensitivity varies greatly depending on the selected brick size, so backtesting is essential to determine optimal values.
❗ The Trend Simple Line focuses solely on direction—remove the noise and focus purely on the trend.
초대 전용 스크립트
이 스크립트에 대한 접근이 제한되어 있습니다. 사용자는 즐겨찾기에 추가할 수 있지만 사용하려면 사용자의 권한이 필요합니다. 연락처 정보를 포함하여 액세스 요청에 대한 명확한 지침을 제공해 주세요.
이 비공개 초대 전용 스크립트는 스크립트 모더레이터의 검토를 거치지 않았으며, 하우스 룰 준수 여부는 확인되지 않았습니다. 트레이딩뷰는 스크립트의 작동 방식을 충분히 이해하고 작성자를 완전히 신뢰하지 않는 이상, 해당 스크립트에 비용을 지불하거나 사용하는 것을 권장하지 않습니다. 커뮤니티 스크립트에서 무료 오픈소스 대안을 찾아보실 수도 있습니다.
작성자 지시 사항
.
c9indicator
면책사항
해당 정보와 게시물은 금융, 투자, 트레이딩 또는 기타 유형의 조언이나 권장 사항으로 간주되지 않으며, 트레이딩뷰에서 제공하거나 보증하는 것이 아닙니
Lowerhighs

Consecutive Unswept Lower Highs/ Higher Lows CounterCounts consecutive Lower Highs and Higher Lows; number resets to zero when previous pivot high or low gets swept
-To help give an idea of when a retracement / run-on-stops may be overdue. i.e. the higher the counter number grows, the longer we've gone without a proper retracement.
//inputs//
~pivot lookback/lookforward: increase this for more significant pivot highs and lows.
~number of pivot high 'counter' labels (pairs) to show in history.
~formatting options.

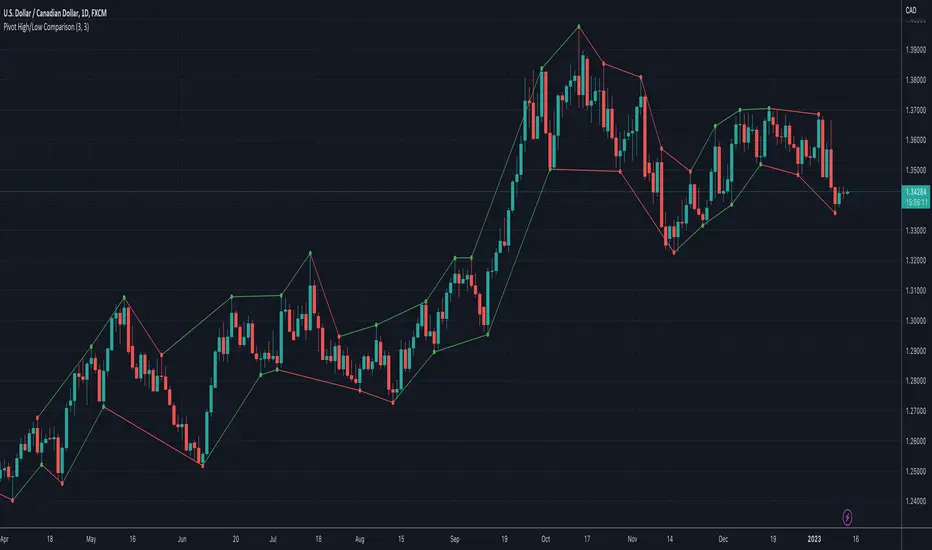
Pivot High/Low ComparisonThis script will show you at a glance the following trends:
Higher Highs (Green line on top)
Lower Highs (Red line on top)
Higher Lows (Green line on bottom)
Lower Lows (Red line on bottom)
It utilizes the Pivot High and Pivot Low functions to determine if the previous pivot was higher or lower than the current pivot .
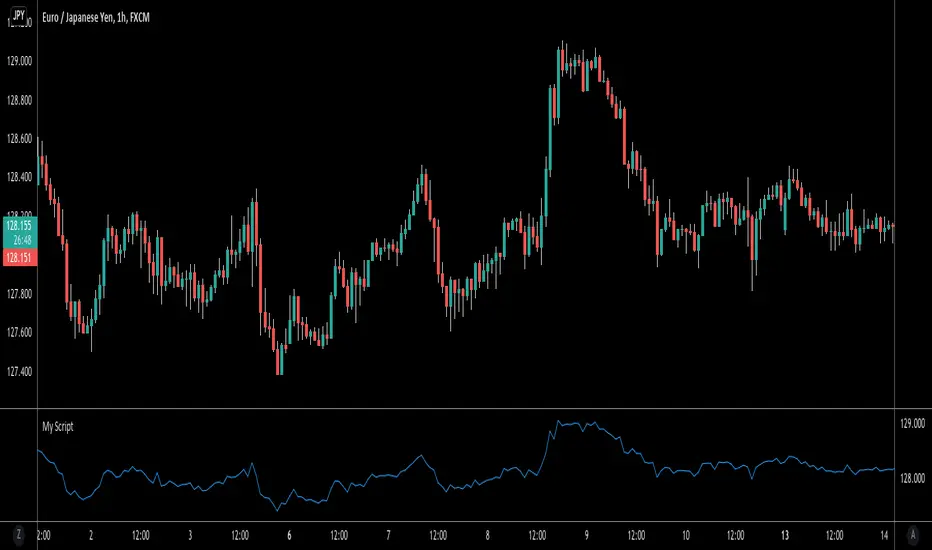
SequenceSee the highs and lows easily!
Up sequence:
The close of each candle is higher from the low of the previous candle.
* The reference will always be to the low of the highest candle in the up sequence
Down sequence:
The close of each candle is lower from the high of the previous candle.
* The reference will always be to the high of the lowest candle in the down sequence
Support Resistance HH HL LH LLThis is a very powerful indicator and I'm really happy to show you how it works.
It shows Higher Highs(HH),Higher Lows(HL),Lower Highs(LH),and Lower Lows (LL), the supports and the resistance.
Lets start with the HH, HL, LH and LL.
This points helps a lot who can not identify them yet. They help to identify up trends having HH and HL in sequence, and when the trend is not strong anymore creating LH after.
For down trends, the indicator show LH and LL in sequence and when the trend is not strong anymore showing HL after.
As well this indicator helps to draw trend lines when it shows. For example the LL drawing the line from the low of the first candle (LL) to the low of the second candle showing HL for an uptrend.
It can be done for the down trend, drawing the trend line from the high of the candle showing the HH, to the high of the candle showing LH.
Another use of the HH, HL, LH, LL can be the stop loss this will be explained later in the support and resistance part.
Now let me explain the support and resistance.
The support and resistance can be used as entry when the price break true using the previous HH, HL, LH and LL as stop loss.
For a safer entry I advise to use the retest of the line.
In the settings of the indicator there is the possibility to make the indicators invisible, to change the color, and as well to change how many candles before and after the main candle showing the HH, HL, LH and LL, but I advise to leave it as it is.
Thank you and lets take some pips!
