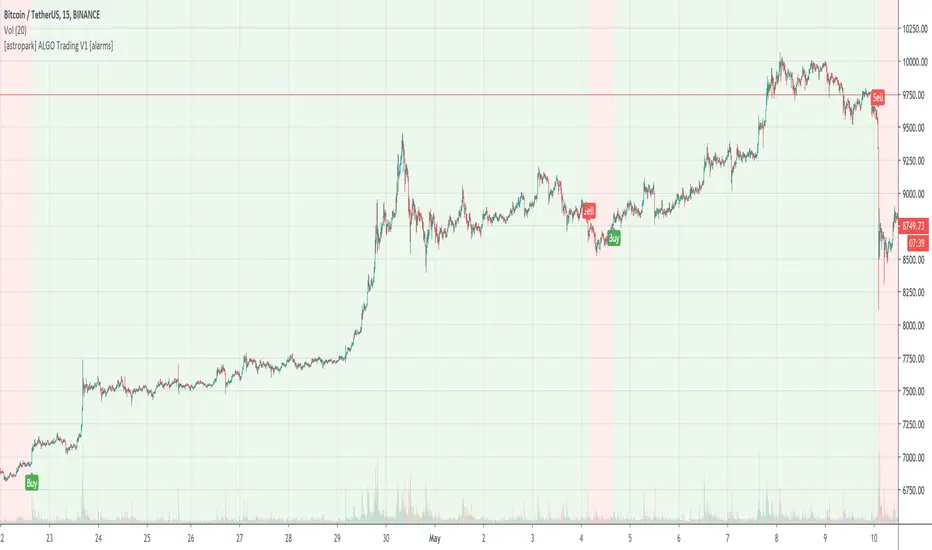
[astropark] ALGO Trading V1 [alarms]Dear Followers,
today another awesome Swing and Scalping Trading Strategy indicator, runnable on a bot , which works great on Low Timeframes (1h is suggested) but also on even lower ones (till 15m) and on higher ones (no further than 1D), just write me in order to help you find correct settings).
It must be said that this strategy works even better on 1m Renko chart!
If you are a scalper or you are a swing trader, you will love suggested entries for fast and long-lasting profit.
Keep in mind that a proper trailing stop strategy and risk management and money management strategies are very important (DM me if you need any clarification on these points).
This is not an evolution of "ALGO Trading V2" or "ALGO Trading V3" , but a twin sister of them. Search them on TradingView to know them better.
This strategy has the following options:
enable/disable signals on chart
enable/disable bars and background coloring based on trend
enable/disable a "filter noise" option , which try to reduce overtrading (you can easily check it on backtesting)
enable/disable a Take Profit / Stop Loss option (you can easily check it on backtesting too)
enable/disable a secret SmartOption which may improve profit on your chart (again, check it on you chart if it helps or not)
This strategy only trigger 1 buy or 1 sell. If you enable Take Profit / Stop Loss option, consider that many TP can be triggered before trend reversal, so take partial profit on every TP an eventually buy/sell back lower/higher to maximize your profit.
This script will let you set all notifications you may need in order to be alerted on each triggered signals.
The one for backtesting purpose can be found by searching for the astropark's "ALGO Trading V1" and then choosing the indicator with "strategy" suffix in the name, or you can find here below
Strategy results are calculated on the time window from January 2019 to now, so on more than 1 year, using 1000$ as initial capital and working at 1x leverage (so no leverage at all! If you like to use leverage, be sure to use a safe option, like 3x or 5x at most in order to have liquidation price very far).
This is not the "Holy Grail", so use a proper risk management strategy.
This is a premium indicator , so send me a private message in order to get access to this script.
Long-short
[astropark] I love Fibonacci V1Dear Followers,
I Love Fibonacci is a tool designed to have a professional market momentum perspective to help you get rid of your emotions and trade more securely!
Don't let FOMO, fear and indecision take control of your trading actions!
Use it together with my 21 days EMA indicator
and EMA Ribbons
Here some examples on how to use them all together on EURUSD trading pair
and on BTCUSD trading pair
This is a free indicator, direct message me if you need further help.

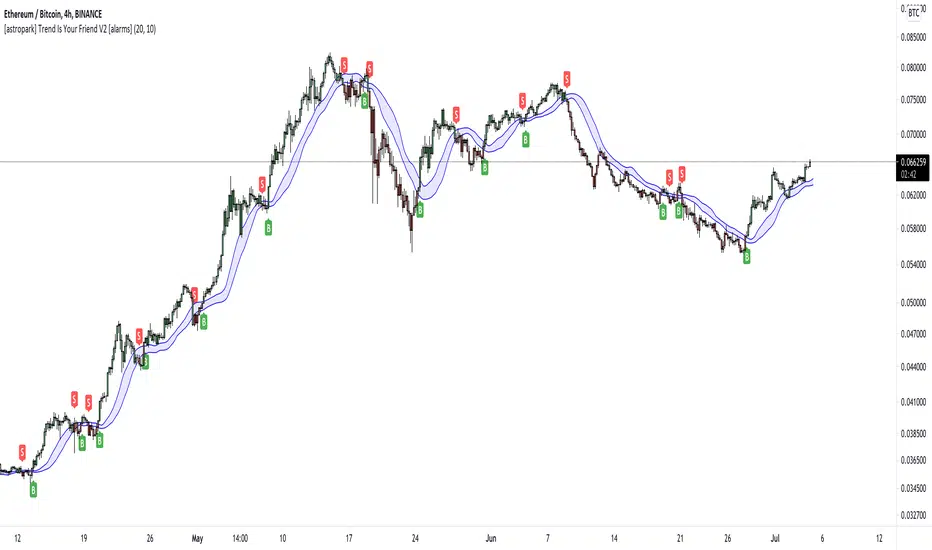
[astropark] Trend Is Your Friend V2 [alarms]Dear Followers,
today another awesome Swing and Scalping Trading Strategy indicator, runnable on a bot , which works great on High Timeframes (1D is suggested) but also on lower ones (just write me in order to help you find correct settings) and even better on 1m Renko chart!
If you are a scalper, you will love suggested entries for fast profit. You can run it on 1h timeframe (below is not suggested, there is "no-trend" below 1h!) if you are used to scalp trading and close each trade whenever you feel happy (a proper trailing stop strategy is suggested anyway).
This is a twin sister or the "Trend Is Your Friend V1" indicator you can see here below
This strategy differs for the engine used as basis, but has the same usage settings:
enable/disable signals on chart
enable/disable showing trend cloud
enable/disable bar coloring based on trend
enable/disable background coloring based on trend
edit trend period length (you have to increase it if you go on lower timeframes or you go on FOREX/Stocks market, direct message me in order to help you fine best settings)
This strategy only trigger 1 buy or 1 sell. In order to get notified when a signal is triggered, you need to use the "alarms" version of this indicator.
Strategy results are calculated on the timeframe from January 2015 to now, so on 5 years, using 10000$ as initial capital and working at 1x leverage (so no leverage at all! If you like to use leverage, be sure to use a safe option, like 3x or 5x at most in order to have liquidation price very far).
This is not the "Holy Grail", so use a proper risk management strategy.
This script will let you set all notifications you may need in order to be alerted on each triggered signals.
The one for backtesting purpose can be found by searching for the astropark's "trend is your friend" and then choosing the indicator with "strategy" suffix in the name, or you can find here below
This is a premium indicator , so send me a private message in order to get access to this script.
[astropark] Trend Is Your Friend V1 [alarms]Dear Followers,
today another awesome Swing and Scalping Trading Strategy indicator, runnable on a bot , which works great on High Timeframes (1D is suggested) but also on lower ones (just write me in order to help you find correct settings) and even better on 1m Renko chart!
If you are a scalper, you will love suggested entries for fast profit. You can run it on 1h timeframe (below is not suggested, there is "no-trend" below 1h!) if you are used to scalp trading and close each trade whenever you feel happy (a proper trailing stop strategy is suggested anyway).
This strategy let's you edit following settings:
enable/disable signals on chart
enable/disable showing trend cloud
enable/disable bar coloring based on trend
enable/disable background coloring based on trend
enable a special option to enhance trend cloud on FOREX/Stocks charts (optional)
edit trend period length (you have to increase it if you go on lower timeframes, like 1h)
This strategy only trigger 1 buy or 1 sell. In order to get notified when a signal is triggered, you need to use the "alarms" version of this indicator.
Strategy results are calculated on the timeframe from August 2017 to now, so on almost 2 years and half, using 10000$ as initial capital and working at 1x leverage (so no leverage at all! If you like to use leverage, be sure to use a safe option, like 3x or 5x at most in order to have liquidation price very far).
This is not the "Holy Grail", so use a proper risk management strategy.
This script will let you set all notifications you may need in order to be alerted on each triggered signals.
The one for backtesting purpose can be found by searching for the astropark's "trend is your friend" and then choosing the indicator with "strategy" suffix in the name, or you can find here below
This is a premium indicator , so send me a private message in order to get access to this script.

Trend Scalper (Expo)Trend Scalper (Expo)
DESCRIPTION
Trend Scalper (Expo) is a Scalping strategy based on RSI, Stochastic and moving averages techniques. The idea is to visualize scalping opportunities in trends.
The trend is determined by the color of the moving average called ‘TrendHolder’ The ‘Trendholer’ consists of 3 colors, green, red and orange. Green is a positive trend, red is a negative trend and orange is a neutral or no trend.
Scalping opportunities are visualized by the circles and the triangles. The circles are based on RSI calculation. The triangles are based on Stochastic calculation.
- If there is a green circle and a green triangle and ‘Trendholder’ is orange or green, Enter Long!
- If there is a red circle and a red triangle and ‘Trendholder’ is orange or red, Enter Short!
Combine the indicator with HEIKIN ASHI candlesticks.
HOW TO USE
1. Use the indicator to find scalping opportunities in trends.
I NDICATOR IN ACTION
BTCUSD
EURUSD
GOLD
The indicator works with RENKO, HEIKIN ASHI and with KAGI charts as well.
I hope you find this indicator useful, and please comment or contact me if you like the script or have any questions/suggestions for future improvements. Thanks!
I will continue to work on this indicator, so please share your experience and feedback with me so that I can continuously improve it. Thanks to everyone that have contacted me regarding my scripts. Y our feedback is valuable for future developments!
ACCESS THE INDICATOR
• Contact me on TradingView or use the links below
-----------------
Disclaimer
Copyright by Zeiierman.
The information contained in my scripts/indicators/ideas does not constitute financial advice or a solicitation to buy or sell any securities of any type. I will not accept liability for any loss or damage, including without limitation any loss of profit, which may arise directly or indirectly from use of or reliance on such information.
All investments involve risk, and the past performance of a security, industry, sector, market, financial product, trading strategy, or individual’s trading does not guarantee future results or returns. Investors are fully responsible for any investment decisions they make. Such decisions should be based solely on an evaluation of their financial circumstances, investment objectives, risk tolerance, and liquidity needs.
My scripts/indicators/ideas are only for educational purposes!

BO_BOT (LONG and SHORT)Simple script making easy to see when what session begins also overlaps and ends.

[astropark] Breaker Blocks, Supply Demand Order BlocksDear Followers,
today a new powerful indicator! Welcome to the great world of Breaker Blocks (BB) and Supply-Demand Order Blocks !
So what's the point? As always, the point is how to trade as safer as possible!
Breaker Blocks are price ranges where you simply have to wait for a pullback and sell-buy on its touch and price bounce, like in the screenshot below:
Supply and Demand are very important concepts, synonymous of Support and Resistance in most cases.
You should never sell whenever near a demand/support zone, unless price breaks through it as too weak. The same for supply/resistance: you should not buy near resistance, as most times you may start a trade with very high losing risk.
Here a screenshot how indicator works showing supply and demand order blocks (just enable them from indicator's option):
This indicator
can analyze chart based on high-low candle prices or open-close one
can show you Breaker Blocks (BB)
can show you Supply & Demand Order Blocks (OB)
lets you decide if you want to see high-low or open-close range of each OB
lets you edit the analysis window
lets you see local tops and bottoms of price as labels
This is a premium indicator , so send me a private message in order to get access to this script .

[astropark] Support Resistance Trendlines Swing PointDear Followers,
I'm very happy to publish this new tool, which will help you easily find
basic trend momentum (red if a bearish momentum is found, green viceversa)
Support Levels (where you can place your buy orders or short targets)
Resistance Levels (where you can place your sell orders or long targets)
Trendlines , known as diagonal supports and resistances (if price breaks a green one, then it's time to buy/long! otherwise if price breaks a red one, then it's time to sell/short)
Donchian Channel , which will memorize for you latest highs and lows, which may get retested for example
Swing Point , very useful point where to open a position while price holding above or below it
This script:
works on all timeframes
lets you edit each support-resistance cloud settings
lets you activate a third support-resistance cloud if you like
lets you choose if enable only one or disable all of them or whatever combination...
lets you choose to enable or disable trendlines, basic trend, donchian channel, swing point, etc... So very customizable user experience!
This is a premium indicator , so send me a private message in order to get access to this script.

[astropark] Renko OBV divergencesDear Followers,
today a new great Scalper Tool , based on Ob Balance Volume (OBV) oscillator, which works from 1 minute timeframe Renko chart , which is the best and more secure timeframe to use on a Renko chart. But of course it works great on all timeframes (included the 1D timeframe), both on FOREX and on Cryptocurrencies!
This tool has some cool features:
it works on all timeframes , starting from 1 minute: so you can enjoy high-frequency trading by using a 24/7 running bot and a proper money and risk management strategy
it shows you both bullish and bearish divergences with a triangle up or down respectively
when it finds a strong bullish/bearish divergence , a flag will be displayed instead of a triangle
This script will let you set all notifications you may need in order to be alerted on each triggered divergence.
You may like to use it together with my Renko Scalper V2
and my Renko RSI Divergences indicator
On Bitmex/ByBit/Binance Bitcoin/USD chart best settings is Traditional Renko chart with 10$ box size, while 0.5$ box size is suggested on Ethereum/USD pair.
This is a premium indicator , so send me a private message in order to get access to this script.

[astropark] Bullish Bearish Divergences for all OscillatorsDear Followers,
today a new great Scalper Tool , which works excellent on all timeframes and charts , both FOREX and Cryptocurrencies!
It alerts you when a new divergence has been spotted on the chart based on your preferred oscillator or set of oscillators ( yes, you can combine them! )
Here the list of currently supported oscillators (more in the future):
RSI (Relative Strength Index)
MACD
MACD Histogram
Stochastic
Stochastic RSI
CCI (Commodity Channel Index)
Momentum
Volume Oscillator
OBV (On Balance Volume)
VWmacd
Bollinger Bands %B
William %R
Chaikin Money Flow
Chaikin Oscillator
AO (Awesome Oscillator)
DPO (Detrended Price Oscillator)
Ultimate Oscillator
RVI (Relative Volatility Index)
Klinger Oscillator
This script will let you set all notifications you may need in order to be alerted on each triggered divergence (both regular and hidden).
This script:
works on all timeframes , starting from 1 minute: so you can enjoy high-frequency trading by using a 24/7 running bot and a proper money and risk management strategy if you like
shows you both bullish and bearish divergences, both regular and hidden , with a triangle up or down respectively
lets you activate more than one oscillator at the same time
lets you choose to be alerted only if all active oscillators agree on spotted divergence , so you will get only stronger and more secure ones (you can set both all or at least a configurable number of enabled oscillators)
lets you edit basic configuration settings of each oscillator
lets you disable or enable hidden divergences on chart
This is a premium indicator , so send me a private message in order to get access to this script.

CoT Absolute Percent-Buschi
English
I'm often asked to provide an alternate view on the CoT data. For example, the indicator "Commercial index" is an oscillator from 0 to 100, but oftentimes it can be helpful to look at the absolute position. So, here the absolute position of certain parts of the CoT report are given, alongside with the percentage of a given time frame to put them in place.
The inputs are:
CoT Part Number ('1' for Commercials Short, '2' for Commercials Long, '3' for Commercials Netto, '4' for Large Speculators Short, '5' for Large Speculators Long, '6' for Large Speculators Netto, '7' for Small Speculators Short, '8' for Small Speculators Long, '9' for Small Speculators Netto, '10' for Open Interest)
Review Period (in years, just used for the percentage)
Percent Line 1, 2, 3, 4 (just to provide some lines which can be altered as required)
DISCLAIMER: I'm aware of Pine Script's ability to provide options as inputs (which would be much nicer for the CoT Parts). Alas, it is only available since version 3, and I noticed that for some reason the CoT data is not correctly adjusted to last Tuesday when using higher versions than 1. If someone knows a solution, please contact me.
Deutsch
Ich werde oft gefragt, eine alternative Sicht auf die CoT-Daten zu geben. Der Indikator "Commercial Index" zum Beispiel schwankt als Oszillator zwischen 0 und 100, aber oft kann der Blick auf die absolute Positionierung hilfreich sein. Also werden hier die Absolutpositionen verschiedene CoT-Bestandteile wiedergegeben, zusammen mit einer prozentualen Einteilung über eine vorgegebene Zeitspanne, um sie einordnen zu können.
The Eingaben lauten:
CoT Part Number ('1' Commercials Short, '2' Commercials Long, '3' Commercials Netto, '4' Large Speculators Short, '5' Large Speculators Long, '6' Large Speculators Netto, '7' Snall Speculators Short, '8' Small Speculators Long, '9' Small Speculators Netto, '10' Open Interest)
Review Period (Zeitintervall in Jahren, um die Prozentlinien zeichnen zu können)
Percent Line 1, 2, 3, 4 (um die Prozentlinien zur Verfügung zu stellen, die dann beliebig geändert werden können)
DISCLAIMER: Ich weiß über die Möglichkeit Bescheid, ab Pine Script Version 3 Optionen als Eingaben benutzen zu können (was deutlich angenehmer für die CoT-Bestandteile wäre). Leider habe ich gemerkt, dass die CoT-Daten bei Versionen über 1 leider nicht korrekt auf letzten Dienstag adjustiert werden, keine Ahnung warum. Falls jemand eine Lösung kennt, bitte kontaktieren.


Alpha - Bybit Directional MetricsThis is only for BTCUSD contracts on the Bybit exchange.
Alerts are built-in and working.
No Repainting nonsense.
Important:
This indicator will ONLY work for the ticker it is built for. It will not plot if you try and apply it to a different ticker.
Features:
Select the prefered lookback length, either Short or Long. If looking for a more reactive means of calculation then use Short. If you want more data taken into account giving a greater average then use Long.
Green bar color represents a LONG opportunity
Red bar color represents a SHORT opportunity
This has been built specifically for @Rektproof for his trading comp so good luck fam. Killem.

Stochastic Pro Suite (Zeiierman)█ Overview
Stochastic Pro Suite (Zeiierman) is a full stochastic trading framework built on top of an Efficient Price engine. Instead of feeding the oscillator with raw price data, the script first converts price into a volatility-aware, efficiency-weighted path called Efficient Price and then builds a stochastic on that foundation. Every major component, including EP Stochastic, Significant Stochastic Moves, divergence logic, inefficiency regimes, momentum impulses, and the multi-timeframe dashboard, reads from this refined stream.
The result is a stochastic that still behaves like the familiar 0–100 %K/%D oscillator, but with far more context behind every move. It doesn’t simply tell you where the price is within a recent high–low range; it tells you how reliable that move is, how clean the underlying regime is, and when the internal rotation is stretched. The tool works equally well for traders who like classic overbought/oversold swings and those who prefer higher-level context such as pressure bands, regime shifts, and impulse-driven moves.
⚪ Why This One Is Unique
Most stochastic indicators calculate %K and %D directly from the recent high–low range. Stochastic Pro Suite goes a step earlier in the chain. It first runs the chosen EP source (Close, Mean-reversion, or Trend) through a two-stage Efficient Price model that adapts to volatility, filters out random zigzags, and emphasizes directional quality. Only then is the stochastic calculation applied.
This means that when the oscillator hugs the top of its range, it’s not just reacting to any move up; it’s reacting to price movement that has already passed through an efficiency filter. Shallow, noisy moves tend to be down-weighted; clean, committed pushes stand out more. Around this EP Stochastic core, the script layers:
Significant Stochastic Moves to track internal pressure zones,
Divergence detection based on EP-Stochastic pivots,
An inefficiency layer that flags distorted regimes,
A momentum impulse engine focused on unusually strong surges, and
A dashboard that stitches everything together across multiple timeframes.
█ Main Features
⚪ EP-Based Stochastic
At the core is an EP-Stochastic built on Efficient Price instead of raw highs and lows. The oscillator keeps the classic stochastic look:
0–100 scale,
Upper and lower tension zones,
A midline representing balance,
Signal line via several moving-average types.
What changes is the input: instead of loosely tracking every tick, the EP engine compresses noisy swings and lets structured moves dominate the signal. This makes the stochastic more stable in directionally clean phases and more revealing when the market truly rotates.
You can choose between three EP behaviors to shape how the oscillator responds:
Close
The engine follows price almost one-to-one, but with the benefit of efficiency filtering. This setting is ideal if you want a familiar, general-purpose stochastic feel with fewer random spikes and more meaningful tests of the bands.
Mean-reversion
Here, the EP source emphasizes swing turns and back-and-forth rotation. The stochastic becomes a dedicated swing tool: transitions between upper and lower zones become more pronounced, and range-bound behavior is easier to read. This mode is well-suited for traders who fade extremes or trade oscillations inside a broader sideways structure.
To get better mean-reversal signals, increase the Stochastic Length to 200 and the Efficiency Length to 20.
Trend
In Trend mode, the EP source is smoothed to emphasize directional movement. When a trend is strong, the oscillator stays mostly in one half of its range and usually remains there until the trend begins to weaken. This makes it easier to see whether a pullback is just a pause in the trend or a sign that the structure is starting to roll over.
If you increase the EP Length, a more filtered trend will appear.
⚪ Significant Stochastic Moves
Instead of only watching fixed numerical levels like “80” or “20,” the suite identifies where the oscillator is trading within its own evolving range. Significant Stochastic Moves appear when the EP Stochastic pushes into internally important zones, areas where the market has historically shown heightened reaction or follow-through.
These highlights show when the stochastic is pressing into one of its key pressure zones. This helps you distinguish between normal rotation and moments where the internal push becomes strong enough to deserve attention. To identify significant moves, switch to Mean-reversion mode.
⚪ Divergence Detection
The script includes automatic detection of regular bullish and bearish divergences between the EP-Stochastic and price:
Bullish divergence: price makes a lower low while the EP-Stochastic prints a higher low.
Bearish divergence: price makes a higher high while the EP-Stochastic prints a lower high.
These are drawn directly on the oscillator pane with clear labels. Because the oscillator is driven by Efficient Price, many of the “random” divergences you see with standard stochastic are filtered out, leaving fewer but more structurally relevant signals, especially around extended trends, tight ranges, and turning points. To detect divergence, switch to Mean Reversion mode.
Since this divergence function is based on price-efficiency rather than traditional momentum swings, some divergences may appear a bit unconventional; however, the accuracy is on an entirely different level.
⚪ Momentum Impulses
Momentum impulses focus on moments when the oscillator accelerates unusually quickly relative to its own recent behavior.
Green circles near the upper region highlight powerful bullish surges.
Red circles near the lower region highlight powerful bearish surges.
The underlying logic exaggerates only the strongest deviations and ignores routine oscillation. These impulses often coincide with breakout thrusts, exhaustion spikes, sharp squeezes, or capitulation moves, places where the market briefly abandons its usual rhythm. They’re not a stand-alone trading system, but a visual cue that something unusually strong just happened in the stochastic structure.
⚪ Inefficiency Regime
The inefficiency engine monitors how orderly or distorted the combined price–stochastic behavior is. When the internal regime becomes noisy, spiky, or unbalanced, the script marks blue diamonds around the mid-region of the oscillator.
These diamonds tend to cluster when:
A previously clean trend starts to fragment,
A range becomes unstable and prone to fake breakouts,
Moves extend beyond what the recent structure would consider “normal.”
Used together with Significant Stochastic Moves, impulses, and divergence, these inefficiency markers help you distinguish between healthy follow-through and movement that is increasingly fragile.
⚪ Visual Multi-Timeframe Dashboard
On the right edge of the pane, a compact dashboard summarizes several key elements across 5M, 15M, 1H, 2H, 4H, and 1D:
Signals: immediate directional bias from the stochastic context,
OB/OS flags: stretched conditions by timeframe,
Divergence: where the structure disagrees with price,
Impulse: active momentum bursts,
Inefficiency: unstable or imbalanced regimes,
Explosive: high-energy conditions highlighted by Significant Stochastic Moves.
Think of it as a “stochastic climate map.” Instead of checking six separate charts, you get a quick snapshot of whether lower timeframes are in sync with the higher backdrop, or whether they are fighting each other. This is extremely helpful for multi-timeframe alignment and for deciding when to be aggressive versus when to stay defensive.
█ How to Use
⚪ Classic Stochastic Trading
Interpreting EP-Stochastic is similar to classic stochastic, but cleaner:
Sustained time above the midline signals a bullish rotational bias in the Efficient Price space.
Sustained time below the midline signals a bearish rotational bias.
When the oscillator repeatedly leans against the upper zone with a strong signal line, it indicates firm buyer control; when it leans against the lower zone with a soft or falling signal line, it indicates firm seller control.
When using “Close” as the EP Source, consider increasing the Efficiency Length to above 10 to produce more trend-like behavior.
⚪ Trend Trading
For trend trading, Trend mode is your core setting:
Use Trend mode with a moderate or slightly longer stochastic length.
Watch whether the oscillator lives mostly in the top or bottom half of its range.
Use the dashboard to see if higher timeframes show similar directional signals and OB/OS flags.
Impulse markers and Significant Stochastic Moves can be treated as continuation confirmations when they appear in the direction of the trend. Inefficiency diamonds and fading impulses act as early warnings that the current leg is losing coherence and may transition into consolidation or reversal. Inefficiency diamonds also signal imbalance in the market, where price can move quickly as the structure becomes unstable.
⚪ Pullback Trading
One useful workflow:
Run EP-Stochastic in Trend mode to define the dominant direction and regime.
Overlay a shorter, standard stochastic to spot pullbacks inside that regime.
When the EP-Stochastic clearly favors one side (mostly upper-half behavior in an up move, lower-half in a down move), wait for the short stochastic to cycle into its opposite extreme (oversold in an uptrend, overbought in a downtrend).
Entries during those counter-swings, especially when they coincide with impulse exhaustion in the opposite direction, often give cleaner, better-timed participation in the ongoing trend.
⚪ Overbought/Oversold Trading
Overbought zones represent strong buying pressure. When the stochastic becomes overbought, start watching for signs that buying pressure is fading.
If buying pressure continues, it typically indicates a strong bullish trend.
If the stochastic starts to decline and crosses back under the upper band, it can signal that buying pressure is weakening and a potential reversal is forming.
Oversold zones represent strong selling pressure. When the stochastic becomes oversold, start looking for signs that selling pressure is easing.
If selling pressure persists, it usually indicates a strong bearish trend.
If the stochastic begins to rise and crosses back above the lower band, it can signal that selling pressure is fading and a potential reversal is developing.
⚪ Mean-reversion Trading
Switch to Mean-reversion mode, increase the EP Source Length to 200, and reduce the Stochastic Length to 20 when you’re primarily focused on turning points and range rotation.
Look for clear spikes or peaks in the indicator, short-term bursts that quickly reverse. These moments often signal market conditions with a high likelihood of mean reversion, making a snapback in the opposite direction more likely.
⚪ Divergence Trading
When you want to focus on structural turning points rather than trend following:
Enable divergence detection.
Focus on divergences that form after extended moves or near the outer zones of the oscillator.
Bullish divergences emerging from deep lower regions can confirm early long ideas or justify scaling in as pressure transitions from aggressive selling to rotational buying. Bearish divergences out of extended upper regions can support profit-taking or exploratory short positions. The EP-Stochastic basis helps reduce “false” divergences that arise from random noise.
To get more divergence signals, consider switching to Mean-reversion mode and increasing the Efficiency Length to 20. Keep in mind that some divergences may appear “weird” or different from traditional divergence patterns—this is because they are based on Efficient Price, which uses a completely different detection engine in the background.
⚪ Breakout Trading
For breakout and breakdown scenarios, use:
Significant Stochastic Moves as evidence of a meaningful internal shift,
Impulse markers to confirm that the move is carried by strong momentum,
Inefficiency diamonds to recognize when the structure is becoming unstable.
When price breaks a level and the EP Stochastic prints a Significant Move in the direction of the break, backed by fresh impulses, it signals that the breakout is supported by internal strength.
⚪ Reversal Trading
Enable the reversal signals to identify potential turning points. Use them together with quick peaks in the stochastic oscillator. If the oscillator forms a peak and a reversal signal appears nearby, it strengthens the case for a reversal. However, if a reversal signal prints while the stochastic is simply leaning toward the upper or lower band without forming a clear peak, the signal carries less significance.
⚪ Interpreting Inefficiency Diamonds
Inefficiency diamonds highlight imbalance points in the market. When they appear, they signal that price and order flow are no longer in harmony, creating unstable conditions. These imbalance points often lead to sharp or sudden moves as the market snaps to correct the inefficiency.
Clusters of diamonds indicate a stronger imbalance and a higher likelihood of fast movement or abrupt shifts in direction.
⚪ Overview Panel
Use the multi-timeframe dashboard as a context checklist rather than a mechanical entry system. It quickly answers:
Are lower and higher timeframes pointing in the same direction?
Are multiple frames overbought or oversold at once?
Are impulses and inefficiency regimes showing up in isolation or in clusters?
█ How It Works
⚪ EP Source and Pre-EP Layer
The system begins by selecting an internal driver such as Close, Mean-reversion, or Trend. This source is evaluated through an efficiency model that measures how clean or noisy recent movement has been. Each increment is weighted by its structural quality and volatility conditions, producing a preliminary Efficient Price stream that favors meaningful directional progress over random chop.
Calculation: Applies efficiency weighting, volatility normalization, and adaptive length control. The output is a first-stage EP path that encodes directional reliability.
⚪ Main EP Engine and Adaptive Refinement
The preliminary EP stream is passed through a second refinement stage. This step smooths irregularities, boosts consistent movement, and remains sensitive to shifts in volatility regimes. The result is a fully refined Efficient Price path that forms the input for the EP-Stochastic rather than using raw highs and lows.
Calculation: Uses a second ER pass with volatility moderation and cumulative weighting. The output is the core Efficient Price trajectory used to build the EP-Stochastic.
⚪ EP-Stochastic Construction
Instead of calculating %K from raw price highs and lows, the oscillator is derived from where the refined Efficient Price sits within its own recent EP range. This keeps the stochastic familiar in shape but far more structurally coherent.
Calculation: Determines the EP range over the selected window, computes %K from EP’s position within that range, and applies optional smoothing for the signal line.
⚪ Inefficiency–Trend
This component evaluates the Efficient-Price-driven stochastic through two behavioral lenses: inefficiency and trend. Inefficiency highlights spike-driven, unstable, or imbalanced movement, while the trend component captures underlying slope, persistence, and regime strength. A smooth transition blends these two views depending on the system’s efficiency state.
Calculation: Computes an inefficiency score from ER deviation and a trend score from normalized regression slope. A smoothstep blend transitions between them, and diamond markers appear when the oscillator confirms it is operating inside an inefficiency regime.
⚪ Momentum Impulse
Momentum impulses isolate powerful rotations inside the EP-Stochastic. Only the sharpest acceleration bursts make it through, while routine oscillation is suppressed.
Calculation: Applies chained non-linear transforms to exaggerate extreme deviations, compares them to local historical envelopes, performs a cluster check to avoid false bursts, and marks impulses only when the deviation is structurally significant.
-----------------
Disclaimer
The content provided in my scripts, indicators, ideas, algorithms, and systems is for educational and informational purposes only. It does not constitute financial advice, investment recommendations, or a solicitation to buy or sell any financial instruments. I will not accept liability for any loss or damage, including without limitation any loss of profit, which may arise directly or indirectly from the use of or reliance on such information.
All investments involve risk, and the past performance of a security, industry, sector, market, financial product, trading strategy, backtest, or individual's trading does not guarantee future results or returns. Investors are fully responsible for any investment decisions they make. Such decisions should be based solely on an evaluation of their financial circumstances, investment objectives, risk tolerance, and liquidity needs.

[astropark] Crypto Swing Trading [alarms]Dear Followers,
today a Swing Trading Strategy , runnable on a bot , which works great from 30m timeframe and above. Best suggested timeframes are 1h and 4h.
If you are a scalper, you will love suggested entries for fast profit. You can run it from 1 minute timeframe if you are used to scalp trading and close each trade whenever you fell happy (a proper trailing stop strategy is suggested anyway).
This indicator can trigger till 5 or 20 buy or sell signals in a row before reverting (it changes greatly depending on timeframe you use), so use a proper money management .
This script will let you set alarms whenever a Buy or a Sell signal is drawn on chart. This way you can set all notifications you may need in order to be alerted on each triggered signal.
The backtesting-strategy version of this script can be found here below or by searching for "Crypto Swing Trading" and then choosing the "strategy" version.
Strategy results are calculated on the timeframe from January 2018 to now, so on about 2 years, using 10000$ as initial capital and working at 3x leverage (very safe leverage!).
This is not the "Holy Grail", so use a proper risk management strategy.
This is a premium indicator , so send me a private message in order to get access to this script.

Leledc Exhaustion Bar V4 PLUSLeledc Exhaustion Bar indicator created by glaz converted to Pine 4, plotshape was added.

MACDTraderPro for BTC with LONG & SHORT AlertsMostly based on MACD analysis this trend indicator accurately shows you when main trend changes.
It has LONG and SHORT labels and you can use it with tradingview alerts to be in touch and for automated trading bots.
You can use it both with margin(bitmex, bitfinex, etc) and main exchanges (binance and more) with bitcoin for now and soon for alts also.

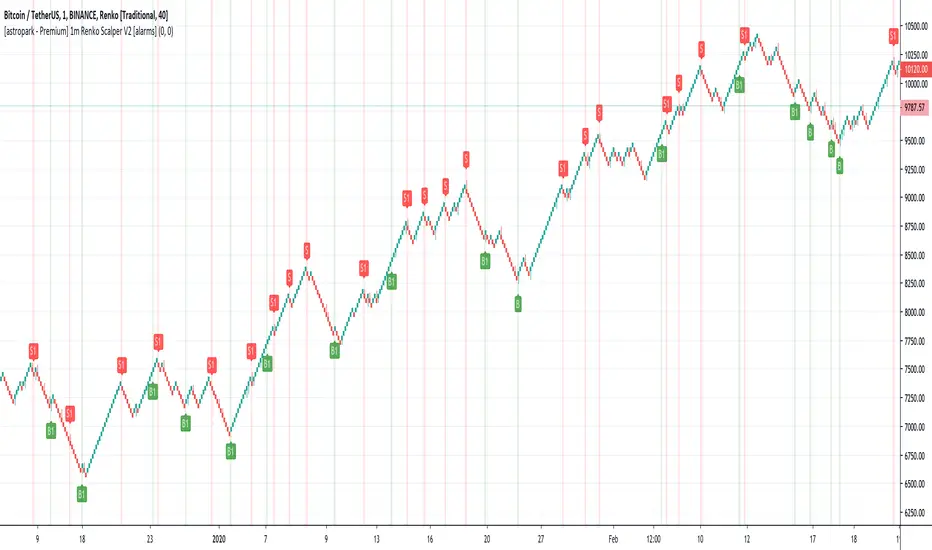
[astropark - Premium] 1m Renko Scalper V2 [alarms]Dear Followers,
today a new Scalper Tool , which works great on 1 minute timeframe , which is the best and more secure timeframe to use on a Renko chart, besides it works great up to 15m (I don't suggest to use a renko chart over 15m timeframe)!
It is an upgraded version of Bitmex Renko Scalper that you can find in my tradingview script page.
This tool has some cool features:
it works on 1 minute timeframe : so you can enjoy high-frequency trading by using a 24/7 running bot;
wait bricks optional mode : you may like to make script wait for triggering a new signal by waiting 1 or 2 more confirmation bricks
trailing stop : you can set a trailing stop in trade, so script will alert you if it will be reached in chart
This strategy can trigger till 5 buy or 5 sell signals in a row before reverting, so use a proper money management .
Strategy results are calculated on the timeframe from july to now, so on about 4 months, using 10000$ as initial capital and working at 3x leverage (very safe leverage!).
The user who wants to use this strategy, especially via an automated bot, must always set a stoploss at 5% from entry point or use a proper risk management strategy .
This is not the "Holy Grail", so use it with caution.
This script will let you set all notifications you may need in order to be alerted on each triggered signals.
The backtesting script version of this indicator, which will let you backtest this script and find best settings for your preferred market, can be found here below:
On Bitmex XBTUSD chart best settings is Traditional Renko chart with 10$ box size.
This is a premium indicator , so send me a private message in order to get access to this script .
[BERA] PILE OF SIGNALSHey bulas and beras, another indicator for help your decision.
Ok lets start.
PILE OF SIGNAL, i admit the last word of the title was a bad word and changed to avoid permaban ok lol ahah.
Description= this indicator use moving averages crosses and volume as decision point, what mean this? simple when a move is coming this indicator will show you the probable "direction" of next move. these signals are not buy and sell, also because multiple signals can occour, you should use it with you own TA.
-Moving Averages
-Crosses
-Volume
RED ARROW ABOVE BAR= PROBABILITY OF DOWN MOVE INCOMING
STARS BELOW BAR= PROBABILITY OF UP MOVE INCOMING
Simple.
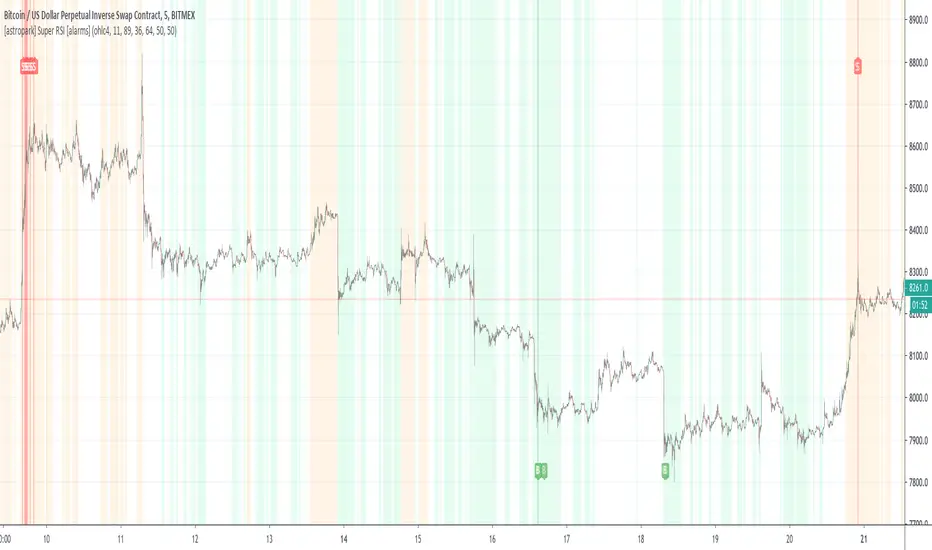
[astropark] Super RSI [alarms]Dear Followers,
today a new Scalper Tool , which works great on 3 minutes and 5 minutes timeframes , but also down to 1m and up to 30m!
I called it " Super RSI ", as it is based on RSI and inherits some basic functionality from it.
If you check its settings, you will see that you can have 3 different buy-sell sources (first two are active by default):
STRONG BUY/SELL : buy when white area deeply falls into oversold-red zone and sell when white area gets into overbought-green zone (you can set and edit at which level oversold and overbought zones start);
CROSSES : buy when the black RSI line in the middle between red and green area cross under the buy cross limit value and sell when it crosso over the sell cross limit value (you can set and edit specific cross ranges for both buy and sell);
WEAK BUY/SELL : buy when green area at least go below 50 level and sell when red area at least goes above 50 level (you can edit both levels); these conditions are highlighted as background color and are very useful for taking (at least partial) profits in trades.
By default the script will be placed as overlay on the chart, but
> you can activate the oscillator plot by disabling the "hide all plot" option
> and place it in a below pane by clicking on the black arrow at then end on the indicator name in chart and selecting "move to -> a new pane below"
This strategy can trigger till 10 buy or 10 sell signals in a row before reverting, so use a proper money management .
Strategy results are calculated on 20 trading days using 1000$ as initial capital and working at 10x leverage.
The user who wants to use this strategy, especially via an automated bot, must always set a stoploss at 3-5% from entry point or use a proper risk management strategy .
This is not the "Holy Grail", so use it with caution.
This script will let you set all notifications you may need in order to be alerted on each triggered signals.
The backtesting script version of this indicator, which will let you backtest this script and find best settings for your preferred market, can be found here below:
This is a premium indicator , so send me a private message in order to get access to this script .
[astropark] Super Stochastic RSI [alarms]Dear Followers,
today a new Scalper Tool , which works great on 3 minutes and 5 minutes timeframes !
I called it " Super Stochastic RSI ", as it is based on StochRSI and inherits some basic functionality from it.
If you check its settings, you will see that you can have 3 different buy-sell sources (first two are active by default):
STRONG BUY/SELL : buy when green area deeply falls into oversold zone and sell when red area gets into overbought zone (you can set and edit at which level oversold and overbought zones start);
K/D CROSSES : buy when k-line cross above d-line and sell viceversa (you can set and edit specific cross ranges for both buy and sell);
WEAK BUY/SELL : buy when green area at least go below 50 level and sell when red area at least goes above 50 level (you can edit both levels); these conditions are highlighted as background color and are very useful for taking (at least partial) profits in trades.
By default the script will be placed as overlay on the chart, but
> you can activate the oscillator plot by disabling the "hide all plot" option
> and place it in a below pane by clicking on the black arrow at then end on the indicator name in chart and selecting "move to -> a new pane below"
This strategy can trigger till 10 buy or 10 sell signals in a row before reverting, so use a proper money management .
Strategy results are calculated on 20 trading days using 1000$ as initial capital and working at 10x leverage.
The user who wants to use this strategy, especially via an automated bot, must always set a stoploss at 3-5% from entry point or use a proper risk management strategy .
This is not the "Holy Grail", so use it with caution.
This script will let you set all notifications you may need in order to be alerted on each triggered signals.
The backtesting script version of this indicator, which will let you backtest this script and find best settings for your preferred market, can be found here below:
This is a premium indicator , so send me a private message in order to get access to this script .

AYN: Buy-, Sell-, Trend- and SwingSignals incl. AutoFibo
Hi,
i want to introduce you to my AllYouNeed-Indicator. I calculate the buy sell signals within different timeframes independent in wich timeframe you are, therefore Pinescript suppose the Signal could be repainted. I was not able to fix this error, but after frequent checks of the result i haven't found a single repaint. Please try it out and let me know me, if you still get caught by a repaint.
Features:
- Short, Mid and Longterm-Trends
- Buy and Sell Signals and Results as well with Labels (Prices, Percentage, Win/Lose)
- Length Multiplier for different Marketsituations
- Trend-Signals with Barcolors (Lime=Uptrend, Fuchsia=Downtrend)
- Swing-Signals with Barcolors (Lime=Upswing, Orange=Downswing)
- Auto-Fibonacci with changing Linecolors as Support(green) / Resistance(red)
Hope you like it, feel free to contact me for further informations.
Please leave a comment on what I can do better, thanks.
Best regards,
snurk
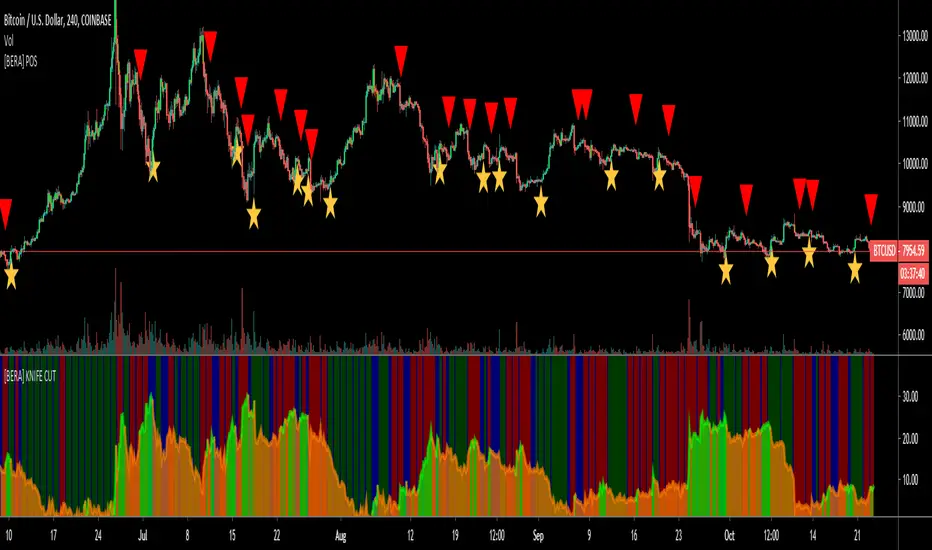
[BERA] SUper BOSSHey beras and bulas, this is another gift for you! work in sync with KNIFE CUT script
Please message me if you like my indicators. Thanks you.
This indicator work in sync with KNIFE CUT, check it.
SUper BOSS
Is a special indicator with 2 metrics you can use for be a better trade and stop losing money entering useless positions.
using also KNIFE CUT you will get up to 4 parameters you can compare, for enter only good trades.
This indicator can:
Supports and resistances area as point of reference.
OverBought, Oversold candles
Green line is a LONG, Red line is a SHORT.
4H example, work with all timeframes also for excellent 15m scalping.
SEE? many opportunities.
Tried this with 15m timeframe trading ALGO MOON or DOOM and the result is incredible.
With SUper BOSS and KNIFE CUT, you will earn money in any timeframe!
I may find 15 trades a day with this system.
See price history.
You not believe? i believe.
