Price Action Toolkit Lite [UAlgo]The Price Action Toolkit Lite is a comprehensive indicator designed to enhance your chart analysis with advanced price action tools. This powerful toolkit combines multiple technical analysis concepts to provide traders with a clear visualization of market structure, liquidity levels, order blocks, and trend lines. By integrating these elements, the indicator aims to offer a holistic view of price action, helping traders identify potential entry and exit points, as well as key levels of interest in the market.
🔶 Key Features
Market Structure Analysis: The indicator includes a ZigZag feature to highlight significant market highs and lows, aiding in the visualization of market structure changes and trends.
Liquidity Sweeps Detection: It identifies and displays liquidity sweeps, which are crucial for recognizing potential market reversals and areas of interest where significant price action is likely to occur.
Order Blocks: Automatically detects and draws order blocks, highlighting areas of institutional buying and selling pressure, which can serve as key support and resistance levels.
Trend Lines: The toolkit can draw and extend trend lines based on pivot points, providing a clear view of prevailing market trends and potential breakout points.
Customizable Settings: Users can adjust various settings, including the length of the ZigZag, liquidity detection sensitivity, the number of order blocks to display, and trend line detection parameters, allowing for a tailored analysis experience.
🔶 Disclaimer
The "Price Action Toolkit Lite " is intended for educational and informational purposes only.
It is not financial advice and should not be construed as such. Trading in financial markets involves substantial risk, including the risk of loss.
Past performance is not indicative of future results.
🔷 Similar Scripts
Liquidity

Liquidity Swings & SweepsThis Pine script indicator is designed to create a visual representation liquidity as identified by swing Highs/Lows along with an indication of the liquidity level that was swept, optionally rating the strength of the sweep based on time & price.
Relevance:
Liquidity levels & sweeps are crucial for many SMC/ICT setups and can indicate a point at which the price changes direction or may re-trace in an opposite direction to provide additional liquidity for continued move in the original direction. Additionally, liquidity levels may provide targets for setups, as price action will often seek to take out those levels as they main contain many buy/sell stops.
How It Works:
The indicator tracks all swing points, as identified using user-defined strength of the swing. Once a swing is formed that meets the criteria, it is represented by a horizontal line starting at the price of the current swing until the last bar on the chart. While the swing is valid, this line will continue to be extended until the swing is invalid or a new swing is formed. Upon identifying a new swing, the indicator then scans the earlier swings in the same direction looking for a point of greatest liquidity that was taken by the current swing. This level is then denoted by dashed horizontal line, connecting earlier swing point to the current. At the same time any liquidity zones between the two swings are automatically removed from the chart if they had previously been rendered on the chart. If the setting to enable scan for maximum liquidity is enabled, then while looking back, the indicator will look for lowest low or highest high that was taken by the current swing point, which may not be a swing itself, however, is a lowest/highest price point taken (mitigated) by the current swing, which in many cases will be better price then then the one represented by previous swing. If the option to render sweep label is enabled, the sweep line will also be completed by a label, that will score the sweep and a tooltip showing the details of the level swept and the time it took to sweep it. The score explained further in configurability section ranks the strength of the sweep based on time and is complemented by price (difference in price between the two liquidity levels).
Configurability:
A user may configure the strength of the swing using both left/right strength (number of bars) as well as optionally instruct the indicator to seek the lowest/highest price point which may not be previous swing that was taken out by newly formed swing.
From appearance perspective liquidity level colors & line width presenting the liquidity/swing can be configured. There is also an option to render the liquidity sweep label that will generate an icon-based rating of the liquidity sweep and a tooltip that provides details on the scope of the swing, which includes liquidity level swept and when it was formed along with the time it took to sweep the liquidity.
Rating is of sweeps is primarily based on time with a secondary reference to price
💥- Best rating, very strong sweep with an hourly or better liquidity sweep
🔥- Second rating, strong sweep with 15 – 59 minute liquidity sweep, or 5+ minute sweep of 10+ points
✅- Third rating, ok sweep with 5 - 15 minute liquidity sweep, or lower-time-frame sweep of 10+ points
❄️ - Weakest sweep, with liquidity of 5 or less minutes swept
What makes this indicator different:
Designed with high performance in mind, to reduce impact on chart render time.
Only keeps valid liquidity levels & sweeps on the chart
Automatically removes previously taken liquidity levels
Ranks liquidity sweeps to indicate strength of the sweep

Liquidity Founder The Liquidity Swings indicator aids traders in detecting liquidity swings within the market, providing essential insights for making well-informed trading decisions. Key features include:
How this Indicator work - this indicator search pivot point that is used to determine the levels at which price may face support or resistance. The Pivot Points indicator consists of a pivot point (PP) level and several support (S) and resistance (R) levels. if input number of bar selected 3 than it will look back 3 candle and wait for next 3 candle to make pivot high and low after it identify pivot it draw a line and extend until it no longer intersects with the high or low prices
What is different in my indicator compared to a normal pivot point and what Makes This Indicator Original :
1) Swing High and Low Logic:It avoids marking consecutive pivot highs until a new pivot low is formed, reducing market noise and highlighting significant trend reversals.
2)Volume Integration: By incorporating volume data, the indicator ensures that pivot points are validated with sufficient market activity, enhancing their reliability as support and resistance levels.
3) Multi-Time Frame Analysis:The ability to input and analyze multiple time frames allows the indicator to draw strong support and resistance levels that are relevant across different trading periods, making it versatile for various trading strategies.
🟠 Liquidity Swings indicator
✅Visualization of Liquidity Zones:Accumulation Areas: Identifying regions where liquidity is gathering.liquidity Sweeps: Pinpointing areas where liquidity is being cleared.
✅Pivot and Volume Analysis:Price Pivots: Monitoring significant pivots in price.
Volume Correlation: Linking price pivots with volume to highlight zones of potential support and resistance.
✅Market Dynamics Understanding:Enables traders to visualize and understand market dynamics more effectively.Assists in pinpointing potential support and resistance levels based on liquidity swings.
⭐Example -EurUsd 1 minutes chart developed Potential Support and Resistance Zone
⭐⭐⭐Key Features:
1) Adjustable Time Frame: Allows traders to analyze different periods by modifying the time frame setting.
2) Swing Look back Period: Sets the period for identifying potential price swings, enhancing flexibility in analysis.
🟠 Understanding Strong Support :These are identified by dense clusters of green lines, indicating high concentrations of buy orders that have not yet been executed. These areas suggest strong buying interest which can potentially halt further price declines.
⭐ Example -below chart image BtcUsd 5 minutes 2 line are still not touched by price
⭐⭐⭐Reasons for Strong Support:
✅Untouched Liquidity Lines: These green lines represent pending buy orders, indicating robust buying interest at these levels.
✅Accumulation of Orders: Many buy orders are aggregated in these zones, capable of preventing further price drops when approached.
✅ Historical Performance: These areas have previously prevented price declines, establishing them as reliable support zones.
✅ Market Confidence: Close clustering of green lines signifies widespread trader belief in favorable buying conditions, reinforcing support strength.
🟠 Understanding Strong Resistance :Highlighted by dense clusters of red lines, denoting substantial sell orders that did not executed. These zones signify significant selling interest which can impede further price increases.
⭐ Example -below chart image Btcusd 3 minutes 3 line did touched by price previously .price touched that area and retraced because of unfilled liquidity
⭐⭐⭐ Reasons for Strong Support:
✅ Untouched Liquidity Lines: These green lines represent pending buy orders, indicating robust buying interest at these levels.
✅ Accumulation of Orders: Many buy orders are aggregated in these zones, capable of preventing further price drops when approached.
✅ Historical Performance: These areas have previously prevented price declines, establishing them as reliable support zones.
✅ Market Confidence: Close clustering of green lines signifies widespread trader belief in favorable buying conditions, reinforcing support strength.
⭐⭐⭐ Usage of the Liquidity Founder Indicator ⭐⭐⭐
👍 Identifying Liquidity Zones: Pinpoints areas with dense clusters of pending buy (green) or sell (red) orders, providing initial entry points where significant buying or selling interest is concentrated.
👍 Avoiding Market Traps: Helps traders steer clear of market fluctuations or false breakouts by focusing on stable liquidity zones.
How to Use this indicator for Maximum benefit -
1) When the price approaches a cluster of resistance levels, traders should look for a candle showing rejection (e.g., a bearish reversal candle) to enter a short trade.
2)When the price approaches a cluster of support levels, traders should look for a candle showing rejection (e.g., a bullish reversal candle) to enter a long trade.
3) The identified liquidity levels offer a clear understanding of significant support and resistance areas, helping traders make more informed trading decisions.
4) Fake breakouts above resistance or below support clusters. If the price breaks above resistance and then falls back below, it can be a signal to enter a short trade vice versa if price break support cluster and back again above support cluster it can be a long trade

Pure Price Action Structures [LuxAlgo]The Pure Price Action Structures indicator is a pure price action analysis tool designed to automatically identify real-time market structures.
The indicator identifies short-term, intermediate-term, and long-term swing highs and lows, forming the foundation for real-time detection of shifts and breaks in market structure.
Its distinctive/unique feature lies in its reliance solely on price patterns, without being limited by any user-defined input, ensuring a robust and objective analysis of market dynamics.
🔶 USAGE
Market structure is a crucial aspect of understanding price action. The script automatically identifies real-time market structure, enabling traders to comprehend market trends more easily. It assists traders in recognizing both trend changes and continuations.
Market structures are constructed from three sets of swing points, short-term swings, intermediary swings, and long-term swings. Market structures associated with longer-term swing points are indicative of longer-term trends.
A market structure shift (MSS), also known as a change of character (CHoCH), is a significant event in price action analysis that may signal a potential shift in market sentiment or direction. Conversely, a break of structure (BOS) is another significant event in price action analysis that typically indicates a continuation of the prevailing trend.
However, it's important to note that while an MSS can be the first indication of a trend reversal and a BOS signifies a continuation of the prevailing trend, they do not guarantee a complete reversal or continuation of the trend.
In some cases, MSS and BOS levels may also act as liquidity zones or areas of price consolidation, rather than indicating a definitive change in market direction or continuation. Traders should approach them with caution and consider additional factors to confirm the validity of the signal before making trading decisions.
🔶 DETAILS
🔹 Market Structures
Market structures are based on the analysis of price action and aim to identify key levels and patterns in the market, where swing point detection is one of the core concepts within ICT trading methodologies and teachings.
Swing points are automatically detected solely based on market movements, without any reliance on user-defined input.
🔹 Utilizing Swing Points
Swing points are not identified in real time as they occur. While short-term swing points may be displayed with a delay of at most one bar, the identification of intermediate and long-term swing points depends entirely on market movements. Furthermore, detection is not limited by any user-defined input but relies solely on pure price action. Consequently, swing points are not typically utilized in real-time trading scenarios.
Traders often analyze historical swing points to discern market trends and pinpoint potential entry and exit points for their trades. By identifying swing highs and lows, traders can:
Recognize Trends: Swing highs and lows help traders identify the direction of the trend. Higher swing highs and higher swing lows indicate an uptrend, while lower swing highs and lower swing lows indicate a downtrend.
Identify Support and Resistance Levels: Swing highs often serve as resistance levels, known in ICT terminology as Buyside Liquidity Levels, while swing lows function as support levels, also referred to in ICT terminology as Sellside Liquidity Levels. Traders can utilize these levels to strategize entry and exit points for their trades.
Spot Reversal Patterns: Swing points can form various reversal patterns, such as double tops or bottoms, head and shoulders patterns, and triangles. Recognizing these patterns can signal potential trend reversals, allowing traders to adjust their strategies accordingly.
Set Stop Loss and Take Profit Levels: In the context of ICT teachings, swing levels represent specific price levels where a concentration of buy or sell orders is anticipated. Traders can target these liquidity levels/pools to accumulate or distribute their positions, essentially using swing points to establish stop loss and take profit levels for their trades.
Overall, swing points provide valuable information about market dynamics and can assist traders in making more informed trading decisions.
🔶 SETTINGS
🔹 Structures
Swings and Size: Toggles the visibility of the structure's highs and lows, assigns an icon corresponding to the structures, and controls the size of the icons.
Market Structures: Toggles the visibility of the market structures.
Market Structure Labels: Controls the visibility of labels that highlight the type of market structure.
Line Style and Width: Customizes the style and width of the lines representing the market structure.
Swing and Line Colors: Customizes colors for the icons representing highs and lows, and the lines and labels representing the market structure.
🔶 RELATED SCRIPTS
Market-Structures-(Intrabar).
Buyside-Sellside-Liquidity.

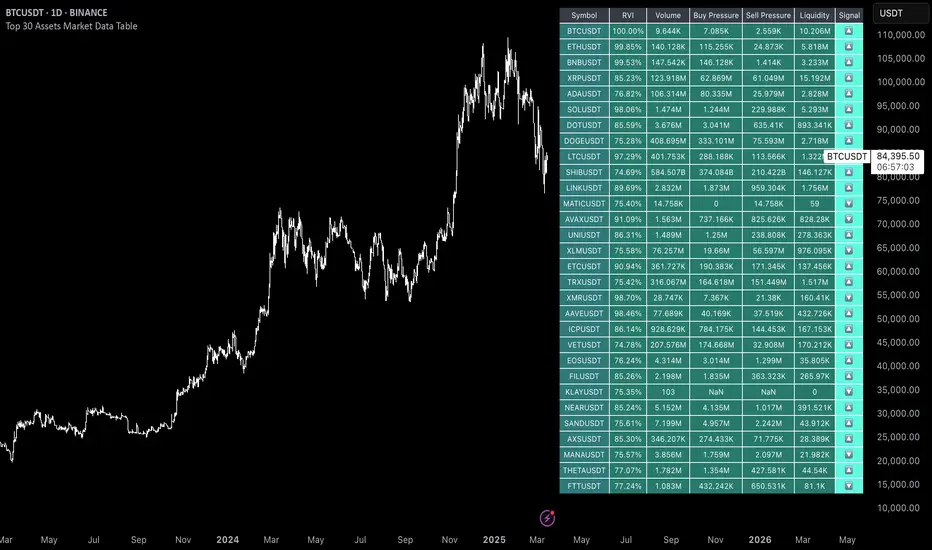
Uptrick: 6 Coins Market Data TableThe "Uptrick: 6 Coins Market Data Table" indicator is a sophisticated tool designed to provide a comprehensive snapshot of the market data for six major cryptocurrencies. This tool displays crucial information in a table format directly on the chart, enabling traders to make informed decisions quickly. It focuses on providing key metrics such as the Relative Volatility Index (RVI), volume, buy and sell pressure, and liquidity for each coin. The primary purpose of this indicator is to consolidate essential market data for multiple cryptocurrencies into a single, easy-to-read table. This facilitates quick analysis and comparison, helping traders assess market volatility and momentum using the Relative Volatility Index (RVI), monitor trading volume to understand market activity and interest, evaluate buy and sell pressure to gauge market sentiment, and determine liquidity to understand the ease of entering or exiting positions. The indicator is titled "Uptrick: 6 Coins Market Data Table" and is set to overlay on the chart, ensuring that it does not obstruct the view of price action. It uses a custom function to calculate buy and sell pressure based on price movements and trading volume, where buy pressure measures the volume of trades executed at prices above the low but below the high, indicating buying interest, and sell pressure measures the volume of trades executed at prices below the high but above the low, indicating selling interest. Liquidity is calculated as the product of the trading range (high - low) and the trading volume, helping in understanding the ease with which an asset can be traded without affecting its price. The RVI is calculated using the standard deviation of price changes and the exponential moving average (EMA), distinguishing between periods of increasing and decreasing volatility to provide a normalized measure of market volatility, with the RVI value ranging from 0 to 100, where higher values indicate higher volatility. The table is created with six rows and seven columns, with each row representing a cryptocurrency and each column representing a specific metric. The first row of the table includes headers for each metric: Symbol, RVI, Volume, Buy Pressure, Sell Pressure, and Liquidity. The populateTable function retrieves and calculates the necessary data for each cryptocurrency, fetching open, high, low, close prices, and volume, then calculating the RVI, buy/sell pressure, and liquidity. These values are populated into the respective cells in the table, ensuring that traders can see all relevant data at a glance. The indicator allows users to specify six different cryptocurrency symbols through input fields, enabling traders to monitor their preferred coins. The table columns include Symbol (the trading symbol of the cryptocurrency, e.g., BTCUSDT), RVI (the Relative Volatility Index displayed as a percentage, indicating the volatility level), Volume (the trading volume for the specified period, indicating the level of trading activity), Buy Pressure (a volume-based measure of buying interest), Sell Pressure (a volume-based measure of selling interest), and Liquidity (a measure of the asset’s liquidity, combining price range and volume). By bringing together multiple key metrics for six cryptocurrencies into one table, the indicator provides a centralized view of market conditions, enhancing decision-making as traders can quickly assess volatility, market sentiment, and liquidity, aiding in more informed trading decisions. The tool's customizability, allowing users to tailor the table to display their preferred cryptocurrencies, makes it versatile for different trading strategies. This detailed description outlines the functionality and purpose of the "Uptrick: 6 Coins Market Data Table" indicator, emphasizing its role in providing comprehensive and actionable market data for traders.
Visible Range Support and Resistance [AlgoAlpha]🌟 Introducing the Visible Range Support and Resistance 🌟
Discover key support and resistance levels with the innovative "Visible Range Support and Resistance" indicator by AlgoAlpha! 🚀📈 This advanced tool dynamically identifies significant price zones based on the visible range of your chart, providing traders with crucial insights for making informed decisions.
Key Features:
Dynamic support and resistance levels based on visible chart range 📏
User-defined resolution for tailored analysis 🎯
Clear visual representation of significant key zones 🖼️
Easy integration with any trading strategy 💼
How to Use:
🛠 Add the Indicator : Add the indicator to favourites. Adjust settings like resolution and horizontal extension to suit your trading style.
📊 Market Analysis : Identify key support and resistance zones based on the highlighted areas. These zones indicate significant price levels where the market may react.
How it Works:
The indicator segments the price range into user-defined resolutions, analyzing the highest and lowest points to establish boundaries. It calculates the frequency of price action within these segments, highlighting key levels where price movements are least concentrated (areas where price tends to pivot). Customizable settings like resolution and horizontal extension allow for tailored analysis, while the intuitive visual representation makes it easy to spot potential support and resistance zones directly on your chart.
By leveraging this indicator, you can gain deeper insights into market dynamics and improve your trading strategy with data driven support and resistance analysis. Happy trading! 💹✨

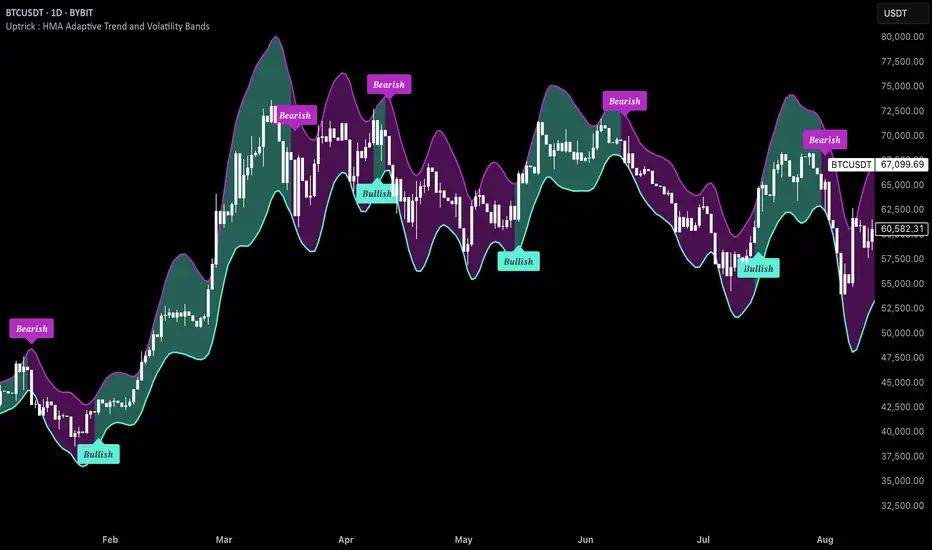
Uptrick : HMA Adaptive Trend and Volatility BandsThis proprietary trading indicator, named "Uptrick: HMA Adaptive Trend and Volatility Bands," offers a sophisticated blend of trend detection and volatility measurement for financial markets. Designed to overlay directly on the price chart, it leverages a variety of technical analysis tools to provide clear visual signals and comprehensive market insights.
Key Features:
Hull Moving Average (HMA) with Volatility Bands:
HMA Calculation: Utilizes the Hull Moving Average (HMA) for smooth trend identification, applied to the average price of high and low (hl2).
Adaptive Volatility Bands: Incorporates bands around the HMA based on a responsive standard deviation adjusted by an Exponential Moving Average (EMA). These bands dynamically expand and contract with market volatility.
Parameters:
Length: Configurable period for the HMA and standard deviation (default 14).
Multiplier: Determines the width of the bands (default 2.0).
MACD (Moving Average Convergence Divergence):
MACD Calculation: Includes fast and slow EMA periods with a signal line to detect trend direction and strength.
Histogram: Difference between MACD line and signal line to visualize momentum.
Parameters:
Fast Length: Short-term EMA period (default 6).
Slow Length: Long-term EMA period (default 13).
Signal Length: Signal line EMA period (default 5).
Relative Strength Index (RSI):
RSI Calculation: Measures the speed and change of price movements to identify overbought or oversold conditions.
Parameter:
RSI Length: Period for RSI calculation (default 10).
Average True Range (ATR):
ATR Calculation: Evaluates market volatility by considering the true range over a specified period.
Parameter:
ATR Length: Period for ATR calculation (default 7).
Volume and Liquidity Analysis:
Volume: Directly incorporated into the indicator to gauge market activity.
Liquidity: Assessed using the HMA of volume to determine the ease of trade execution.
Parameter:
Liquidity Length: Period for HMA of volume calculation (default 14).
Trend Identification:
Uptrend Conditions: A combination of positive MACD histogram, RSI above 50, ATR above its HMA, and volume exceeding liquidity.
Downtrend Conditions: Negative MACD histogram, RSI below 50, ATR above its HMA, and volume exceeding liquidity.
Visual Cues: Color-coded background (green for uptrend, red for downtrend) with corresponding labels on the price chart to indicate trend shifts.
Additional Moving Averages and Bollinger Bands:
SMA (Simple Moving Average): Includes 50 and 200-period SMAs for long-term trend analysis.
EMA (Exponential Moving Average): Includes a 20-period EMA for short-term trend analysis.
Bollinger Bands: Standard deviation bands around a 20-period SMA to measure market volatility and identify potential breakout points.
Information Table:
Real-Time Data Display: An optional table that provides current values for key metrics such as price, volume, liquidity, ATR, RSI, MACD histogram, SMAs, EMA, Buy+Sell Pressure, ATH, Global liquidity, Distance from ATH and Bollinger Bands, offering traders a comprehensive snapshot of market conditions.
Visualization:
Upper and Lower Bands: Clearly plotted with distinct colors (blue for upper, red for lower) to highlight volatility boundaries.
Trend Labels: Automatic annotations on the chart to signal uptrend and downtrend conditions.
Background Highlighting: Subtle shading to visually emphasize prevailing trend conditions.
This indicator is designed for traders seeking an advanced tool to detect trends, measure volatility, and make informed trading decisions based on comprehensive technical analysis. By integrating multiple technical indicators and providing clear visual signals, it aims to enhance trading accuracy and market insight.
Institutional Liquidity and Price Action Concepts [AlgoAlpha]🚀 Introducing the Institutional Liquidity and Price Action Concepts™ (ILPAC) , a comprehensive toolkit developed by AlgoAlpha as part of our Premium Collection. This All-in-One indicator offers a robust approach to understanding price action and liquidity, empowering traders with hyper customizable features to tailor their analysis to their specific trading strategies.
Designed with efficiency and compactness in mind, the script shows Price action and liquidity through four methods: Market Structure , Liquidity Heatmap , Trend Lines , and FOMO Bubbles . Additionally, the script also includes a fully customizable interface, to match each individual's trading style. By utilizing a blend of advanced algorithms and customizable parameters, Institutional Liquidity and Price Action Concepts™ (ILPAC) provides traders with a vast array of trading strategies ranging from high frequency scalping to timing better entries on long-term swing and investing positions.
The ILPAC ™ can be used with or without other AlgoAlpha Premium Collection indicators as this indicator has been designed to be able to act as a standalone toolkit.
Let's delve into the key features and functionalities of this versatile indicator:
🎯 Key Features (summary):
Market Structure Analysis :
Customizable time-horizon
BOS confirmation methods
Adjustable CHoCH/BOS line styles
Swing point highlighting
Color customization
Liquidity Heatmap:
Configurable look-back period
Adjustable resolution
Customizable scale colors
Trend Lines :
Look-back period settings
Noise filter factor
Trend line signals with color options
FOMO Bubbles :
Configurable look-back period
Adjustable noise filter factor
Customizable bubble colors
🎯 Key Features (in-depth):
The Market Structure component within ILPAC ™ shows the underlying trend of the market using swing high and lows and is purely price action based. Higher Highs(HH), Higher Lows(HL) labels generally indicate an uptrend and Lower Highs(LH) and Lower Lows(LL) indicate a downtrend. The trend of the market is also determined by Change of Characters (CHoCH) and Break of Structure patterns (BOS). The Market Structure component marks out all these automatically and colours the bars on your chart for easy visualisation of trend.
The Liquidity Heatmap component within ILPAC ™ visualizes areas of high and low liquidity in the market. It identifies zones where liquidity is concentrated not only at specific price levels but also over time, giving the user a 3 Dimensional view of liquidity. The heatmap colours represent different levels of liquidity, making it easy to see where large volumes of orders may exist. This component helps traders understand the liquidity landscape and make informed decisions based on potential support and resistance levels.
The Trend Lines component within ILPAC ™ automatically draws trend lines based on historical price data. It identifies significant highs and lows, connecting them to form trend lines that highlight the overall market direction as well as give breakout signals as shown in the image below. The component also includes a noise filter to reduce false signals and ensure only valid trend breakouts are displayed. Customizable colour settings allow traders to personalize the visual representation of trend lines on their charts.
The FOMO Bubbles component within ILPAC ™ identifies periods of market activity driven by Fear of Missing Out (FOMO). By analysing price action and volume, it highlights bubbles where traders are likely entering positions impulsively. These bubbles are displayed on the chart with customizable colours, providing a visual cue for potential overbought or oversold conditions. This component helps traders recognize and potentially capitalize on market exuberance or panic.
🎯Usage Examples:
At its core, the components within ILPAC ™ were designed to operate with each other as a form of confluence and robust analysis. Typically, Price action components such as the Market Structure and Trend Lines can be used for entries while the Liquidity components like FOMO Bubbles and the Heatmap can be used to find exit points. Here are some examples of how they can be used.
Trend Trading
Using the Market Structure component, enter a trade during a CHoCH and set TP at key areas of liquidity using the heatmap. Users can also choose to enter into a BOS which is an indication of a trend continuation.
Reversal Trading
Using the Liquidity Heatmap to find areas of liquidity for possible reversals, wait for a rejection from a liquidity zone and use the Trend Line Breakout signals as confluence for an entry. Exits can be set at liquidity zones or using FOMO Bubbles as take profit signals.
(These are just examples for reference, the ILPAC ™ offers significantly more possibilities for customisation and fine tuning of your trading strategy.)
🎯Conclusion:
The Institutional Liquidity and Price Action Concepts™ (ILPAC) indicator by AlgoAlpha is a powerful tool for traders, offering in-depth market insights through its Market Structure, Liquidity Heatmap, Trend Lines, and FOMO Bubbles components. By integrating Price Action based analysis with Liquidity analysis, ILPAC ™ boasts a superior design for the confluence between its components, using Price Action components for entry opportunities and Liquidity based components for exit opportunities. With its highly customizable settings, this indicator caters to all trading styles, from scalping to long-term investing. By providing clear visualizations and automatic trend and liquidity detection, ILPAC ™ empowers traders to make informed decisions, enhancing their trading strategies and improving overall market understanding.
Ücretli komut dosyası

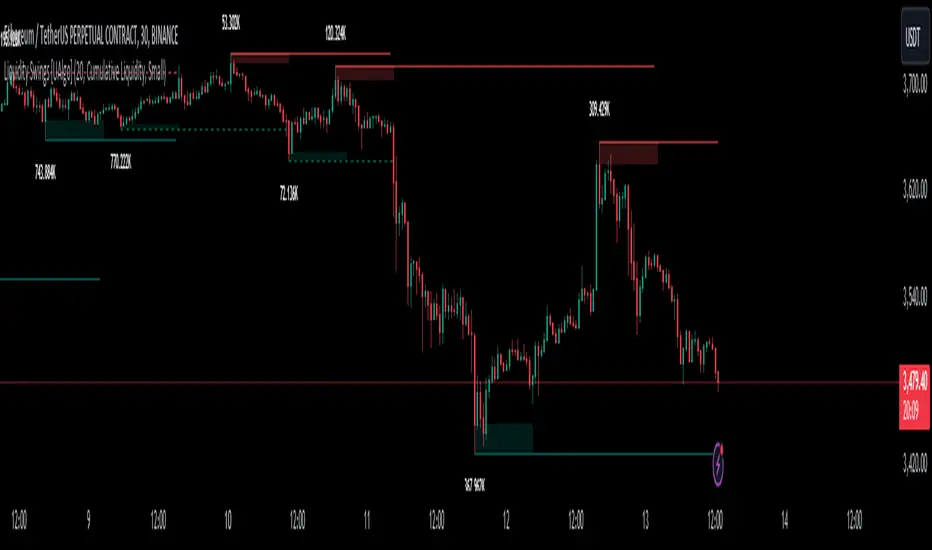
Liquidity Swings [UAlgo]The "Liquidity Swings " indicator is designed to help traders identify liquidity swings within the market. This tool is particularly useful for visualizing areas where liquidity is accumulating and where it is being swept, providing valuable insights for making informed trading decisions. By tracking the pivots in price and associating them with volume, the indicator highlights zones of potential support and resistance, helping traders understand market dynamics more clearly.
🔶 Key Features
Liquidity Swing Sensitivity: Adjustable sensitivity settings to fine-tune the detection of liquidity swings according to market conditions and trader preferences.
Two modes of liquidity calculation:
Cumulative Liquidity: Aggregates unswept liquidity over multiple swings until it is swept, providing a broader view of liquidity accumulation.
Individual Liquidity: Displays the accumulated liquidity for each swing independently, offering a more granular perspective.
Visual Customization: Options to customize the colors and sizes of liquidity lines, areas, and informational text for better visual clarity.
Dynamic Updates: The indicator dynamically updates liquidity zones and labels, adjusting to new market data to keep traders informed in real-time.
🔶 Disclaimer
The "Liquidity Swings " indicator is provided for educational and informational purposes only.
It should not be considered as financial advice or a recommendation to buy or sell any financial instrument.
The use of this indicator involves inherent risks, and users should employ their own judgment and conduct their own research before making any trading decisions. Past performance is not indicative of future results.
🔷 Related Scripts
Liquidity Sweeps
Williams %R Liquidity Sweeps
ICT IPDA Liquidity Matrix By AlgoCadosThe ICT IPDA Liquidity Matrix by AlgoCados is a sophisticated trading tool that integrates the principles of the Interbank Price Delivery Algorithm (IPDA), as taught by The Inner Circle Trader (ICT). This indicator is meticulously designed to support traders in identifying key institutional levels and liquidity zones, enhancing their trading strategies with data-driven insights. Suitable for both day traders and swing traders, the tool is optimized for high-frequency and positional trading, providing a robust framework for analyzing market dynamics across multiple time horizons.
# Key Features
Multi-Time Frame Analysis
High Time Frame (HTF) Levels : The indicator tracks critical trading levels over multiple days, specifically at 20, 40, and 60-day intervals. This functionality is essential for identifying long-term trends and significant support and resistance levels that aid in strategic decision-making for swing traders and positional traders.
Low Time Frame (LTF) Levels : It monitors price movements within 20, 40, and 60-hour intervals on lower time frames. This granularity provides a detailed view of intraday price actions, which is crucial for scalping and short-term trading strategies favored by day traders.
Daily Open Integration : The indicator includes the daily opening price, providing a crucial reference point that reflects the market's initial sentiment. This feature helps traders assess the market's direction and volatility, enabling them to make informed decisions based on the day's early movements, which is particularly useful for day trading strategies.
IPDA Reference Points : By leveraging IPDA's 20, 40, and 60-period lookbacks, the tool identifies Key Highs and Lows, which are used by IPDA as Draw On Liquidity. IPDA is an electronic and algorithmic system engineered for achieving price delivery efficiency, as taught by ICT. These reference points serve as benchmarks for understanding institutional trading behavior, allowing traders to align their strategies with the dominant market forces and recognize institutional key levels.
Dynamic Updates and Overlap Management : The indicator is updated daily at the beginning of a new daily candle with the latest market data, ensuring that traders operate with the most current information. It also features intelligent overlap management that prioritizes the most relevant levels based on the timeframe hierarchy, reducing visual clutter and enhancing chart readability.
Comprehensive Customization Options : Traders can tailor the indicator to their specific needs through an extensive input menu. This includes toggles for visibility, line styles, color selections, and label display preferences. These customization options ensure that the tool can adapt to various trading styles and preferences, enhancing user experience and analytical capabilities.
User-Friendly Interface : The tool is designed with a user-friendly interface that includes clear, concise labels for all significant levels. It supports various font families and sizes, making it easier to interpret and act upon the displayed data, ensuring that traders can focus on making informed trading decisions without being overwhelmed by unnecessary information.
# Usage Note
The indicator is segmented into two key functionalities:
LTF Displays : The Low Time Frame (LTF) settings are exclusive to timeframes up to 1 hour, providing detailed analysis for intraday traders. This is crucial for traders who need precise and timely data to make quick decisions within the trading day.
HTF Displays : The High Time Frame (HTF) settings apply to the daily timeframe and any shorter intervals, allowing for comprehensive analysis over extended periods. This is beneficial for swing traders looking to identify broader trends and market directions.
# Inputs and Configurations
BINANCE:BTCUSDT
Offset: Adjustable setting to shift displayed data horizontally for better visibility, allowing traders to view past levels and make informed decisions based on historical data.
Label Styles: Choose between compact or verbose label formats for different levels, offering flexibility in how much detail is displayed on the chart.
Daily Open Line: Customizable line style and color for the daily opening price, providing a clear visual reference for the start of the trading day.
HTF Levels: Configurable high and low lines for HTF with options for style and color customization, allowing traders to highlight significant levels in a way that suits their trading style.
LTF Levels: Similar customization options for LTF levels, ensuring flexibility in how data is presented, making it easier for traders to focus on the most relevant intraday levels.
Text Utils: Settings for font family, size, and text color, allowing for personalized display preferences and ensuring that the chart is both informative and aesthetically pleasing.
# Advanced Features
Overlap Management : The script intelligently handles overlapping levels, particularly where multiple timeframes intersect, by prioritizing the more significant levels and removing redundant ones. This ensures that the charts remain clear and focused on the most critical data points, allowing traders to concentrate on the most relevant market information.
Real-Time Updates : The indicator updates its calculations at the start of each new daily bar, incorporating the latest market data to provide timely and accurate trading signals. This real-time updating is crucial for traders who rely on up-to-date information to execute their strategies effectively and make informed trading decisions.
# Example Use Cases
Scalpers/Day traders: Can utilize the LTF features to make rapid decisions based on hourly market movements, identifying short-term trading opportunities with precision.
Swing Traders: Will benefit from the HTF analysis to identify broader trends and key levels that influence longer-term market movements, enabling them to capture significant market swings.
By providing a clear, detailed view of key market dynamics, the ICT IPDA Liquidity Matrix by AlgoCados empowers traders to make more informed and effective trading decisions, aligning with institutional trading methodologies and enhancing their market understanding.
# Usage Disclaimer
This tool is designed to assist in trading decisions, but it should be used in conjunction with other analysis methods and risk management strategies. Trading involves significant risk, and it is essential to understand the market conditions thoroughly before making trading decisions.

Stop Hunts [MK]Liquidity rests above/below previous highs and lows because these are the areas where traders are most likely to leave their orders/stop losses. The market can tap into this liquidity source by going beyond the previous highs and lows, this liquidity can then be used to reverse the market in the opposite direction.
As traders we may want to know if price will continue beyond previous highs and lows, or reverse the market. If price looks to be reversing after tapping into liquidity, this can be a good area to enter a trade. The same area can be used as a take profit level also.
The indicator identifies previous high/lows in two ways:
1. previous high/lows using 'PIVOT POINTS'. Pivots are easy to spot and are obvious within a price trend. Also called 'higher highs", "lower lows" etc. The number of candles required to form the pivot point can be adjusted in the script settings.
see below example of pivot point and stop hunt:
www.tradingview.com
see how price reversed upwards after stop hunt on pivot point above.
2. previous candle high/lows. A previous candles high and low are also good areas of liquidity.
see below example of previous candle stop hunt:
see how price reversed upwards after stop hunt on previous candle low above.
Personally, I use the pivot point stop hunts on lower timeframes and previous candle stop hunts on higher timeframes. However users can adjust on which timeframes to show the indicator depending on their own trading style.
As ever all items within 'settings' are customizable.
The indicator is by no means a 'trading strategy' and users should be fully aware of the stop hunt concept and have conducted extensive back-testing before using with 'live' accounts.
The indicator may also serve as a 'teaching aid' to new students and as a reminder to more experienced traders.

Master Pattern [UAlgo]🔶 Description:
"Master Pattern by UAlgo" aims to identify and visualize "Master Patterns" in price movements on financial charts, and focusing on detecting liquidity levels and sweeps. The indicator provides users with the ability to customize settings such as master pattern detection and detection flexibility, sensitivity to liquidity levels, and visualization preferences.
🔶 What is the Master Pattern ?
The Master Pattern is a framework built around understanding market cycles, which include three main phases: Contraction, Expansion, and Trend.
Contraction Phase: During this phase, the market fluctuates less and consolidates within a narrow range. Institutional trading volumes tend to be low and it is recommended to avoid trading entries during this period.
Expansion Phase: volatility increases and prices fluctuate greatly. Institutional traders begin to establish positions at this stage and may manipulate prices to attract retail traders to create liquidity for their own buy or sell targets.
Trend Phase: The final phase that completes the market cycle. Institutional traders started taking profits, causing the trend to reverse. This triggered panic among retail traders, leading to liquidations and stop-losses. This creates liquidity from which institutional traders can profit, while retail traders' positions are overvalued.
🔶 Key Features:
Pattern Detection : The indicator detects and visualizes contraction patterns in price movements, helping traders identify potential areas of price consolidation.
Also traders can choose between different modes (Strict, Normal, Relax) for obtaining master patterns, providing flexibility in pattern identification based on individual trading strategies and preferences.
The Value/Expansion Line : This value line is considered by institutional traders as a potential “Point of Origin” for future price movements.
An Application Example of the Master Pattern :
Select the Appropriate Timeframes: A significant separation between the higher timeframe (HTF) and the lower timeframe (LTF) is essential. For instance, combinations like 4H and 15M, 4H and 5M, or 1H and 1M. You can change this according to your own strategy.
Trade Based on Contraction Box, Value Line and Liquidity: When the HTF is above value, look for buying opportunities on your LTF below value. Conversely, when the HTF is below value, seek selling opportunities on your LTF above value. Sweeping liquidity in LTF is also an important parameter.
Also Value/Expansion Line can also be used as Support/Resistance zone,
Liquidity Levels : The indicator includes functionality to detect and display liquidity levels on the chart.
Dashboard Display : A customizable dashboard provides users with key information, including liquidity levels, master pattern values, and whether the current price is above or below Master Pattern's value lines.
Additionally, when liquidity is swept or the price rises above or falls below the value line. this information can be displayed on the dashboard.
Customizable Settings: Users can adjust parameters such as the pattern detection mode, sensitivity to liquidity levels, liquidity type (cumulative or individual for each swing), visualization preferences for master patterns, the position and font size of the dashboard.
🔶 Disclaimer:
Use with Caution: This indicator is provided for educational and informational purposes only and should not be considered as financial advice. Users should exercise caution and perform their own analysis before making trading decisions based on the indicator's signals.
Not Financial Advice: The information provided by this indicator does not constitute financial advice, and the creator (UAlgo) shall not be held responsible for any trading losses incurred as a result of using this indicator.
Backtesting Recommended: Traders are encouraged to backtest the indicator thoroughly on historical data before using it in live trading to assess its performance and suitability for their trading strategies.
Risk Management: Trading involves inherent risks, and users should implement proper risk management strategies, including but not limited to stop-loss orders and position sizing, to mitigate potential losses.
No Guarantees: The accuracy and reliability of the indicator's signals cannot be guaranteed, as they are based on historical price data and past performance may not be indicative of future results.

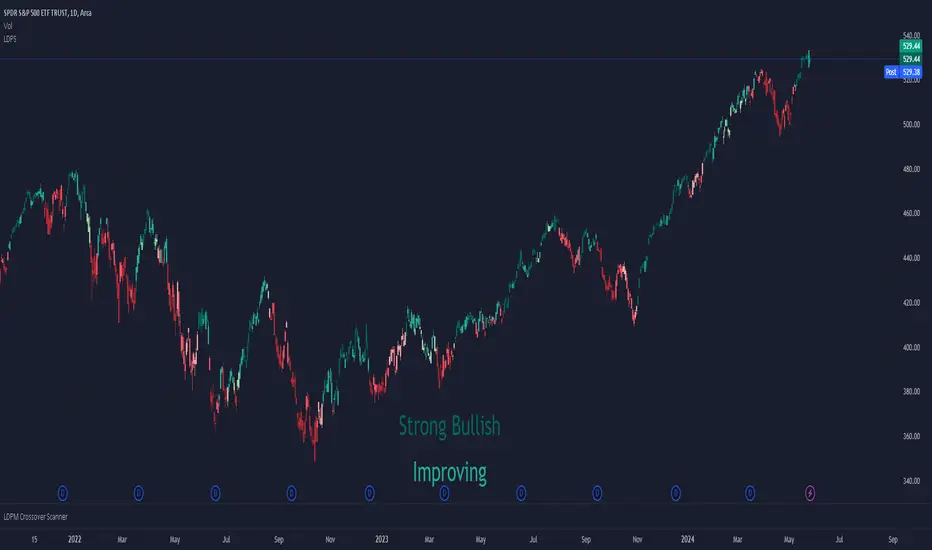
Liquidity Dependent Price Stability AlgorithmThe Liquidity Dependent Price Stability (LDPS) indicator is designed to measure liquidity levels on an equity and, from those measurements, provide Bullish or Bearish outlooks for future price action. These outlooks are given via reporting the equity's Liquidity Condition and Liquidity Flow.
Interpretation
Liquidity Condition (LC) and Liquidity Flow (LF) measurements are displayed with color-specific chart colors and/or with text output.
LC can be reported as "Weak Bullish", "Bullish", or "Strong Bullish" for Bullish outlooks and "Weak Bearish", "Bearish" or "Strong Bearish" for Bearish outlooks. LC can also just be reported as "Bullish" or "Bearish".
Bullish LCs have a statistical correlation with future price appreciation, and Bearish LCs have a statistical correlation with price depreciation. When LC is “Bullish”, the price is likely to go up, and if LC is “Bearish”, the price is likely to go down.
Liquidity Flow (LF) is a measure of how LC is changing. When LC is becoming more bullish, LF is reported as “Improving”. When LC is becoming more bearish, LF is reported as “Worsening”. LF is only displayed via text output.
Settings and Configurations
LDPS Sensitivity and Reactivity: Determines if you want LDPS to be more sensitive to changing conditions or less sensitive. This choice affects how certain LDPS is when forming its future outlooks. LDPS achieves this increase in sensitivity and reactivity by lowering the bar for what LDPS considers a significant change.
Aggressive : LDPS will optimize reporting early changes in LC and LF at the expensive of accuracy. Aggressive is good for low-risk trading styles that prefer to exit a position early rather than deal with increased risk of oppositional movement.
Balanced : LDPS will try to balance reporting changes in LC and LF with maintaining accuracy. Balanced style is a good setting to start out with and is applicable across the widest range of equity’s and timeframes.
Conservative : LDPS will optimize accuracy over being sensitive to changes in LC or LF. Conservative is a good choice for lower timeframes and traders who only want to change or exit positions with the greatest confidence.
LDPS Reporting Style: Determines how you want LC to be reported.
Simplified : LDPS will only report LC as “Bullish” or “Bearish”.
Full : LDPS will increase its reporting details and include the “Strong” and “Weak” pre-fixes, when appropriate.
LDPS Candle Coloring: There are three different ways that LC can be reported on the chart via coloring.
LDPS Candle Replacement: This will replace the chart’s default candles with those created by LDPS. Note: In order to see LDPS’ candles and not the chart’s, you have to disable to chart’s candles. This can be done in Settings -> Symbol and unchecking “Body”, “Borders” and “Wick” boxes.
LDPS Candle Coloring: This will just color the bodies of the chart’s default candles. Note: This setting should not have the chart’s candle’s disabled.
LDPS Background Coloring: This will color the chart’s background rather than any candles.
LDPS Text Output: LC and LF are reported via a text box that can be moved several places on the chart, or the text box can be removed.
LDPS Measurements – Display: When selected, LC and LF will be reported via the text box.
LDPS Measurement – Text Location: Determines where the text box with LC and LF are located.
LDPS Measurement – Text Size: Determines the size of LC and LF within the text box.
LDPS Measurement – Background Color: Determines the background color of the text box with LC and LF.
LDPS Condition Color Selection – Bullish / Bearish: Color selection for each type of LC. Note: If the Simplified reporting style is selected, the “Full Bullish” and “Full Bearish” are the bullish and bearish color choices, respectively.
Frequently Asked Questions:
Where can I get additional Information?
Please check the “Author’s Instructions” section below.
Where can I find the results of the LDPS research?
Please check the “Author’s Instructions” section below.
Help! Something’s not working!
Apologies. Please see the email listed in “Author’s Instructions” below and let’s get started on solving the issue.
Which Sensitivity setting should I use?
The author’s preference is Conservative in most cases, but the answer for you depends on your preferred style.
An analogy might help: the aggressive setting will ensure LDPS is early to the party – every party. Of the parties that really kick off, you can be certain LDPS is there, but they had to visit a several of parties before finding the right one.
The Conservative setting won’t bring LDPS to every party – it will gladly stay at the one it’s at but when it detects the next real big hit, LDPS will move to that party instead. It won’t be the first one there, but it is definitely earlier than most.
Should I use the Full or Simplified reporting style?
Depending on how engaged you are with the particular equity or position, either choice can be beneficial. The Full reporting style will let you detect changes in LC before they might show with the Simplified reporting style. Some enjoy the additional data, some (like the Author) enjoy keeping things simple.
I can see LDPS’ colors in the chart’s candlesticks when the settings are open, but not when the settings are closed. How come?
If you are using the “LDPS Candle Replacement” setting, be sure to turn off the Chart’s default candles by right-clicking on the chart, going to Settings, then Symbol and then un-checking “Body”, “Border” and “Wick”. This should fix the issue.
I think there’s a bug – where do I report it?
Thank you for reaching out about a potential bug or issue! Please see the email below in “Author’s Instructions” to report the issue.
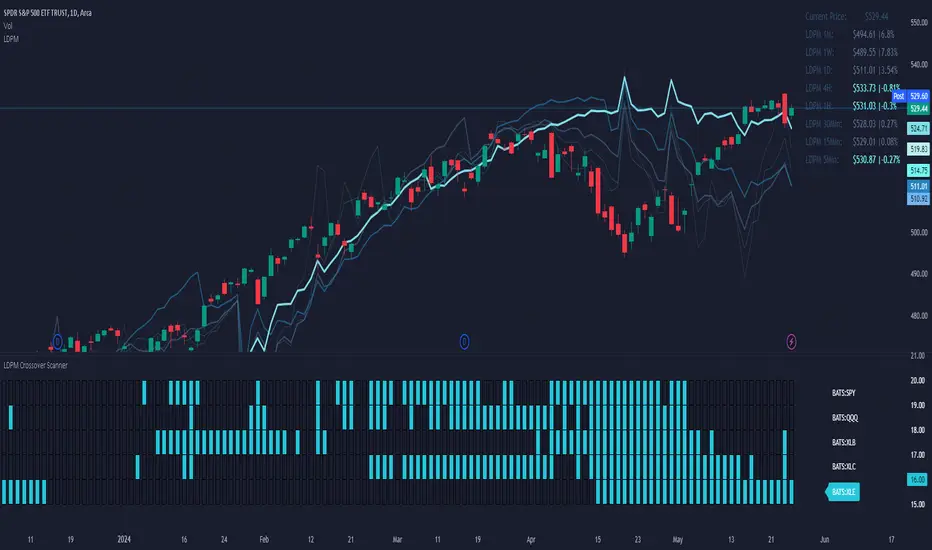
LDPM Crossover Scanner AddonThe LDPM Crossover Scanner is designed to be used in conjunction with the Liquidity Dependent Price Movement Algorithm and is included with LDPM access.
The LDPM Crossover Scanner displays the LDPM status for up to 10 equity's. When conditions are bearish, per LDPM, the equity will light up on the scanner; otherwise, the equity will not light up.
When used in aggregate, this becomes a particularly useful way to measure up-coming market moves (especially when the crossover scanner showcases equities with significant beta to the chart's underlying!).
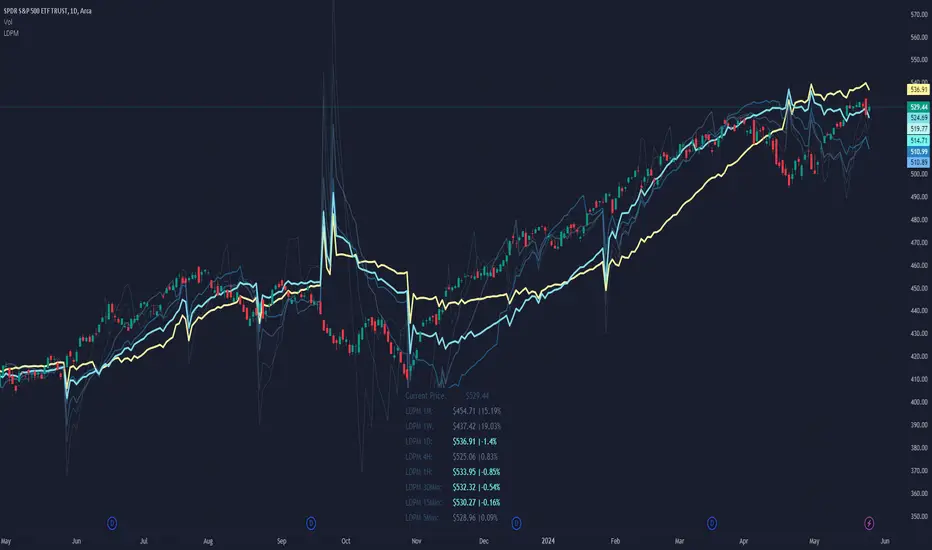
Liquidity Dependent Price Movement AlgorithmLiquidity-Dependent Price Movement (LDPM) is a metric designed to directly measure liquidity on a equity in real time, and to translate those measurements into signals to provide insights into where the anticipate price-direction is headed.
Liquidity can be characterized as a way of measuring how smoothly things are running in the market. When things are running smoothly – such as when there is good agreement as to the price of an asset, then things are considered liquid. Conversely, when things are not running smoothly, just as when the bid or the ask do not agree with each other, then things are considered not liquid. These different states have different outcome liklihoods.
In a liquid environment, a stock can trade a lot of shares without moving the price. On the other hand, when a stock is not liquid, even small volumes can move the price substantially.
It is therefore helpful to know when a stock is liquid to the upside or to the downside, or even, when a stock is not liquid to the upside or the downside. These data have statistical associations with future price movement and volatility.
The use of LDPM is straightforward:
If the price is above LDPM: bullish outlooks.
If the price is below LDPM: bearish outlooks.
There are a few key differences about LDPM as compared to other indicators, namely that timeframe matters . That means, LDPM will tailor its output to the timeframe selected. The advantage of this is that it allows LDPM to be "tailored" to the specific timeframe as desired, without having to do any conversions or adaptations mentally.
Key Settings and Configurations:
Setting - Smoothing Type of LDPM :
Default: KF.
LDPM can be smoothened if desired. There are 5 different types of smoothing available:
EMA : Exponential Smoothing
SMA : Simple Smoothing
WMA : Weighted Smoothing
RMA : Modified Smoothing
KF : Kellman Smoothing
The default is "KF" for Kellman Smoothing.
Setting - Include LDPM-Granular :
Default: Off.
LDPM-Granular is the more "raw" form of LDPM that displays the candle-specific result, rather than the smoothened result. This can be toggled on or off, if desired. LDPM granular is helpful for looking at candle-specific
Setting - Place LDPM Standard :
Default: Off.
An additional, single, LDPM line can be placed via this toggle. Settings for this LDPM can be configured directly below toggle.
Setting - Place LDPM-Fib :
Default: On.
LDPM-Fib is a default setting for displaying 5 LDPMs (LDPM-13, LDPM-21, LDPM-34, LDPM-55, and LDPM-89) whose lookbacks are spaced via the Fib sequence. Useful for those who enjoy a static relationship between the different "layers" of LDPM.
Setting - Place LDPM-Reference :
Default: Off.
Since LDPM is time-interval dependent, there may be times when a higher-order timeframe is desired to act as a reference. For instance, suppose you want to go long if the 1-Hour LDPM experiences a bullish crossover, but you want to scalp shorts on the 15-minute timeframe until then. Then you could place the chart on the 15-minute interval for your scalping, and then place a 1-Hour reference LDPM that will show you when the 1-Hour LDPM and price experience a crossover.
Note: The reference must be a higher-order timeframe. So if your chart is on the 15-minute, you can only reference timeframes greater than 15.
Setting - LDPM Box Creation :
Default: On.
Instead of implementing a reference LDPM, it is possible to display the other timeframes in a data table with conditional coloring for if the overall LDPM-Price relationship is bullish or bearish.
Why Chose LDPM
There are no other Liquidity-measuring indicators available to the retail investor. Measuring liquidity often requires the use of expensive data and high-throughput computing to be used in real-time. Neither of these requirements apply to utilizing LDPM.
Additionally, the data are supportive that LDPM provides statistically significant, price-direction-correct outlooks.
ICT Immediate Rebalance Toolkit [LuxAlgo]The ICT Immediate Rebalance Toolkit is a comprehensive suite of tools crafted to aid traders in pinpointing crucial trading zones and patterns within the market.
The ICT Immediate Rebalance, although frequently overlooked, emerges as one of ICT's most influential concepts, particularly when considered within a specific context. The toolkit integrates commonly used price action tools to be utilized in conjunction with the Immediate Rebalance patterns, enriching the capacity to discern context for improved trading decisions.
The ICT Immediate Rebalance Toolkit encompasses the following Price Action components:
ICT Immediate Rebalance
Buyside/Sellside Liquidity
Order Blocks & Breaker Blocks
Liquidity Voids
ICT Macros
🔶 USAGE
🔹 ICT Immediate Rebalance
What is an Immediate Rebalance?
Immediate rebalances, a concept taught by ICT, hold significant importance in decision-making. To comprehend the concept of immediate rebalance, it's essential to grasp the notion of the fair value gap. A fair value gap arises from market inefficiencies or imbalances, whereas an immediate rebalance leaves no gap, no inefficiencies, or no imbalances that the price would need to return to.
Rule of Thumb
After an immediate rebalance, the expectation is for two extension candles to follow; otherwise, the immediate rebalance is considered failed. It's important to highlight that both failed and successful immediate rebalances, when considered within a context, are significant signatures in trading.
Immediate rebalances can occur anywhere and in any timeframe.
🔹 Buyside/Sellside Liquidity
In the context of Inner Circle Trader's teachings, liquidity primarily refers to the presence of stop losses or pending orders, that indicate concentrations of buy or sell orders at specific price levels. Institutional traders, like banks and large financial entities, frequently aim for these liquidity levels or pools to accumulate or distribute their positions.
Buyside liquidity denotes a chart level where short sellers typically position their stops, while Sellside liquidity indicates a level where long-biased traders usually place their stops. These zones often serve as support or resistance levels, presenting potential trading opportunities.
The presentation applied here is the multi-timeframe version of our previously published Buyside-Sellside-Liquidity script.
🔹 Order Blocks & Breaker Blocks
Order Blocks and Breaker Blocks hold significant importance in technical analysis and play a crucial role in shaping market behavior.
Order blocks are fundamental elements of price action analysis used by traders to identify key levels in the market where significant buying or selling activity has occurred. These blocks represent areas on a price chart where institutional traders, banks, or large market participants have placed substantial buy or sell orders, leading to a temporary imbalance in supply and demand.
Breaker blocks, also known as liquidity clusters or pools, complement order blocks by identifying zones where liquidity is concentrated on the price chart. These areas, formed from mitigated order blocks, often act as significant barriers to price movement, potentially leading to price stalls or reversals in the future.
🔹 Liquidity Voids
Liquidity voids are sudden price changes when the price jumps from one level to another. Liquidity voids will appear as a single or a group of candles that are all positioned in the same direction. These candles typically have large real bodies and very short wicks, suggesting very little disagreement between buyers and sellers.
Here is our previously released Liquidity-Voids script.
🔹 ICT Macros
In the context of ICT's teachings, a macro is a small program or set of instructions that unfolds within an algorithm, which influences price movements in the market. These macros operate at specific times and can be related to price runs from one level to another or certain market behaviors during specific time intervals. They help traders anticipate market movements and potential setups during specific time intervals.
Here is our previously released ICT-Macros script.
🔶 SETTINGS
🔹 Immediate Rebalances
Immediate Rebalances: toggles the visibility of the detected immediate rebalance patterns.
Bullish, and Bearish Immediate Rebalances: color customization options.
Wicks 75%, %50, and %25: color customization options of the wick price levels for the detected immediate rebalance.
Ignore Price Gaps: ignores price gaps during calculation.
Confirmation (Bars): specifies the number of bars required to confirm the validation of the detected immediate rebalance.
Immediate Rebalance Icon: allows customization of the size of the icon used to represent the immediate rebalance.
🔹 Buyside/Sellside Liquidity
Buyside/Sellside Liquidity: toggles the visibility of the buy-side/sell-side liquidity levels.
Timeframe: this option is to identify liquidity levels from higher timeframes. If a timeframe lower than the chart's timeframe is selected, calculations will be based on the chart's timeframe.
Detection Length: lookback period used for the detection.
Margin: sets margin/sensitivity for the liquidity levels.
Buyside/Sellside Liquidity Color: color customization option for buy-side/sell-side liquidity levels.
Visible Liquidity Levels: allows customization of the visible buy-side/sell-side liquidity levels.
🔹 Order Blocks & Breaker Blocks
Order Blocks: toggles the visibility of the order blocks.
Breaker Blocks: toggles the visibility of the breaker blocks.
Swing Detection Length: lookback period used for the detection of the swing points used to create order blocks & breaker blocks.
Mitigation Price: allows users to select between the closing price or the wick of the candle.
Use Candle Body in Detection: allows users to use candle bodies as order block areas instead of the full candle range.
Remove Mitigated Order Blocks & Breaker Blocks: toggles the visibility of the mitigated order blocks & breaker blocks.
Order Blocks: Bullish, Bearish Color: color customization option for order blocks.
Breaker Blocks: Bullish, Bearish Color: color customization option for breaker blocks.
Visible Order & Breaker Blocks: allows customization of the visible order & breaker blocks.
Show Order Blocks & Breaker Blocks Labels: toggles the visibility of the order blocks & breaker blocks labels.
🔹 Liquidity Voids
Liquidity Voids: toggles the visibility of the liquidity voids.
Liquidity Voids Width Filter: filtering threshold while detecting liquidity voids.
Ignore Price Gaps: ignores price gaps during calculation.
Remove Mitigated Liquidity Voids: remove mitigated liquidity voids.
Bullish, Bearish, and Mitigated Liquidity Voids: color customization option..
Liquidity Void Labels: toggles the visibility of the liquidity voids labels.
🔹 ICT Macros
London and New York (AM, Launch, and PM): toggles the visibility of specific macros, allowing users to customize macro colors.
Macro Top/Bottom Lines, Extend: toggles the visibility of the macro's pivot high/low lines and allows users to extend the pivot lines.
Macro Mean Line: toggles the visibility of the macro's mean (average) line.
Macro Labels: toggles the visibility of the macro labels, allowing customization of the label size.
🔶 RELATED SCRIPTS
ICT-Killzones-Toolkit
Smart-Money-Concepts
Thanks to our community for recommending this script. For more conceptual scripts and related content, we welcome you to explore by visiting >>> LuxAlgo-Scripts .

M2 Global Liquidity Index
The M2 Global Liquidity Index calculates a composite index reflecting the aggregate liquidity provided by the M2 money supply of five major currencies: Chinese Yuan (CNY), US Dollar (USD), Euro (EUR), Japanese Yen (JPY), and British Pound (GBP). The M2 money supply includes cash, checking deposits, and easily convertible near money. By incorporating exchange rates (CNY/USD, EUR/USD, JPY/USD, GBP/USD), the script adjusts each country's M2 supply to a common base (USD) and sums them up to produce a global liquidity metric. This metric, plotted on a daily timeframe, provides an overview of the total liquidity available in these five significant economies.
Understanding the M2 money supply is crucial for assessing liquidity because it represents the amount of money readily available in an economy for spending and investment. Higher M2 levels generally indicate more liquidity, suggesting easier access to capital for businesses and consumers, potentially leading to economic growth. Conversely, lower M2 levels can signify tighter liquidity conditions, possibly resulting in constrained spending and investment.

Liquidity Grab Zones | Flux Charts💎 GENERAL OVERVIEW
Introducing our new Liquidity Grab Zones Indicator! This indicator finds liquidity grabs in the current ticker and renders buyside & sellside liquidity grab zones. The retests and breakout of the zones are labeled, and you can set up alerts to get notified. For more information, please check the "HOW DOES IT WORK" section.
Features of the new Liquidity Grab Zones Indicator :
Renders Buyside & Sellside Liquidity Grab Zones
Retests & Breaks
Inverse Zones After Broken Feature
Alerts For All Features
Customizable Algorithm
Customizable Styles
🚩UNIQUENESS
Liquidity grabs can be useful when determining candles that have executed a lot of market orders, so you can plann your trades accordingly. This indicator lets you customize the pivot length and the wick-body ratio for liquidity grabs, provide retest & breakout labels, with customized styling and alerts.
📌 HOW DOES IT WORK ?
Liquidity grabs occur when one of the latest pivots has a false breakout. Then, if the wick to body ratio of the bar is higher than 0.5 (can be changed from the settings) a zone is plotted.
These zones usually indicate areas of high market interest where price action may reverse or accelerate. Identifying these zones can provide traders with critical levels for entering or exiting trades. A breakout of these zones generally mean strong movements are inbound, while failing breakouts make these zones act like support / resistance zones.
The indicator also reverses the type of the zone after an invalidation (can be turned off from the settings). This feature helps traders identify potential reversals more accurately.
The zone width is set to the area from the wick to the body of the candlestick, which can be seen here :
⚙️SETTINGS
1. General Configuration
Pivot Length -> This setting determines the range of the pivots. This means a candle has to have the highest / lowest wick of the previous X bars and the next X bars to become a high / low pivot.
Wick-Body Ratio -> After a pivot has a false breakout, the wick-body ratio of the latest candle is tested. The resulting ratio must be higher than this setting for it to be considered as a liquidity grab.
Zone Invalidation -> Select between Wick & Close price for Liquidity Grab Zone Invalidation.
Use these customizable settings to fine-tune the indicator according to your trading strategy and preferences.

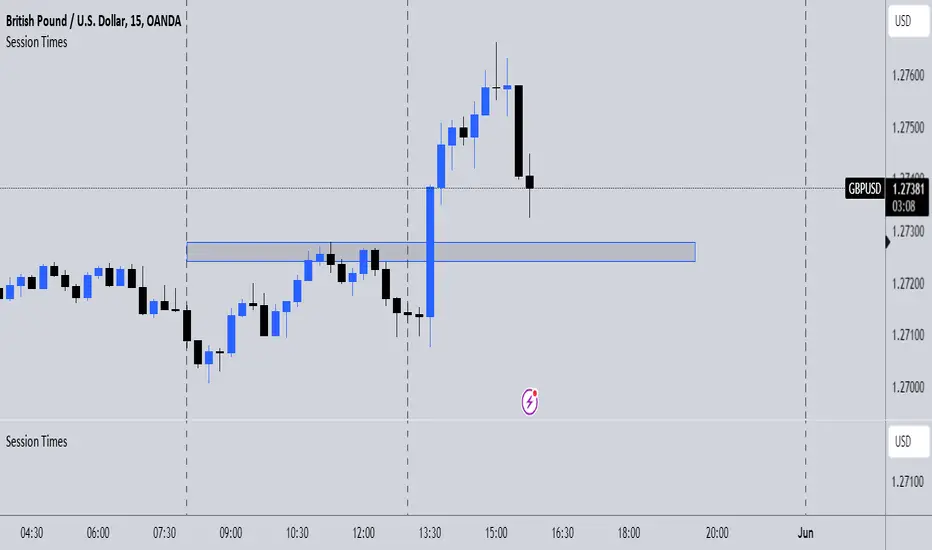
Session TimesDescription:
This indicator simply when enabled will draw dashed lines at each of the session openings. This is based on UTC+1 Time. There will be lines at 00:00 & 08:00 (Asian Session), lines at 08:00 & 13:00 (London Session) and finally lines at 13:00 & 00:00 (New York Session).
Potential Use:
There are many ways you could use this indicator to benefit your trading, but the best way I find is that it makes it clear where the previous highs and lows are of a session, which are potential areas you could trade off. Obviously, there are many other ways you can use this to help you.
How The Script Works:
The way the script works isn't too complicated as it is only a short script. Simply it firstly calculates what are the weekdays (Whenever it isn't Saturday or Sunday). Then from there simply finds the times which I mentioned above, and adds a vertical dashed line there.
Future Updates:
In the future I will mainly be looking to make the indicator more customisable. Firstly, I will look to make it so that the user can adjust the times that the lines are drawn at so it still works wherever you are in the world. I would also like to make it so the user can choose the colour of the lines. If you have any other additions you would like added to this, then feel free to message me.
OrderFlow [Probabilities] | FractalystWhat's the indicator's purpose and functionality?
The indicator is designed to incorporate probabilities with buyside and sellside liquidity, as well as premium and discount ranges within the market. It also provides traders with a multi-timeframe functionality for observing liquidity levels and probabilities across two timeframes without the need to manually switch between them.
These levels are often used in smart money trading concepts for identifying key areas of interest, such as potential reversal points, areas of accumulation or distribution, and zones of high liquidity.
----
What's the purpose of these levels? What are the underlying calculations?
1. Understanding Swing highs and Swing Lows
Swing High: A Swing High is formed when there is a high with 2 lower highs to the left and right.
Swing Low: A Swing Low is formed when there is a low with 2 higher lows to the left and right.
2. Understanding the purpose and the underlying calculations behind Buyside , Sellside and Equilibrium levels.
3. Identifying Discount and Premium Zones.
4. Importance of Risk-Reward in Premium and Discount Ranges
----
How does the script calculate probabilities?
The script calculates the probability of each liquidity level individually. Here's the breakdown:
1. Upon the formation of a new range, the script waits for the price to reach and tap into equilibrium or the 50% level. Status: "⏸" - Inactive
2. Once equilibrium is tapped into, the equilibrium status becomes activated and it waits for either liquidity side to be hit. Status: "▶" - Active
3. If the buyside liquidity is hit, the script adds to the count of successful buyside liquidity occurrences. Similarly, if the sellside is tapped, it records successful sellside liquidity occurrences.
5. Finally, the number of successful occurrences for each side is divided by the overall count individually to calculate the range probabilities.
Note: The calculations are performed independently for each directional range. A range is considered bearish if the previous breakout was through a sellside liquidity. Conversely, a range is considered bullish if the most recent breakout was through a buyside liquidity.
----
What does the multi-timeframe functionality offer?
Enabling and selecting a higher timeframe in the indicator's user-input settings allows you to access not only the current range information but also the liquidity sides, status, price levels, and probabilities of a higher timeframe without needing to switch between timeframes and mark up the levels manually.
----
What are the multi-timeframe underlying calculations?
The script uses the same calculations (mentioned above) and requests the data such as price levels, bar time, probabilities and booleans from the user-input timeframe.
Non-repainting Security Function with Lookahead ON
//Function to fetch data for a given timeframe
getHTFData(timeframe_,exp_) =>
request.security(syminfo.tickerid, timeframe_,exp_ ,lookahead = barmerge.lookahead_on)
----
How to use the indicator?
1. Add the indicator to your TradingView chart.
2. Choose the pair you want to analyze/trade.
3. Enable the HTF in user-input settings and choose a timeframe as for your higher timeframe bias.
4. (Important) : Ensure that the probabilities on both timeframes are aligned in one direction. If not, switch between timeframes until you find a pair of timeframes that are in line with each other and have higher probabilities on one liquidity side.
For Swing traders:
Use Hourly timeframes (1H/2H/4H/8H/12H) as your current timeframe and 1D/3D/1W/2W for your higher timeframe (HTF).
Entry: Hourly Equilibrium level. (Limit order)
Stoploss: Place it on the side where the probability is lower than 50%.
Break-even level/TP1: Hourly breakout of the liquidity.
TP2: Target the Higher Timeframe (HTF) liquidity level where the probability is higher than 50%.
2H/1D COINBASE:BTCUSD
For Day traders:
Use minutely timeframes (5m/15m/30m) as your current timeframe and 1H/2H/4H/8H/12H for your higher timeframe (HTF).
Entry: Minutely Equilibrium level. (Limit order)
Stoploss: Place it on the side where the probability is lower than 50%.
Break-even level/TP1: Minutely breakout of the liquidity.
TP2: Target the Higher Timeframe (HTF) liquidity level where the probability is higher than 50%.
1H/5m COINBASE:BTCUSD
----
User-input settings and customizations
----
What makes this indicator original?
1. Real-time calculation of probabilities directly on your charts.
2. Multi-timeframe functionality, enabling effortless observation of liquidity levels and probabilities across two timeframes.
3. Status label for clear identification of whether price has reached equilibrium.
4. All levels are updated only upon candle closure above or below liquidity levels, ensuring it remains a non-repainting indicator.
----
Terms and Conditions | Disclaimer
Our charting tools are provided for informational and educational purposes only and should not be construed as financial, investment, or trading advice. They are not intended to forecast market movements or offer specific recommendations. Users should understand that past performance does not guarantee future results and should not base financial decisions solely on historical data.
By continuing to use our charting tools, the user acknowledges and accepts the Terms and Conditions outlined in this legal disclaimer.

US Net LiquidityAnalysis of US Net Liquidity: A Comprehensive Overview
Introduction:
The "US Net Liquidity" indicator offers a detailed analysis of liquidity conditions within the United States, drawing insights from critical financial metrics related to the Federal Reserve (FED) and other government accounts. This tool enables economists to assess liquidity dynamics, identify trends, and inform economic decision-making.
Key Metrics and Interpretation:
1. Smoothing Period: This parameter adjusts the level of detail in the analysis by applying a moving average to the liquidity data. A longer smoothing period results in a smoother trend line, useful for identifying broader liquidity patterns over time.
2. Data Source (Timeframe): Specifies the timeframe of the data used for analysis, typically daily (D). Different timeframes can provide varying perspectives on liquidity trends.
3. Data Categories:
- FED Balance Sheet: Represents the assets and liabilities of the Federal Reserve, offering insights into monetary policy and market interventions.
- US Treasury General Account (TGA): Tracks the balance of the US Treasury's general account, reflecting government cash management and financial stability.
- Overnight Reverse Repurchase Agreements (RRP): Highlights short-term borrowing and lending operations between financial institutions and the Federal Reserve, influencing liquidity conditions.
- Earnings Remittances to the Treasury: Indicates revenues transferred to the US Treasury from various sources, impacting government cash flow and liquidity.
4. Moving Average Length: Determines the duration of the moving average applied to the data. A longer moving average length smoothens out short-term fluctuations, emphasizing longer-term liquidity trends.
Variation Lookback Length: Specifies the historical period used to assess changes and variations in liquidity. A longer lookback length captures more extended trends and fluctuations.
Interpretation:
1. Data Retrieval: Real-time data from specified financial instruments (assets) is retrieved to calculate balances for each category (FED, TGA, RRP, Earnings Remittances).
2. Global Balance Calculation: The global liquidity balance is computed by aggregating the balances of individual categories (FED Balance - TGA Balance - RRP Balance - Earnings Remittances Balance). This metric provides a comprehensive view of net liquidity.
3. Smoothed Global Balance (SMA): The Simple Moving Average (SMA) is applied to the global liquidity balance to enhance clarity and identify underlying trends. A rising SMA suggests improving liquidity conditions, while a declining SMA may indicate tightening liquidity.
Insight Generation and Decision-Making:
1. Trend Analysis: By analyzing smoothed liquidity trends over time, economists can identify periods of liquidity surplus or deficit, which can inform monetary policy decisions and market interventions.
2. Forecasting: Understanding liquidity dynamics aids in economic forecasting, particularly in predicting market liquidity, interest rate movements, and financial stability.
3. Policy Implications: Insights derived from this analysis tool can guide policymakers in formulating effective monetary policies, managing government cash flow, and ensuring financial stability.
Conclusion:
The "US Net Liquidity" analysis tool serves as a valuable resource for economists, offering a data-driven approach to understanding liquidity dynamics within the US economy. By interpreting key metrics and trends, economists can make informed decisions and contribute to macroeconomic stability and growth.
Disclaimer: This analysis is based on real-time financial data and should be used for informational purposes only. It is not intended as financial advice or a substitute for professional expertise.

Liquidations [ChartPrime]Liquidations Indicator:
The Liquidations indicator is a powerful tool designed to help traders identify significant liquidation levels in financial markets. By analyzing volume data over a specified lookback period, the indicator highlights potential areas where market participants with high leverage positions may face liquidation, providing valuable insights into market dynamics.
Usage:
Traders can use the Liquidations indicator to:
◈ Identify liquidity grab opportunities: Liquidation levels often attract price action as market participants with leveraged positions face the risk of forced liquidation. Traders can anticipate price movements as the market aims to trigger these stops, potentially leading to rapid price movements or reversals.
◈ Confirm trend strength: A cluster of liquidation levels in the same direction as the prevailing trend may confirm the strength of the trend, while divergences between liquidation levels and price movements may signal potential trend reversals.
Settings:
◈ Previous Value Bars Back: Specifies the number of previous bars used in calculating the liquidation levels.
◈ Show Leverage: Allows users to selectively display liquidation levels for different leverage multiples, including 5x, 10x, 25x, 50x, and 100x.
◈ Liquidation Levels Width: Sets the width of the lines representing liquidation levels on the chart.
◈ Short Liquidations Color: Specifies the color of the lines representing short liquidation levels.
◈ Long Liquidations Color: Specifies the color of the lines representing long liquidation levels.
◈ Bar Color: Sets the color of the background bar when the indicator is active.
Visual Representation:
◈ Liquidation levels are plotted as horizontal lines on the chart, with different colors representing short and long liquidation levels.
◈ Each liquidation level is labeled with the corresponding leverage multiple (e.g., 5x, 10x, etc.).
A dashboard displays the active liquidation levels for each leverage multiple, allowing traders to quickly assess the current market conditions.
◈ Time Window allows users to cut off unnecessary part of the chart and concentrate on a current active part of the chart to make better trading decisions:
Interpretation:
Market participants tend to place stop-loss orders near liquidation levels , creating clusters of pending orders. As price approaches these levels, it may trigger a cascade of stop-loss orders, providing liquidity for market orders and potentially leading to rapid price movements in the opposite direction.
Traders can anticipate price reversals or accelerations as price interacts with liquidation levels, using them as reference points for identifying potential entry or exit opportunities.
Note:
While the Liquidations indicator provides valuable insights into market dynamics, traders should use it in conjunction with other technical analysis tools and risk management strategies to make informed trading decisions.

Volume Delta [hapharmonic]Volume Delta: Volume Delta is an indicator that simplifies how you analyze trading volumes and the percentage of buy-sell activities effortlessly.
As a trader or market analyst, understanding underlying volume and trade flows is critical. The Volume Delta indicator provides thorough insight into both the total volume and the percentage of buying versus selling within the current candlestick. This information is pivotal for those looking to gauge market momentum and sentiment more effectively.
Additionally, the Volume Delta indicator can plot the candlestick colors based on the percentage of the dominant buying or selling volume. The area between the open and close prices of the candlestick is considered 100% and fills with colors corresponding to the predominant volume at that percentage.
Volume Delta also integrates the concept of Net volume. This component is crucial as it reveals the real market sentiment by calculating the difference between the volume of trades executed at an uptick and those at a downtick.
🟠 Overview
This indicator now displays in two layouts. Recently, Tradingview introduced the "force_overlay=true" function in Pine Script , allowing plots to be moved to the main chart. Thus, all displays are from the same indicator.
🟠 USAGE
From the data displayed in 'plot.style_columns' , the peak area represents the entire volume, accounting for 100%. Within this area, there are two color levels indicating volume. If one type of volume, whether buying or selling, exceeds the other, the larger volume will be positioned behind and the smaller in front. This arrangement prevents the scenario where a higher buying volume obscures the smaller selling volume. Therefore, the two colors can be switched between the front and the back as needed.
As you can see, the 12 and 26-day Exponential Moving Averages (EMAs) are used, with the Volume Confirmation Length set at 6. Therefore, the crossing of the EMAs proceeds normally, but it is highlighted with three triangular arrows to indicate a high likelihood of a valid crossover. However, if the volume is insufficient, these markers won't be displayed, although the EMA crossover will still occur as usual. This can be useful for using volume to verify the significance of the EMA crossover.
🟠 Setting
If you enable the label, please be aware that the chart size will shrink, causing the candlestick display to become unclear. Therefore, you might need to select "Logarithmic" at the bottom right of your screen, or for mobile applications, press and hold on the price scale and choose "Logarithmic" to adjust the scale appropriately.
Enjoy!
