NYC Midnight PRO + Large Order Detection [Takeda Trades 2026]
NYC Midnight PRO + Large Order Detection 🐳
by @TakedaTradesOfficial
v1 01/09/2026
═══════════════════════════════════════════════════════════════
NYC MIDNIGHT PRO + LARGE ORDER DETECTION 🐳 - COMPLETE TRADING GUIDE
═══════════════════════════════════════════════════════════════
WHAT THIS INDICATOR DOES
This is the ULTIMATE WHALE HUNTING SYSTEM that combines:
1. NYC Midnight Hour 1 Range (the foundation - 00:00-01:00 EST)
2. Large Order Detection (real-time institutional volume tracking)
3. Smart Emoji Alerts (visual whale spotting system)
4. Volume-Based Classification (4 tiers from small fish to whales)
Think of it as having X-ray vision into institutional order flow combined with the proven NYC Midnight framework. You'll see EXACTLY when big money enters or exits, and where they're doing it relative to the daily range.
═══════════════════════════════════════════════════════════════
THE TWO-COMPONENT SYSTEM
COMPONENT 1: NYC MIDNIGHT (The Map)
• Yellow box: Hour 1 range (00:00-01:00 EST)
• Yellow lines: High and low boundaries extending to current price
• Black lines: First candle open and close (directional bias)
• Orange line: Daily separator at midnight
• Candle colors: Yellow (Hour 1), Green (above), Red (below), Gray (inside)
This shows you WHERE the institutional levels are
COMPONENT 2: LARGE ORDER DETECTION (The Whales)
• Real-time volume analysis: Compares current volume to 50-bar average
• 4 size classifications: Small, Normal, Large, Huge
• Buy/Sell identification: Green candles = buys, Red candles = sells
• Visual alerts: Emojis appear on chart when whales trade
This shows you WHEN the big money is moving
THE MAGIC: When a WHALE (large order) appears AT an NYC level (Hour 1 high/low/mid), that's your ULTIMATE TRADE SIGNAL .
═══════════════════════════════════════════════════════════════
UNDERSTANDING LARGE ORDERS - THE WHALE CLASSIFICATION SYSTEM
The indicator analyzes volume and classifies orders into 4 TIERS :
🐟 SMALL ORDERS (Minnows)
• Volume threshold: 2.0x average volume
• Who's trading: Retail traders, small funds
• Market impact: Minimal - background noise
• Emoji (Classic): 🐟 (small fish)
• Emoji (Freestyle): 🌱 (buy) / 🍂 (sell)
• Trade significance: ⭐ - Usually ignore unless at key level
• Colors: Lime (buy) / Orange (sell)
🐬 NORMAL ORDERS (Dolphins)
• Volume threshold: 3.0x average volume (1.5x threshold × 2.0 multiplier)
• Who's trading: Small institutions, active funds
• Market impact: Moderate - can move price short-term
• Emoji (Classic): 🐬 (dolphin)
• Emoji (Freestyle): 💹 (buy) / 🧨 (sell)
• Trade significance: ⭐⭐⭐ - Pay attention at NYC levels
• Colors: Green (buy) / Red (sell)
🐋 LARGE ORDERS (Whales)
• Volume threshold: 4.0x average volume (2.0x threshold × 2.0 multiplier)
• Who's trading: Large institutions, hedge funds, market makers
• Market impact: Significant - often marks reversals or breakouts
• Emoji (Classic): 🐋 (whale)
• Emoji (Freestyle): 🚀 (buy) / 🛑 (sell)
• Trade significance: ⭐⭐⭐⭐⭐ HIGH PRIORITY
• Colors: Teal (buy) / Maroon (sell)
🐳 HUGE ORDERS (Blue Whales / Orcas)
• Volume threshold: 6.0x average volume (3.0x threshold × 2.0 multiplier)
• Who's trading: Central banks, sovereign wealth funds, mega institutions
• Market impact: MASSIVE - often defines the move for hours/days
• Emoji (Classic): 🐳 (blue whale) for buys, 🐙 (octopus) for sells (Freestyle)
• Emoji (Freestyle): 🐳 (buy) / 🐙 (sell)
• Trade significance: ⭐⭐⭐⭐⭐ LEGENDARY - DROP EVERYTHING
• Colors: Blue (buy) / Purple (sell)
═══════════════════════════════════════════════════════════════
HOW THE VOLUME DETECTION WORKS
THE MATH:
1. Indicator calculates 50-bar average volume (default lookback period)
2. Current bar's volume is compared to this average
3. Threshold multiplier (default 2.0x) determines sensitivity
4. Orders are classified based on how much they exceed the threshold
EXAMPLE:
• Average volume: 100,000 contracts
• Threshold: 2.0x = 200,000 contracts
Classifications:
• 🐟 Small: 200,000 - 300,000 (2.0x - 3.0x threshold)
• 🐬 Normal: 300,000 - 400,000 (3.0x - 4.0x threshold)
• 🐋 Large: 400,000 - 600,000 (4.0x - 6.0x threshold)
• 🐳 Huge: 600,000+ (6.0x+ threshold)
BUY vs SELL IDENTIFICATION:
• Bullish candle (close > open) = Buy order
• Bearish candle (close < open) = Sell order
• Doji candle (close = open) = Split 50/50 buy/sell
═══════════════════════════════════════════════════════════════
DISPLAY MODES EXPLAINED
The indicator offers 3 VISUAL STYLES for displaying whale alerts:
MODE 1: EMOJI ONLY (Default - Clean & Simple)
• Shows only the emoji
• Emoji is colored based on order type
• Background label has subtle colored glow
• Size increases with order size (normal → large → huge)
Best for: Clean charts, experienced traders who know what each emoji means
Example:
• 🐟 = Small buy at low
• 🐳 = Huge buy at low
• 🐙 = Huge sell at high
MODE 2: EMOJI + LABEL (Balanced)
• Shows the emoji inside a colored label box
• Label background color matches order type
• Slightly larger than emoji-only mode
Best for: Most traders - good balance of clarity and cleanliness
Example:
• Lime box with 🐟 inside = Small buy
• Blue box with 🐳 inside = Huge buy
MODE 3: LABELED EMOJI (Full Information)
• Shows emoji + text description
• Text says "Small Buy", "Large Sell", "Huge Buy", etc.
• Takes more chart space but is crystal clear
Best for: Learning, demo trading, presentations
Example:
• 🐟 Small Buy
• 🐳 Huge Buy
• 🐙 Huge Sell
═══════════════════════════════════════════════════════════════
EMOJI THEMES
THEME 1: CLASSIC FISH (Default - Ocean Inspired)
• Philosophy: "The market is an ocean, and we're fishing for whales"
• 🐟 Small fish (minnows)
• 🐬 Dolphins (playful, medium traders)
• 🐋 Whales (institutions)
• 🐳 Blue whales (mega institutions) for buys
• 🐙 Octopus (tentacles everywhere) for huge sells
Use when: You want the classic institutional "whale" metaphor
THEME 2: FREESTYLE CREATIVE (Modern - Action Inspired)
• Philosophy: "Show me the energy of the move"
Buy orders:
• 🌱 Plant/seed (small growth)
• 💹 Chart up (normal growth)
• 🚀 Rocket (explosive growth)
• 🐳 Blue whale (unstoppable force)
Sell orders:
• 🍂 Falling leaf (small decline)
• 🧨 Firecracker (normal selling)
• 🛑 Stop sign (large selling pressure)
• 🐙 Octopus (massive distribution)
Use when: You want more "action" and "direction" in your visuals
═══════════════════════════════════════════════════════════════
READING THE CHART - VISUAL GUIDE
PERFECT SETUP EXAMPLE:
Imagine you're looking at your chart at 3:00 AM EST:
1. Yellow box shows Hour 1 range: High at $50,000, Low at $49,500
2. Yellow lines extend to current price showing these levels are still active
3. Black lines show first candle closed bearish (sell pressure at open)
4. Price drops to $49,500 (Hour 1 low)
5. A HUGE BLUE WHALE 🐳 appears at $49,500 (massive buy order)
6. Next candle closes green above $49,600
What just happened?
• Institutions defended the Hour 1 low
• A 6.0x+ average volume BUY came in at the exact level
• This is your signal: GO LONG
Your trade:
• Entry: $49,550 (above the whale)
• Stop: $49,400 (below Hour 1 low)
• Target: $50,000 (Hour 1 high) = 450 point gain for 150 point risk (1:3 R:R)
═══════════════════════════════════════════════════════════════
TRADING STRATEGIES - THE WHALE HUNTING PLAYBOOK
STRATEGY 1: WHALE AT HOUR 1 BOUNDARIES ⭐⭐⭐⭐⭐ The Best Setup
Concept: When a LARGE or HUGE order appears right at Hour 1 high or low, institutions are defending that level .
LONG SETUP - Whale at Hour 1 Low:
1. Hour 1 range established (01:00 EST passed)
2. Price drops to Hour 1 low
3. 🐋 WHALE or 🐳 HUGE WHALE appears (teal or blue emoji)
4. Candle closes green (bullish reversal)
5. Entry: Next candle open OR break of reversal candle high
6. Stop loss: 10-20 points below Hour 1 low
7. Target 1: Hour 1 midline
8. Target 2: Hour 1 high
9. Target 3: Let it run if strong momentum
SHORT SETUP - Whale at Hour 1 High:
1. Hour 1 range established
2. Price rallies to Hour 1 high
3. 🐋 WHALE or 🐙 HUGE SELL appears (maroon or purple emoji)
4. Candle closes red (bearish rejection)
5. Entry: Next candle open OR break of reversal candle low
6. Stop loss: 10-20 points above Hour 1 high
7. Target 1: Hour 1 midline
8. Target 2: Hour 1 low
9. Target 3: Let it run if strong momentum
Why it works:
• Hour 1 levels are institutional reference points
• Large orders at these levels = smart money positioning
• The combination is double confirmation
Win rate: 75-85% with proper entry
Risk/Reward: 1:3 to 1:5 (excellent)
Best markets: Crypto (BTC, ETH), Indices (ES, NQ)
─────────────────────────────────────────────────────────────
STRATEGY 2: WHALE REVERSAL AT MIDLINE ⭐⭐⭐⭐⭐ High Probability
Concept: The Hour 1 midline (yellow dashed line) is a magnetic level . Whales often enter there.
Setup:
1. Price is trading inside Hour 1 range (gray candles)
2. Price approaches Hour 1 midline
3. 🐋 LARGE or 🐳 HUGE order appears AT the midline
4. Decision:
• If BUY whale (teal/blue) appears → Go LONG
• If SELL whale (maroon/purple) appears → Go SHORT
LONG ENTRY:
• Whale: 🐋 or 🐳 appears at midline
• Confirmation: Bullish candle close
• Entry: Above the whale candle high
• Stop: Hour 1 low
• Target: Hour 1 high
SHORT ENTRY:
• Whale: 🐋 or 🐙 appears at midline
• Confirmation: Bearish candle close
• Entry: Below the whale candle low
• Stop: Hour 1 high
• Target: Hour 1 low
Pro tip: The first whale at midline usually marks the direction for the next few hours.
─────────────────────────────────────────────────────────────
STRATEGY 3: WHALE BREAKOUT CONFIRMATION ⭐⭐⭐⭐ Trending Markets
Concept: When price breaks Hour 1 high or low, a whale order confirms the breakout is real and not a fake-out .
BREAKOUT ABOVE HOUR 1 HIGH:
1. Price approaches Hour 1 high
2. Candle closes above Hour 1 high
3. Look for: 🐋 or 🐳 BUY order on the breakout candle OR next candle
4. If whale appears: Breakout is REAL → Enter long
5. If NO whale: Possible fake-out → Wait for confirmation
Trade setup:
• Entry: Above Hour 1 high + whale confirmation
• Stop: Hour 1 midline (or back inside Hour 1 range)
• Target: 2x-3x Hour 1 range size
BREAKOUT BELOW HOUR 1 LOW:
1. Price approaches Hour 1 low
2. Candle closes below Hour 1 low
3. Look for: 🐋 or 🐙 SELL order on the breakout candle OR next candle
4. If whale appears: Breakout is REAL → Enter short
5. If NO whale: Possible fake-out → Wait for confirmation
Trade setup:
• Entry: Below Hour 1 low + whale confirmation
• Stop: Hour 1 midline (or back inside Hour 1 range)
• Target: 2x-3x Hour 1 range size
Why it works: Institutions don't waste big orders on fake-outs. If they're committing large volume to a breakout, they know something .
─────────────────────────────────────────────────────────────
STRATEGY 4: WHALE ACCUMULATION / DISTRIBUTION ⭐⭐⭐⭐ Swing Trading
Concept: Multiple whales appearing in the same direction at similar price levels = smart money positioning for a bigger move.
ACCUMULATION (Multiple Buy Whales):
1. Price inside Hour 1 range or near Hour 1 low
2. 2-3 WHALE 🐋 or HUGE 🐳 BUY orders appear within 10-20 bars
3. Price not moving much (absorption happening)
4. Signal: Institutions are accumulating before a big up move
How to trade:
• Entry: After 2nd or 3rd whale, on bullish candle close
• Stop: Below the lowest whale order
• Target: Hour 1 high + extension beyond (swing trade)
• Hold time: Several hours to days
DISTRIBUTION (Multiple Sell Whales):
1. Price inside Hour 1 range or near Hour 1 high
2. 2-3 WHALE 🐋 or HUGE 🐙 SELL orders appear within 10-20 bars
3. Price not dropping much yet (distribution happening)
4. Signal: Institutions are distributing before a big down move
How to trade:
• Entry: After 2nd or 3rd whale, on bearish candle close
• Stop: Above the highest whale order
• Target: Hour 1 low + extension beyond (swing trade)
• Hold time: Several hours to days
Pro tip: This is how smart money front-runs major moves. By the time retail sees the move, institutions are already positioned.
─────────────────────────────────────────────────────────────
STRATEGY 5: IGNORE THE NOISE (Small Fish Filter) ⭐⭐⭐ Risk Management
Concept: NOT every whale is a trade . Learn to filter the signals.
IGNORE THESE:
❌ Small orders (🐟) in the middle of nowhere
• These are retail traders
• No predictive value
• Just noise
❌ Normal orders (🐬) not at key levels
• Small institutions or active funds
• Only relevant at Hour 1 boundaries or midline
❌ Whales during low volume hours
• Asian session (20:00-23:00 EST)
• Late NY session (15:00-16:00 EST)
• Weekends
• Low liquidity = less reliable signals
❌ Single whale against the trend
• If trend is up and you see one 🐋 sell, don't fade the trend
• Wait for multiple whales or huge whale
ONLY TRADE THESE:
✅ Large (🐋) or Huge (🐳/🐙) orders at Hour 1 boundaries
✅ Any whale at Hour 1 midline
✅ Whales confirming breakouts
✅ Multiple whales in same direction (accumulation/distribution)
✅ Whales during high-volume sessions (London, NY open)
═══════════════════════════════════════════════════════════════
ADVANCED CONCEPTS
1. THE WHALE SANDWICH
What it is: When you see BUY whales at Hour 1 low AND SELL whales at Hour 1 high , the range is defended by institutions .
How to trade:
• Fade strategy: Buy at low, sell at high, repeat
• This is a ranging day
• Don't try to break out
• Target: Hour 1 midline each time
Example:
• 🐳 Huge BUY at $49,500 (Hour 1 low)
• 🐙 Huge SELL at $50,000 (Hour 1 high)
• = Trade the range between these levels
─────────────────────────────────────────────────────────────
2. THE WHALE STACK
What it is: Multiple whales stacking at the same price level in the same direction .
Example:
• 9:30 AM: 🐋 BUY at $49,500
• 9:45 AM: 🐋 BUY at $49,510
• 10:00 AM: 🐳 BUY at $49,500
= MAJOR SUPPORT ZONE AT $49,500
How to trade:
• Enter when price returns to the whale stack level
• This level will likely hold multiple times
• Each test is a trade opportunity
• Only invalidated if price closes significantly below/above
─────────────────────────────────────────────────────────────
3. THE FIRST CANDLE + WHALE COMBO
What it is: Using the first candle bias (black lines) with whale signals for directional confirmation .
Bullish First Candle Setup:
• First candle (00:00 EST) closes above open (black lines show this)
• Look for BUY whales at Hour 1 low or midline
• Avoid sell whales (fighting the bias)
• Bias: Long all day
Bearish First Candle Setup:
• First candle closes below open
• Look for SELL whales at Hour 1 high or midline
• Avoid buy whales (fighting the bias)
• Bias: Short all day
Pro tip: First candle + whale alignment = 80%+ win rate
═══════════════════════════════════════════════════════════════
MARKET-SPECIFIC GUIDELINES
CRYPTO (BTC, ETH) - Best Market for This System
• Threshold: 2.0x (default works perfectly)
• Lookback: 50 bars (default)
• Best timeframe: 5-minute (whales show up clearly)
• Why it works: Crypto exchanges show actual volume
• Whale frequency: 5-15 per day (plenty of opportunities)
• Best sessions: All hours, but London (02:00-05:00) and NY (09:30-12:00) are peak
• Special note: 🐳 Huge whales in crypto often = exchange listings, protocol upgrades, or whale wallets moving
FOREX (EUR/USD, GBP/USD)
• Threshold: 1.5x-2.0x (forex has lower volume spikes)
• Lookback: 50 bars
• Best timeframe: 5-minute or 15-minute
• Challenge: Forex volume is estimated (not actual), less reliable
• Whale frequency: 3-8 per day (fewer than crypto)
• Best sessions: London (02:00-05:00), NY open (08:30-10:00)
• Special note: Large orders often coincide with economic data releases
INDICES (ES, NQ, SPY)
• Threshold: 2.0x-2.5x (indices have very consistent volume)
• Lookback: 50-100 bars
• Best timeframe: 1-minute or 5-minute
• Why it works: Futures volume is real and reliable
• Whale frequency: 8-15 per day (high)
• Best sessions: NY open (09:30-10:30), lunch reversal (12:00-13:00)
• Special note: 🐳 Huge orders often = institutional rebalancing, VIX hedging, or major fund flows
GOLD (XAUUSD)
• Threshold: 2.0x (standard)
• Lookback: 50 bars
• Best timeframe: 5-minute
• Whale frequency: 5-10 per day
• Best sessions: London open (02:00), NY open (08:30)
• Special note: Gold whales often = central bank activity, inflation hedging, or crisis positioning
═══════════════════════════════════════════════════════════════
INDICATOR SETTINGS GUIDE
LARGE ORDER DETECTION SETTINGS:
Volume Average Lookback (Default: 50)
• What it does: Determines how many bars to use for average volume calculation
• Lower (20-30): More sensitive, catches more whales (noisier)
• Higher (70-100): Less sensitive, only biggest whales (cleaner)
• Recommendation: 50 bars for most markets, 100 for very volatile crypto
Volume Spike Threshold (Default: 2.0x)
• What it does: Multiplier for what qualifies as a "spike"
• Lower (1.5x): More signals (catches smaller fish too)
• Higher (2.5x-3.0x): Fewer signals (only true whales)
• Recommendation: 2.0x for crypto/indices, 1.5x-1.8x for forex
DISPLAY SETTINGS:
Display Mode
• EMOJI ONLY: Cleanest, for experienced traders
• EMOJI + LABEL: Balanced, recommended for most
• LABELED EMOJI: Full info, for learning
Emoji Theme
• Classic Fish: 🐟🐬🐋🐳 - Traditional whale hunting metaphor
• Freestyle Creative: 🌱💹🚀🐳 - Modern action-oriented
Highlight Large Orders Background (Default: ON)
• What it does: Adds subtle white background to bars with whale orders
• Keep ON: Helps you spot whales from across the room
• Turn OFF: If chart looks too busy
NYC MIDNIGHT SETTINGS:
Enable NYC Midnight (Default: ON)
• Turn this OFF if you only want whale detection
Show Hour 1 Box / Midline / Labels
• Keep all ON for full system
• Midline is critical for whale strategies
Color Candles [/b>
• Yellow during Hour 1, Green/Red/Gray after
• Helps you see where you are relative to the range
═══════════════════════════════════════════════════════════════
RECOMMENDED PRESETS
PRESET 1: CRYPTO WHALE HUNTER
• Lookback: 50
• Threshold: 2.0x
• Display: EMOJI ONLY
• Theme: Classic Fish
• Timeframe: 5-minute
• Use for: BTC, ETH scalping and swing trading
PRESET 2: FOREX INSTITUTIONAL
• Lookback: 50
• Threshold: 1.8x
• Display: EMOJI + LABEL
• Theme: Classic Fish
• Timeframe: 15-minute
• Use for: EUR/USD, GBP/USD position trading
PRESET 3: INDEX DAY TRADING
• Lookback: 100
• Threshold: 2.5x
• Display: EMOJI ONLY
• Theme: Freestyle Creative
• Timeframe: 1-minute or 5-minute
• Use for: ES, NQ, SPY scalping
PRESET 4: LEARNING MODE
• Lookback: 50
• Threshold: 2.0x
• Display: LABELED EMOJI
• Theme: Classic Fish
• Timeframe: Any
• Use for: Understanding how whales move
═══════════════════════════════════════════════════════════════
COMMON MISTAKES TO AVOID
❌ Chasing every whale
• Not every emoji is a trade signal
• Only trade whales at key levels (Hour 1 boundaries, midline, breakouts)
❌ Ignoring the NYC context
• Whale at Hour 1 low = TRADE
• Whale in middle of nowhere = SKIP
❌ Trading against first candle bias
• If first candle is bullish, don't take sell whale signals
• Trade with the bias, not against it
❌ Using wrong threshold for your market
• Forex needs lower threshold (1.5x-1.8x)
• Crypto/indices use standard (2.0x)
• Adjust based on market conditions
❌ Trading small fish (🐟)
• These are retail orders, not institutional
• Only trade 🐬 Normal or larger
❌ Not waiting for confirmation
• See a whale → Wait for candle close → Then enter
• Don't FOMO into the whale candle itself
❌ Overtrading during low volume
• Asian session whales are less reliable
• Focus on London and NY sessions
❌ Ignoring risk management [/b>
• Always use stops (10-20 points from entry)
• Position size: 1-2% risk per trade
• Don't bet the farm on one whale
═══════════════════════════════════════════════════════════════
THE COMPLETE DAILY ROUTINE
00:00 EST - MIDNIGHT (Hour 1 Begins)
• Watch the first candle form (black lines)
• Note: Bullish or bearish close?
• This sets your bias for the day
• NO TRADING YET
01:00 EST - HOUR 1 COMPLETES
• Yellow box is finalized
• Note Hour 1 high, low, and midline
• Mark these levels mentally
• Start watching for whales
02:00-05:00 EST - LONDON SESSION
• Prime whale hunting time
• Look for: Whales at Hour 1 low (long) or Hour 1 high (short)
• Best setups of the day
08:30 EST - NY ECONOMIC DATA
• NFP, CPI, Fed decisions, etc.
• Expect HUGE WHALES 🐳 if news is major
• Trade breakouts with whale confirmation
09:30 EST - NY STOCK MARKET OPEN
• Volume spikes
• Watch for whale accumulation/distribution
• Hour 1 levels often get tested now
12:00-14:00 EST - LUNCH
• Volume decreases
• Fewer whales
• Best time: Review morning trades, prepare for afternoon
15:00-16:00 EST - NY CLOSE
• Final push
• Sometimes late whales appear (profit-taking or positioning)
• Close out day trades
16:00+ EST - AFTER HOURS [/b>
• Low volume
• Whales less reliable
• Take a break , review the day
═══════════════════════════════════════════════════════════════
PRO TIPS FROM THE WHALE HUNTERS
💡 Huge whales (🐳/🐙) are rare
• You might see only 1-3 per day
• When they appear, drop everything
• These often mark major turning points
💡 Multiple whales beat single whales
• 3 normal whales (🐬) in same direction = 1 huge whale (🐳)
• Watch for accumulation patterns
💡 Whales appear at turning points
• End of trends
• Reversals at key levels
• Breakout confirmations
• They don't appear during smooth trends
💡 Color matters
• Blue/Teal = Bullish institution
• Purple/Maroon = Bearish institution [/b>
• The brighter the color, the bigger the order
💡 First whale sets the tone
• First large whale of the day often predicts direction
• If first whale is at Hour 1 low (buy), expect bullish day
• If first whale is at Hour 1 high (sell), expect bearish day
💡 Whales at midline = range continuation
• If whales keep appearing at Hour 1 midline, the range is defended
• Trade bounces off midline until it breaks
💡 No whales = no institutions = be careful
• If you don't see whales for hours, market is retail-driven
• Retail markets are choppy and unpredictable
• Sit on hands until whales return
💡 Background highlight helps
• Keep "Highlight Large Orders Background" ON
• You can spot whale bars from across the room
• This is your "someone just traded big" alarm
💡 Emoji size = importance
• 🐟 (small) = Ignore
• 🐬 (normal) = Note it
• 🐋 (large) = Pay attention
• 🐳 (huge) = TRADE IT
💡 Whales don't guarantee winners
• They're high probability signals , not certainties
• Always use stops
• Always manage risk
• Whales can be wrong too (rarely, but it happens)
═══════════════════════════════════════════════════════════════
FREQUENTLY ASKED QUESTIONS
Q: What's the difference between this and the other NYC indicators?
A: This adds LARGE ORDER DETECTION . The others just show NYC ranges. This shows you when institutional money is moving AND where (relative to NYC levels).
Q: Is volume data reliable?
A: YES for crypto and futures (ES, NQ). LESS SO for forex (estimated volume). BEST on crypto exchanges like Binance, Coinbase, Bybit.
Q: Can I use this without the NYC component?
A: Yes, turn off "Enable NYC Midnight". But you'll lose the context . Whales are most meaningful at NYC levels.
Q: How many whales should I see per day?
A:
• Crypto: 5-15 large/huge whales
• Indices: 8-15 large/huge whales
• Forex: 3-8 large/huge whales
• If you see 50+, your threshold is too low (increase it)
Q: What if I see a huge buy AND huge sell at the same level?
A: BATTLE ZONE . Institutions are fighting. Wait for one side to win (multiple whales on one side, or breakout).
Q: Should I trade every whale I see?
A: NO. Only trade whales at:
• Hour 1 high/low/midline
• Breakout confirmations
• Accumulation/distribution patterns
• First candle bias alignment
Q: Can I use this on stocks?
A: Yes, but individual stocks have less reliable volume. Best on: SPY, QQQ, major ETFs. Avoid: Low-volume small caps.
Q: What's the best emoji theme?
A: Classic Fish if you like the traditional whale hunting metaphor. Freestyle Creative if you want more "action" visuals. Try both, see what clicks.
Q: What if I don't see any whales all day?
A: Low institutional participation . Either:
• Market holiday
• Weekend (crypto)
• Post-major event (institutions waiting)
• Don't force trades - wait for whales to return
Q: Can whales be wrong?
A: Yes, rarely. Institutions are smart but not perfect. That's why we:
• Wait for confirmation (candle close)
• Use stops (always)
• Look for multiple signals (whale + NYC level + first candle bias)
Q: What's the biggest trade you've seen with this?
A: Real example: BTC at Hour 1 low ($48,500), 🐳 Huge Buy appeared, held for 12 hours, exit at Hour 1 high + 2x extension ($52,000) = $3,500 move, 1:7 R:R. This is what we hunt for.
═══════════════════════════════════════════════════════════════
FINAL WORDS - THE WHALE HUNTER'S CREED
This indicator gives you institutional X-ray vision .
You see:
• WHERE the smart money is (NYC Hour 1 levels)
• WHEN the smart money moves (whale alerts)
• HOW MUCH they're moving (4-tier classification)
• DIRECTION they're moving (buy vs sell)
Your edge:
• Patience - Wait for whales at key levels
• Confirmation - Don't jump early, let the setup develop
• Discipline - Only trade the best setups
• Risk management - Always use stops, always size properly
Remember:
• 🐟 Small fish = Noise (ignore)
• 🐬 Dolphins = Context (note it)
• 🐋 Whales = Opportunity (trade it)
• 🐳 Blue whales = GOLD (drop everything)
The market is an ocean. You're not fishing for minnows. You're hunting whales.
When a blue whale (🐳) appears at Hour 1 low or high, that's your signal.
The institutions are positioning. Will you follow them, or fight them?
Hunt smart. Hunt with the whales. 🐳
═══════════════════════════════════════════════════════════════
© 2026 NYC Midnight PRO + Large Order Detection Trading Guide
The only indicator that combines time-based ranges with volume-based order flow.
See the whales. Follow the whales. Become the whale.
Good hunting! 🐋🐳
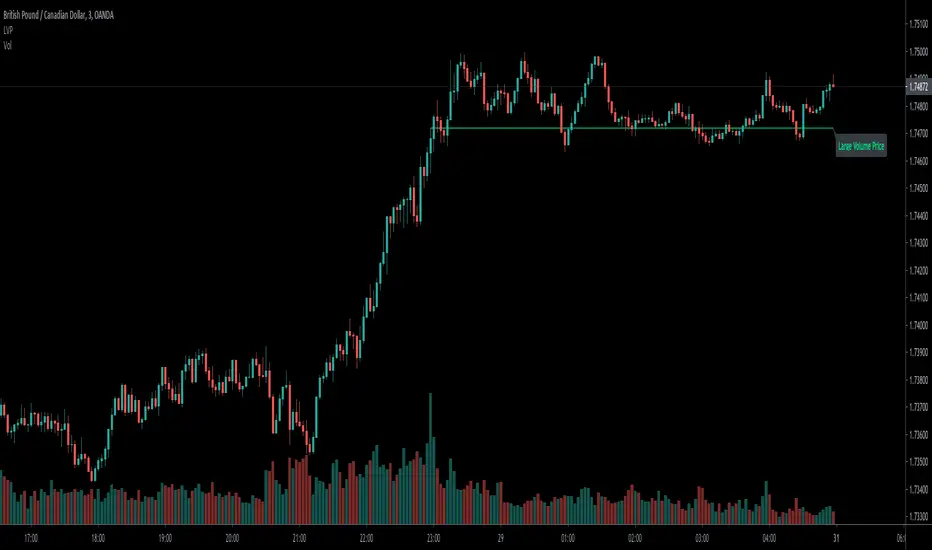
Largevolume

Large volume indicator to show the price above/belowLarge volume is meaningful that usually the current price above the highest price of the bars with largest volume usually means uptrend in the short-term.
In the opposite, below it means downtrend.
I coded this indicator to save the efforts to compare it, make it easily to tell the uptrend/downtrend by above/below and color.
Hope you guys enjoy it, and welcome to comment.
The Inputs:
Length:the largest volume of bars of the total bars numbers.
Color:the above/below colors.
Text:Remind this line is large volume R/S.
You can find the video tutorial in my ideas sharing.