RSI Call-outs [BigBitsIO]This is a simple RSI indicator that overlays the current chart to show labels for specified oversold and overbought areas defined with inputs.
It will delete any labels of the same kind within the last 3 candles so you don't see as many labels as you would otherwise.
Red labels with white text represent overbought RSI levels as defined by the user.
Green labels with black test represent oversold RSI levels as defined by the user.
This RSI overlay help easily call-out overbought and oversold candles on a chart without sacrificing screen space for a traditional RSI indicator that is not overlayed on the chart.
Label

Candle OpenerIllustrates open and close of the superior candles; the timeframe is choosable from pulldown menu.
Label shows the price of the open and indicate chosen superior candle's status (bull/bear) according to the current close.
インジケーターの設定ドロップダウンメニューから上位足の始値と終値をスイッチングできるので、タイムフレームを跨がずに現在足からラインを引くことができます。表示した上位足の始値を示すラベルは、当該足が陽線か陰線かによって色が反転します。
ライントレードの補助用インジケータとしてご利用ください。

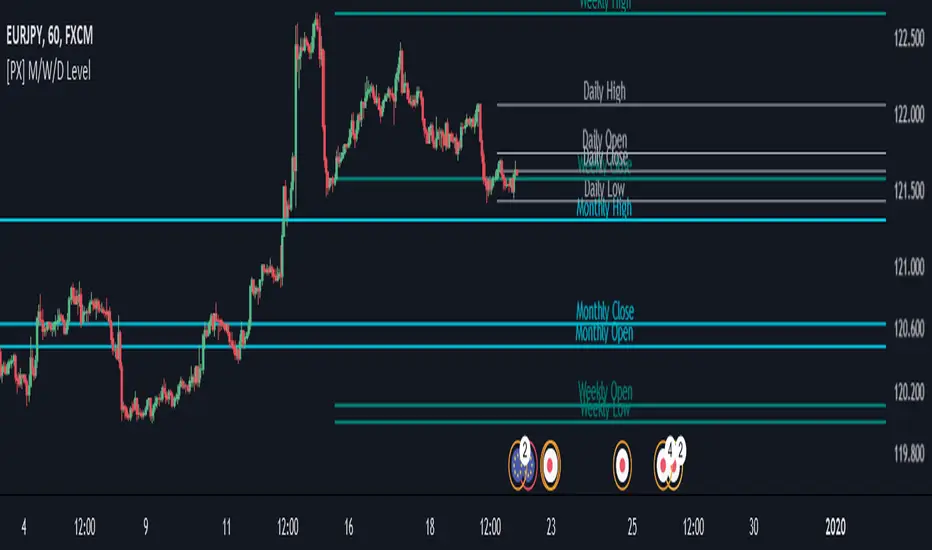
[PX] M/W/D LevelHey guys,
this script shows monthly, weekly and daily OHLC data represented as horizontal level.
I tried to make it as user-friendly as possible. Therefore, you can add different colors and styles for each level, as well as turn them on and off.
With the "Label Offset" -parameter you are in control where the label text should appear. You can shift it from left to right and vice-versa. To shift it to the left choose a negative value. To shift it to the right use a positive one.
This best setting for me personally is the "Candle Selection" -dropdown. This allows you to decide wether you want to show the previous candles OHLC-data or the current live OHLC-data.
!!CAUTION!! If you use the "Current Month/Week/Day" -selection be aware that values shown are "live"-data of the current candle. Therefore, values will change the same way your chart keeps changing on live data.
The "Previous Month/Week/Day" -selection on the other hand is historical data and therefore only changes once we reached a new month/week/day.
If you like my work, consider leaving a like :)
Happy trading!
BEST Multicolor Supertrend InfoPanelHello traders
Today is a Pinescript hack to display multiple colors in one label.
I used that panel to show the Supertrend Long Term values (weekly, monthly, quarterly, yearly)
What is a Supertrend?
Definition : SuperTrend is an indicator that works on all timeframes and all instruments (stocks, futures, forex, ...). It is a great tool to follow market trends and optimizes your profits.
SuperTrend evolves below or above the prices depending on the trend. You can use it as an exit position indicator when its direction changes. You can also use it to place your stops.
So.... the hack is?
The hack is about creating a new label for each line - versus creating just one label containing the whole text
Best regards,
Dave

[TK] Just a labelThis script puts a simple label with a customizable text on the chart.
I use this to label my different chart layouts, as tradingview unfortunately has removed the current layout name from the main user interface.

High Low of Custom Timeframes by Theoris Normal indicator for show
High - Low of Custom timeframe ( default is Day timeframe )
show label with custom Color text
and show the value of High, low.
#HOD #LOD

Scripting Tutorial 8 - Triple Many Moving Averages RibbonsThis script is for a triple moving average indicator where the user can select from different types of moving averages, price sources, lookback periods and resolutions.
Features:
- 3 Moving Averages with variable MA types, periods, price sources, resolutions and the ability to disable each individually
- Crossovers are plotted on the chart with detailed information regarding the crossover (Ex: 50 SMA crossed over 200 SMA )
- Forecasting available for all three MAs. MA values are forecasted 5 values out and plotted as if a continuation to the MA.
- Forecast bias also applies to all forecasting. Bias means we can forecast based on an anticipated bullish, bearish or neutral direction in the market.
- To understand bias, please read the source code, or if you can't read the code just send me a message on here or Twitter. Twitter should be linked to my profile.
- Ribbons added and on by default. Optional setting to disable the ribbons. 5 ribbons between MA1 and MA2 and another 5 between MA2 and MA3.
- Ribbons are alpha-color coded based on their relation to their default MAs.
- Ribbons are only visible between MAs if the MAs being compared share the same Type, Resolution, and Source because there is no way to consolidate those three in a simple manner.
- Ribbon values are calculated based on calculated MA Periods between the MAs.
This script is meant as an educational script with well-formatted styling, and references for specific functions.

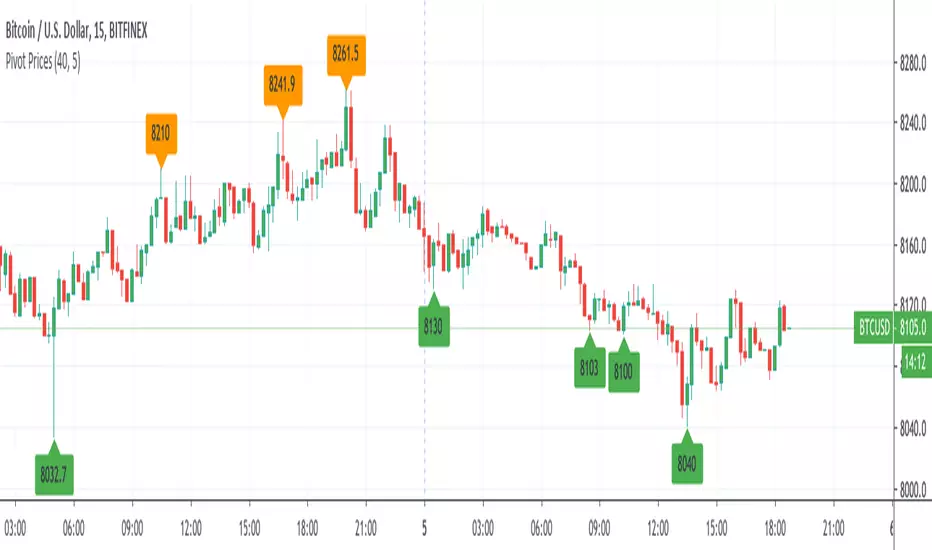
Pivot Prices - ExampleA simple example script showing how to use label.new() to plot pivot prices on the chart.
A full tutorial and commentary is available on the backtest-rookies website.
Your CRYPTO Screener - MACD 0 LAG editionHello traders
What's good?
1 - Quick introduction
This script is to demonstrate a proof-of-concept - showing you again what you thought wasn't possible might become (with some tricks) in the realm of possibles !!!.
I get requests for people who want a custom screener because the native TradingView Stocks/Forex/Crypto screeners don't allow to plug external indicators. (example: www.tradingview.com
This is entirely true and I have also good news for you, we can hack the system one more time. As Hackerman would say, "IT"S HACKING TIME !!!" (ref : KUNG FURY . (#geek #reference #done #for #today)
What if you could build your own personalized screener based on your custom indicator? "No Dave stop smoking, that's not possible, go back to eating your baguette". Say no more, let me present you my new script called YOUR CRYPTO Screener (MACD 0 LAG)
2 - What is a MACD ZERO LAG?
We'll all agree this indicator is NOT in the TradingView screeners so I'm not cheating here :)
A MACD ZERO LAG is a MACD that .... suspens.... wait for it.... DOES NOT lag.
The traditional MACD is based on exponential moving averages and as moving averages are lagging, then the MACD is lagging also. I'll spare you all the maths behind the MACD ZERO LAG but in short, this is a way more reactive indicator than the traditional MACD
I shared before the version that I personally use for my own trading : MACD 0 LAG nTREND coloring
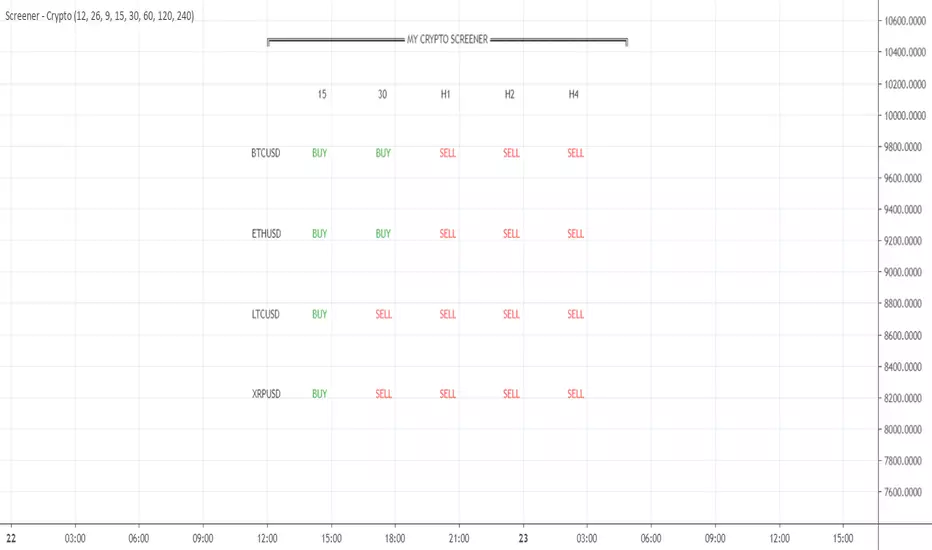
3 - Crypto Screener specifications
If I could do a screener as complete as the native one, this would be wonderful but ... we cannot and this is due to technical reasons. To call indicators from different timeframes, I have to use the security function. And we're limited to 40 security calls per indicator.
That explains why I selected 4 crypto assets and 5 timeframes and the MACD zero lag output for each asset/timeframe - which gives a total of 4 * 5 * 2 = 40
You'll be able to select from the interface the 5 timeframes that you want for your screener
In this script, you'll get a :
- BUY whenever the MACD ZERO LAG for your asset/timeframe is green.
- SELL whenever the MACD ZERO LAG for your asset/timeframe is red.
4 - Can you hack it even more?
If you want to add other timeframes or assets, you can either, change the code or add the indicator on another chart.
I made the source code generic enough so that you can update it yourself easily
Example:
Chart 1 will list BTCUSD, ETHUSD, LTCUSD, and XRPUSD in m5/m15/m30/H1/H4 and Chart2 could list BTCUSD, ETHUSD, LTCUSD and XRPUSD in H6/H8/H12/Daily, etc...
Once again the sky (and your computer RAM capacity) is the limit
5 - Can you super hack it even more?
1/ This script is only a proof-of-concept that you can build your own custom screener. Imagine having the Algorithm Builder and being able to connect it in a single click to a custom screener using your own configuration :)
How coooooooooooooooool would that be!!!
This screener version will be available on my website in a few weeks along with all the tools I'm spamming you about since the beginning of July (#shameless #self-advertising)
2/ For a nicer scripter, let's keep in mind that TradingView just enabled Webhooks this week. This will allow my company to offer custom screeners design and hosted on your own website. Those screeners will be for sure nicer than the indicator version
That's it for today and for this week
I won't even touch the laptop this weekend and will enjoy life a bit
Love you all
Dave
____________________________________________________________
Be sure to hit the thumbs up. Building those indicators take a lot of time and likes are always rewarding for me :) (tips are accepted too)
- If you want to suggest some indicators that I can develop and share with the community, please use my personal TRELLO board
- I'm an officially approved PineEditor/LUA/MT4 approved mentor on codementor. You can request a coaching with me if you want and I'll teach you how to build kick-ass indicators and strategies
Jump on a 1 to 1 coaching with me
- You can also hire for a custom dev of your indicator/strategy/bot/chrome extension/python
Supertrend MTF Heatmap V2Hello traders and aspiring Pinescripters
You might remember this script Supertrend-Heatmap-Multi-timeframes/ ?
A follower, asked me in a comment to do a version where YOU guys can select the timeframes
Well... what follower asks, follower (sometimes) gets. I'm not Santa Claus but this is Christmas with a few months in advance (#oh #oh #oh)

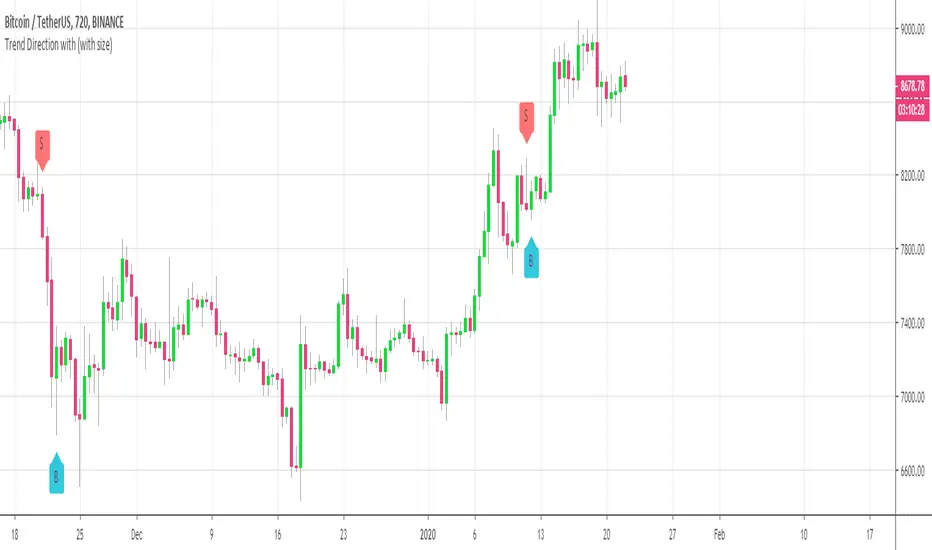
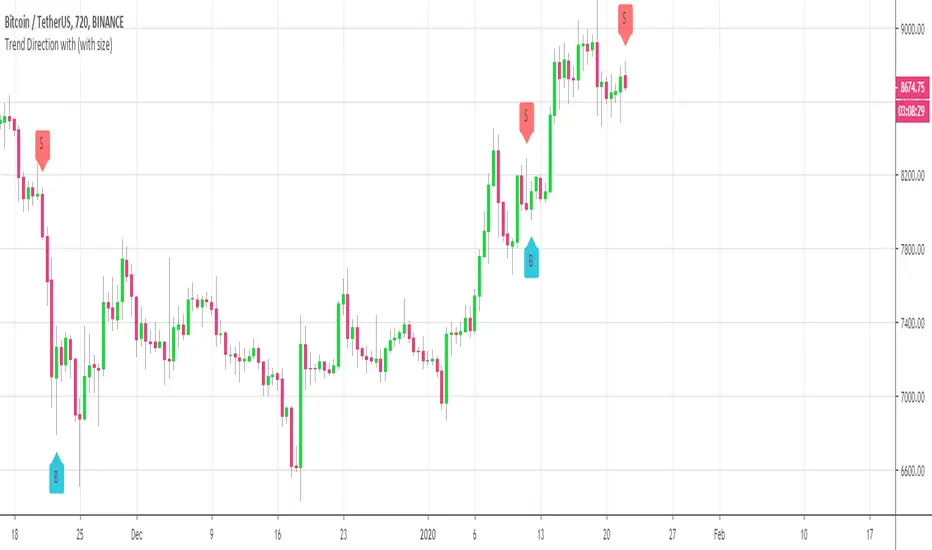
Customizable Trend Direction (Open-Source)Hello everyone
I received a ton of requests for this script so I decided to share it
I did it for a client who didn't want to pay (you can all blame... or even thank him for this script) in the end and I don't want to sell it on my website.
Not because it's not interesting but because my website will be a place to showcase and rent the Algorithm Builders mostly
What is it about?
Basically, it shows how you could convert a plotshape into a label.new object. Very interesting if you want someday to convert your V3 script into V4
With this script, it shows that you can in V4 ( but couldn't do in V3 ) do the followings :
- change dynamically the size (from tiny to huge) of any object
- change dynamically the text (from whatever to whatever) of any object
Screenshot of the user interface
imgur.com
Other use cases
I did it with the Trend Direction but could work with anything really.
- Any indicator with a visual signal. You can know personalized from a user interface the text, size and also the vertical shift. I didn't do it for that one but label.new takes a (x,y) coordinates so playing with y is fairly easy to achieve a dynamic vertical shift
- Even with this script Plotchar-How-to-draw-external-symbols-on-a-chart/ but would require to be updated with a label.new object and with a shape.none parameter so that we'll only see the icon/symbol displayed
- The colors also can be change dynamically using presets Presets-Selector-FRIDAY-NIGHT-CHALLENGE/ . If you have an indicator showing a BULLISH and a BEARISH signal, then you could, for instance, configure colors presets according to the timeframe of the chart or the indicator input, etc (sky is the limit ^^)
Be sure to hit the thumbs up at it motivates me to research what Pinescript can offer and share with the community
Dave
____________________________________________________________
- I'm an officially approved PineEditor/LUA/MT4 approved mentor on codementor. You can request a coaching with me if you want and I'll teach you how to build kick-ass indicators and strategies
Jump on a 1 to 1 coaching with me
- You can also hire for a custom dev of your indicator/strategy/bot/chrome extension/python
Current Price Label by Westy_A simple Indicator to display the current price of the asset above the current bar. It shows a green label if the close is equal or greater than the open, red otherwise.
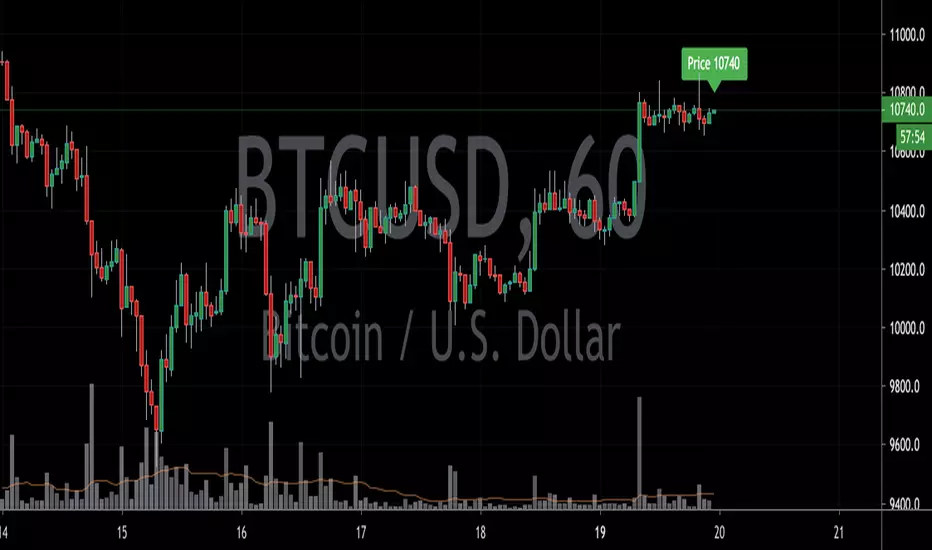
Current Price Bar LabelA simple Indicator to display the current price of the asset above the current bar. It shows a green label if the close is equal or greater than the open, red otherwise.

Customizable Trend DirectionHi everyone
Publishing this as a few clients want to try it out
It's basically a proof-of-concept to show that size and text can be manipulated :)
Size and text and label vertical position are udpatable
Will publish an open-source script today or tomorrow hopefully
Dave
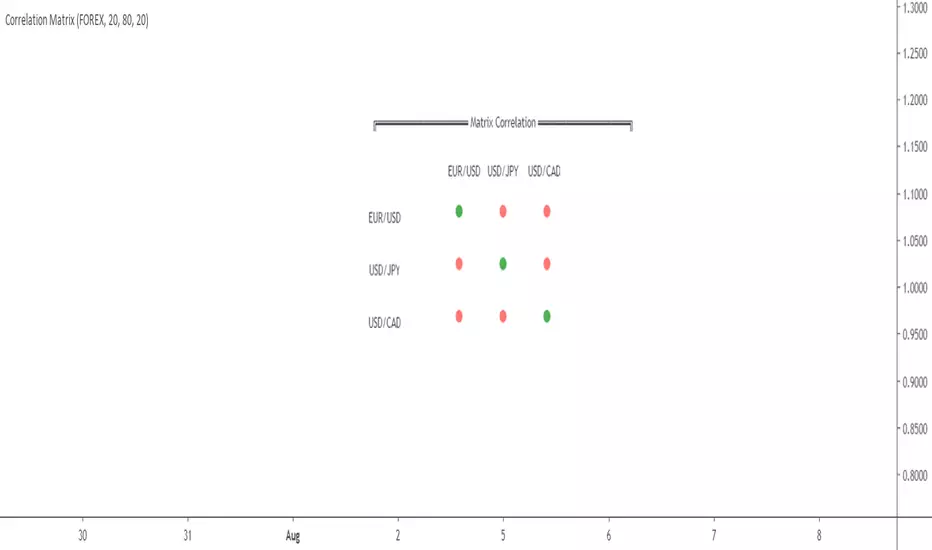
Correlation Matrix by DaveattHi everyone
A co-pinescripter friend told me this was impossible to do and we bet a free dinner tomorrow. Guess who's going to be invited to a very fancy restaurant tomorrow :) :) :) (hint: not him)
What's the today script is about?
This script is based on this MT4 correlation matrix
Asset correlation is a measure of how investments move in relation to one another and when. ... Under what is known as modern portfolio theory, you can reduce the overall risk in an investment portfolio and even boost your overall returns by investing in asset combinations that are not correlated.
I did it because it wasn't existing before with this format. What I discovered was only correlations shown as plot lines... #this #is #not #pretty
How does it work?
The correlation matrix will not be based on the current asset of the chart BUT will be based on the current timeframe (confusing? if yes, read it again until you'll get it)
- Numbers of bars back: numbers of bars used for the correlation calculation
- High correlation level: Correlation upper threshold. If above, then the correlation will be green
- Low correlation level: Correlation lower threshold. If below, then the correlation will be red
If the correlation is between the high and low levels, then it will be displayed in orange
- FOREX/INDEX: You can choose between displaying the correlation matrix between 3 FOREX or 3 INDEX assets
Also...
So far the scale doesn't respond too well to the matrix so you'll have to adapt the scale manually. I'll publish a V2 if I'll find a way to solve this issue from the code directly #new #challenge
A quick final note on why I'm sharing so much?
It challenges me to think out of the norm, get out of my bubble and explore areas of Pinescript that I still don't know. This "a script a day" challenge allows me to speed up my learning curve on Pinescript by a billion factor (and I get a few interesting gigs as well)
Let's bring this indicator to 100 LIKES guys !!!!! I think it deserves it, don't you think? :)
PS
Before all copy/pasters will add a version with crypto tomorrow, don't bother, I already did it and will post it in a few minutes for FREE :p
____________________________________________________________
Be sure to hit the thumbs up as it shows me that I'm not doing this for nothing and will motivate to deliver more quality content in the future.
- I'm an officially approved PineEditor/LUA/MT4 approved mentor on codementor. You can request a coaching with me if you want and I'll teach you how to build kick-ass indicators and strategies
Jump on a 1 to 1 coaching with me
- You can also hire for a custom dev of your indicator/strategy/bot/chrome extension/python
Crypto Prices InfoPanel V2Hello traders
Following the introduction of ByBit to TradingView ByBit on TradingView
I decided to upgrade my previous Bitcoin InfoPanel Bitcoin-Prices-InfoPanel/
Now it's more dynamic (thumbs up) but only work with Bitcoin, Ethereum and Litecoin . If you select any other asset than those 3, the script won't work
This is due to a technical limitation on TradingView because I can't do more than 40 security calls per script
If you don't know what the security function is, here's a reminder : Security documentation . If you don't know what is TradingView... I cannot do anything for you...
Now you can use this panel to have a very cool arbitrage view directly from TradingView and use the info to gamble between brokers (not financial advice)
See you all tomorrow for a huge update regarding the Strategy Builder. I'll show you how to connect it to a Backtest system
____________________________________________________________
Feel free to hit the thumbs up as it shows me that I'm not doing this for nothing and will motivate to deliver more quality content in the future.
- I'm an officially approved PineEditor/LUA/MT4 approved mentor on codementor. You can request a coaching with me if you want and I'll teach you how to build kick-ass indicators and strategies
Jump on a 1 to 1 coaching with me
- You can also hire for a custom dev of your indicator/strategy/bot/chrome extension/python

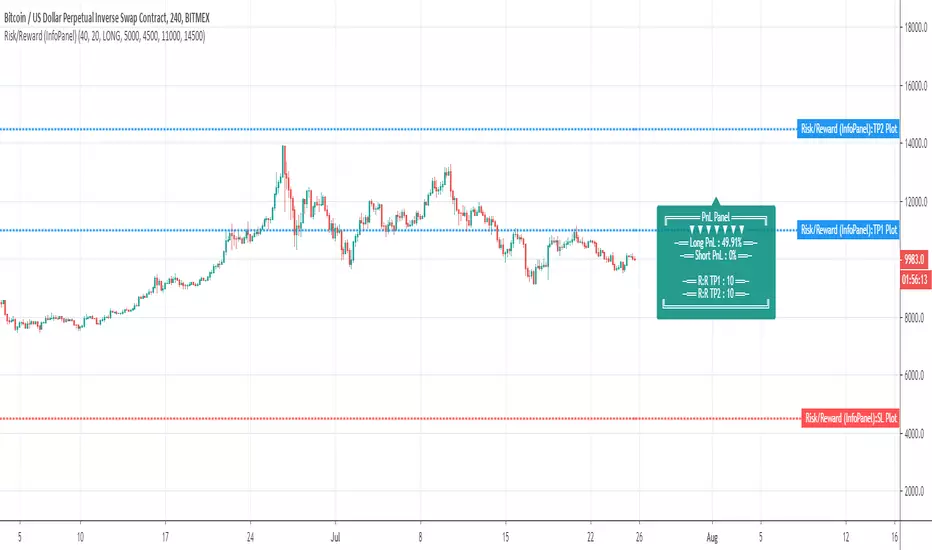
Risk/Reward (InfoPanel)Hello ladies (if any in my followers ?) and gentlemen
Here's your indicator of the day and once again given for FREE. What I'm going to say to my landlord if I can't pay rent because I'm not asking for $$ ?
I'll probably send the next indicators from below the town brige. Even then... I will still comply with my challenge to share 1 original indicator a day and not a copy of what already exists
The today indicator is to show you the great possibilites behind the TradingView Label object : Label
Profit And Loss LABEL
I thought about that one for a while and wanted to share how we can calculate dynamically a Risk to Reward ratio .
This indicator is not based on the price on the chart. I repeat before getting the question asked me privately 10 times This indicator is not based on the price on the chart.
"Then it's not useful dude, you're dumb". I agree and.... I agree... BUT you can now calculate your Risk to Reward ratio on TradingView directly rather than using an external Excel file. Who's dumb now :) ?
For those curious about it, I used this formula for the R:R ratio formula Calculating-risk-reward.asp
It will also display the Profit and Loss data based on your inputs only
ERRORS LABEL
I also added some basic errors management. If any error occur when you'll type your inputs, then a very mean Error label will appear and you'll have to fix the issues in less than a few seconds.
Otherwise your computer will explode (KABOOOOM) and your trading capital will be redirected to my own insurance fund (I have a family to feed, thanks for your sacrifices)
(end of joke)
In more seriousness, the engine will check if the TP1/TP2/Stop Loss/Entry price combinaisons makes sense. If not, you''ll be punished with an error label.
You can use this methodology for your own indicators in the futur to display dynamic messages based on users' inputs and/or current price on the chart
The educational video giving more details is coming right up.
You can watch it and should be located under "IDEAS"
Wshing you all a very fruitful end of your day and see you tomorrow for the last indicator of the week (baby David is tired and need his rest)
Dave
Trade ManagerHello everyone
Hoped you had a great weekend and are ready for what's coming this week
I'll never fail to satisfy my audience on TradingView and I'll start by sharing some heavy stuff.... Imagine the most amazing thing you had in your life. You got it ? now multiply this good feeling by 100 !!! OK... now I have a tool that is beyond that litteraly. Don't believe me, here's the Trade Manager ladies and gentlemen, I could barely contain my excitement this weekend to share it with the community
I wasn't sure of sharing it but you guys did a great job with my other indicators giving me constructive feedback to improve them. Also, those helping me with such feedback usually get the indicator for a lifetime access for free.
Please read this educational post I published for you before proceeding further : How-to-set-an-indicator-to-work-with-the-Trade-manager/
From here you normally connected the data source of your own indicator to the Trade Manager. If not, here's a reminder of the article mentionned above
Step 1 - Update your indicator
Somewhere in the code you'll have a LONG and a SHORT condition. If not, please go back to study trading for noobs (I'm kidding !!!)
So it should look to something similar
macrossover = crossover(MA1, MA2)
macrossunder = crossunder(MA1, MA2)
What you will need to add at the very end of your script is a Signal plot that will be captured by the Trade Manager. This will give us :
// Signal plot to be used as external
// if crossover, sends 1, otherwise sends -1
Signal = macrossover ? 1 : macrossunder ? -1 : na
plot(Signal, title="Signal")
The Trade Manager engines expects to receive 1 for a bullishg signal and -1 for bearish .
Step 2 - Add the Trade Manager to your chart and select the right Data Source
I feel the questions coming so I prefer to anticipate :) When you add the Trade Manager to your chart, nothing will be displayed. THIS IS NORMAL because you'll have to select the Data Source to be "Signal"
Remember our Signal variable from the Two MM Cross from before, now we'll capture it and.....drumb rolll...... that's from that moment that your life became even more AWESOME
The Engine will capture the last signal from the MM cross or any indicator actually and will update the Stop Loss, Take Profit levels based on the parameters you set on the Trade Manager
Now I'll cover the different parameters of the tool
It should be straightforward but better to explain everything here
+Label lines : if unchecked, no SL/TPs/... will be displayed
+Show indicators : This does nothing. Tradingview doesn't give the possibility to set Labels on an UI so we have to use this hack with a useless checkbox
+Show PnL Panel : Will show a Panel at the right of your chart with the PnL updated for the last position only. In a future version, I'll make it work to list maybe the previous N positions defined by the user
+Show Stop Loss Signal : Will display the stop loss label. You have the choice between three options :
++Percentage : Will set the SL at a percent distance from the price
++Fixed : SL fixed at a static price
++SuperTrend : Trailing stop loss based on Supertrend
'll add many more options this week for sure
+Take Profit 1,2,3 : Visually define the three Take Profit levels
Please note that once a Take profit level is reached, it will magically disappear. This is to be expected
This indicator is a first draft of what I believe is such a great tool because can be connected to any indicator. I confess that I tried it only with a few... if you find any that's not working with the Trade manager, please let me know and I'll have a look (for free)
I'm so excited to share it with all of you and that's the best possible way I could ever dreamt of to start the week with my TradingView community
Wishing you all the best and a pleasant experience with my work
David
SMA 50 collector V2Hi everyone
The today script is an upgrade on steroids of my previous SMA 50 collector
Why this script ?
The SMA 50 is known to define a trend. If price is closing above, trend is bullish , if below, trend is bearish.
That's why I like to have all of them in all timeframes on my chart :)
Those are very relevant for all assets class : FOREX, INDEX, STOCKS, CRYPTO, ...
What's the update ?
I added new timeframes and developped a small optimization to get those labels placed on the right hand side of your screen.
"Is it really useful sir ?" Well, you certainly noticed that looking at a chart on tradingview mobile is not ideal (indicators overlapping, indicator names taking too much space and so on...)
When you'll deactivate the indicator name label display from tradingview, you can activate mine which will look way nicer on your mobile (and even Desktop).
This concept was greatly inspired by @scarf :
HOW TO USE IT ?
You can activate/deactivate the SMA50 you (don't) need in the style section of the indicator configuration UI. You'll just have to uncheck/check. Simple right :) ?
See y'all tomorrow for the next indicator or idea. The one for tomorrow should blow your mind as it certainly did when I discovered and optimized it
Enjoy
Dave

SMA collector MTF ForecastHello everyone
Here's the today indicator
That one is a true gift before X-mas. X-mas in July which bundles a lot more than what Santa Claus will offer you in December :)
So without further due, let's dive right in
This indicator will display the following algorithmic SMA :
SMA 20 Daily
SMA 50 Daily
SMA 50 Daily
SMA 100 Daily
SMA 200 Daily
SMA 20 Weekly
SMA 50 Weekly
SMA 100 Weekly
SMA 200 Weekly
SMA 7 Monthly
SMA 20 Monthly
SMA 50 Monthly
Those SMA usually work as big supports/resistances for all tradable assets (forex, index, crypto, stocks, ...)
That's it for the first feature, let's cover the next one
2/ I developped a small optimization to get those labels placed on the right hand side of your screen.
"Is it really useful sir ?" Well, you certainly noticed that looking at a chart on tradingview mobile is not ideal (indicators overlapping, indicator names taking too much space and so on...)
When you'll deactivate the indicator name label display from tradingview, you can activate mine which will look way nicer on your mobile (and even Desktop).
This concept was greatly inspired by @scarf :
3/ Now the cherry on the top of the cherry on the top of the.... cake
You'll have the cool option to display the forecasts for those SMAs based on either current price "flat" or a 3 period liner regressions "linreg".
You can play out with the forecasts options and find out which ones will make the most of sense to you
They're represented by small dots at the very right of the moving averages
This concept was greatly inspired by @yatrader2 :
That's a lot to digest but hope it went smoothly
As always if you have any question or feedback or complain or you want to show me some love (please), shoot it in the comments section
See y'all tomorrow for another indicator
Enjoy
Dave

Bitcoin Prices InfoPanelHello traders
This script is based on the great Ricardo Santos InfoPanel script
It will display all the Bitcoin prices
The script is public so you can adjust according to your own needs
PS
You might have to scroll right on your chart to see the panel
Enjoy :)
Dave

