KST Strategy [Skyrexio]Overview
KST Strategy leverages Know Sure Thing (KST) indicator in conjunction with the Williams Alligator and Moving average to obtain the high probability setups. KST is used for for having the high probability to enter in the direction of a current trend when momentum is rising, Alligator is used as a short term trend filter, while Moving average approximates the long term trend and allows trades only in its direction. Also strategy has the additional optional filter on Choppiness Index which does not allow trades if market is choppy, above the user-specified threshold. Strategy has the user specified take profit and stop-loss numbers, but multiplied by Average True Range (ATR) value on the moment when trade is open. The strategy opens only long trades.
Unique Features
ATR based stop-loss and take profit. Instead of fixed take profit and stop-loss percentage strategy utilizes user chosen numbers multiplied by ATR for its calculation.
Configurable Trading Periods. Users can tailor the strategy to specific market windows, adapting to different market conditions.
Optional Choppiness Index filter. Strategy allows to choose if it will use the filter trades with Choppiness Index and set up its threshold.
Methodology
The strategy opens long trade when the following price met the conditions:
Close price is above the Alligator's jaw line
Close price is above the filtering Moving average
KST line of Know Sure Thing indicator shall cross over its signal line (details in justification of methodology)
If the Choppiness Index filter is enabled its value shall be less than user defined threshold
When the long trade is executed algorithm defines the stop-loss level as the low minus user defined number, multiplied by ATR at the trade open candle. Also it defines take profit with close price plus user defined number, multiplied by ATR at the trade open candle. While trade is in progress, if high price on any candle above the calculated take profit level or low price is below the calculated stop loss level, trade is closed.
Strategy settings
In the inputs window user can setup the following strategy settings:
ATR Stop Loss (by default = 1.5, number of ATRs to calculate stop-loss level)
ATR Take Profit (by default = 3.5, number of ATRs to calculate take profit level)
Filter MA Type (by default = Least Squares MA, type of moving average which is used for filter MA)
Filter MA Length (by default = 200, length for filter MA calculation)
Enable Choppiness Index Filter (by default = true, setting to choose the optional filtering using Choppiness index)
Choppiness Index Threshold (by default = 50, Choppiness Index threshold, its value shall be below it to allow trades execution)
Choppiness Index Length (by default = 14, length used in Choppiness index calculation)
KST ROC Length #1 (by default = 10, value used in KST indicator calculation, more information in Justification of Methodology)
KST ROC Length #2 (by default = 15, value used in KST indicator calculation, more information in Justification of Methodology)
KST ROC Length #3 (by default = 20, value used in KST indicator calculation, more information in Justification of Methodology)
KST ROC Length #4 (by default = 30, value used in KST indicator calculation, more information in Justification of Methodology)
KST SMA Length #1 (by default = 10, value used in KST indicator calculation, more information in Justification of Methodology)
KST SMA Length #2 (by default = 10, value used in KST indicator calculation, more information in Justification of Methodology)
KST SMA Length #3 (by default = 10, value used in KST indicator calculation, more information in Justification of Methodology)
KST SMA Length #4 (by default = 15, value used in KST indicator calculation, more information in Justification of Methodology)
KST Signal Line Length (by default = 10, value used in KST indicator calculation, more information in Justification of Methodology)
User can choose the optimal parameters during backtesting on certain price chart.
Justification of Methodology
Before understanding why this particular combination of indicator has been chosen let's briefly explain what is KST, Williams Alligator, Moving Average, ATR and Choppiness Index.
The KST (Know Sure Thing) is a momentum oscillator developed by Martin Pring. It combines multiple Rate of Change (ROC) values, smoothed over different timeframes, to identify trend direction and momentum strength. First of all, what is ROC? ROC (Rate of Change) is a momentum indicator that measures the percentage change in price between the current price and the price a set number of periods ago.
ROC = 100 * (Current Price - Price N Periods Ago) / Price N Periods Ago
In our case N is the KST ROC Length inputs from settings, here we will calculate 4 different ROCs to obtain KST value:
KST = ROC1_smooth × 1 + ROC2_smooth × 2 + ROC3_smooth × 3 + ROC4_smooth × 4
ROC1 = ROC(close, KST ROC Length #1), smoothed by KST SMA Length #1,
ROC2 = ROC(close, KST ROC Length #2), smoothed by KST SMA Length #2,
ROC3 = ROC(close, KST ROC Length #3), smoothed by KST SMA Length #3,
ROC4 = ROC(close, KST ROC Length #4), smoothed by KST SMA Length #4
Also for this indicator the signal line is calculated:
Signal = SMA(KST, KST Signal Line Length)
When the KST line rises, it indicates increasing momentum and suggests that an upward trend may be developing. Conversely, when the KST line declines, it reflects weakening momentum and a potential downward trend. A crossover of the KST line above its signal line is considered a buy signal, while a crossover below the signal line is viewed as a sell signal. If the KST stays above zero, it indicates overall bullish momentum; if it remains below zero, it points to bearish momentum. The KST indicator smooths momentum across multiple timeframes, helping to reduce noise and provide clearer signals for medium- to long-term trends.
Next, let’s discuss the short-term trend filter, which combines the Williams Alligator and Williams Fractals. Williams Alligator
Developed by Bill Williams, the Alligator is a technical indicator that identifies trends and potential market reversals. It consists of three smoothed moving averages:
Jaw (Blue Line): The slowest of the three, based on a 13-period smoothed moving average shifted 8 bars ahead.
Teeth (Red Line): The medium-speed line, derived from an 8-period smoothed moving average shifted 5 bars forward.
Lips (Green Line): The fastest line, calculated using a 5-period smoothed moving average shifted 3 bars forward.
When the lines diverge and align in order, the "Alligator" is "awake," signaling a strong trend. When the lines overlap or intertwine, the "Alligator" is "asleep," indicating a range-bound or sideways market. This indicator helps traders determine when to enter or avoid trades.
The next indicator is Moving Average. It has a lot of different types which can be chosen to filter trades and the Least Squares MA is used by default settings. Let's briefly explain what is it.
The Least Squares Moving Average (LSMA) — also known as Linear Regression Moving Average — is a trend-following indicator that uses the least squares method to fit a straight line to the price data over a given period, then plots the value of that line at the most recent point. It draws the best-fitting straight line through the past N prices (using linear regression), and then takes the endpoint of that line as the value of the moving average for that bar. The LSMA aims to reduce lag and highlight the current trend more accurately than traditional moving averages like SMA or EMA.
Key Features:
It reacts faster to price changes than most moving averages.
It is smoother and less noisy than short-term EMAs.
It can be used to identify trend direction, momentum, and potential reversal points.
ATR (Average True Range) is a volatility indicator that measures how much an asset typically moves during a given period. It was introduced by J. Welles Wilder and is widely used to assess market volatility, not direction.
To calculate it first of all we need to get True Range (TR), this is the greatest value among:
High - Low
abs(High - Previous Close)
abs(Low - Previous Close)
ATR = MA(TR, n) , where n is number of periods for moving average, in our case equals 14.
ATR shows how much an asset moves on average per candle/bar. A higher ATR means more volatility; a lower ATR means a calmer market.
The Choppiness Index is a technical indicator that quantifies whether the market is trending or choppy (sideways). It doesn't indicate trend direction — only the strength or weakness of a trend. Higher Choppiness Index usually approximates the sideways market, while its low value tells us that there is a high probability of a trend.
Choppiness Index = 100 × log10(ΣATR(n) / (MaxHigh(n) - MinLow(n))) / log10(n)
where:
ΣATR(n) = sum of the Average True Range over n periods
MaxHigh(n) = highest high over n periods
MinLow(n) = lowest low over n periods
log10 = base-10 logarithm
Now let's understand how these indicators work in conjunction and why they were chosen for this strategy. KST indicator approximates current momentum, when it is rising and KST line crosses over the signal line there is high probability that short term trend is reversing to the upside and strategy allows to take part in this potential move. Alligator's jaw (blue) line is used as an approximation of a short term trend, taking trades only above it we want to avoid trading against trend to increase probability that long trade is going to be winning.
Almost the same for Moving Average, but it approximates the long term trend, this is just the additional filter. If we trade in the direction of the long term trend we increase probability that higher risk to reward trade will hit the take profit. Choppiness index is the optional filter, but if it turned on it is used for approximating if now market is in sideways or in trend. On the range bounded market the potential moves are restricted. We want to decrease probability opening trades in such condition avoiding trades if this index is above threshold value.
When trade is open script sets the stop loss and take profit targets. ATR approximates the current volatility, so we can make a decision when to exit a trade based on current market condition, it can increase the probability that strategy will avoid the excessive stop loss hits, but anyway user can setup how many ATRs to use as a stop loss and take profit target. As was said in the Methodology stop loss level is obtained by subtracting number of ATRs from trade opening candle low, while take profit by adding to this candle's close.
Backtest Results
Operating window: Date range of backtests is 2023.01.01 - 2025.05.01. It is chosen to let the strategy to close all opened positions.
Commission and Slippage: Includes a standard Binance commission of 0.1% and accounts for possible slippage over 5 ticks.
Initial capital: 10000 USDT
Percent of capital used in every trade: 60%
Maximum Single Position Loss: -5.53%
Maximum Single Profit: +8.35%
Net Profit: +5175.20 USDT (+51.75%)
Total Trades: 120 (56.67% win rate)
Profit Factor: 1.747
Maximum Accumulated Loss: 1039.89 USDT (-9.1%)
Average Profit per Trade: 43.13 USDT (+0.6%)
Average Trade Duration: 27 hours
These results are obtained with realistic parameters representing trading conditions observed at major exchanges such as Binance and with realistic trading portfolio usage parameters.
How to Use
Add the script to favorites for easy access.
Apply to the desired timeframe and chart (optimal performance observed on 1h BTC/USDT).
Configure settings using the dropdown choice list in the built-in menu.
Set up alerts to automate strategy positions through web hook with the text: {{strategy.order.alert_message}}
Disclaimer:
Educational and informational tool reflecting Skyrexio commitment to informed trading. Past performance does not guarantee future results. Test strategies in a simulated environment before live implementation.
KST

Log Know Sure ThingThe Know Sure Thing indicator (KST) is a momentum based oscillator. KST is based on Rate of Change (ROC). Know Sure Thing takes four different timeframes of ROC and smooth's them out using Simple Moving Averages. KST then calculates a final value that fluctuates between positive and negative values above and below a Zero Line. There is also a signal line which is an SMA of the KST line itself. Essentially, the Know Sure Thing Indicator measures the momentum of four separate price cycles. Technical Analysts use this information to spot divergences, overbought and oversold conditions and crossovers.
KST takes the Rate of Change for four different time periods, smooth's them out with moving averages, weights them and then sums the results. The intention is to get a better understanding of the momentum for a particular security of financial instrument. The general rule is that when KST is positive, then momentum is up and when KST is negative, then momentum is down. This would translate to Bullish and Bearish markets respectively.
The original Know Sure Thing indicator (KST) was developed by Martin Pring and introduced in 1992 in Stocks & Commodities Magazine. He originally referred to the indicator as the Summed Rate of Change.
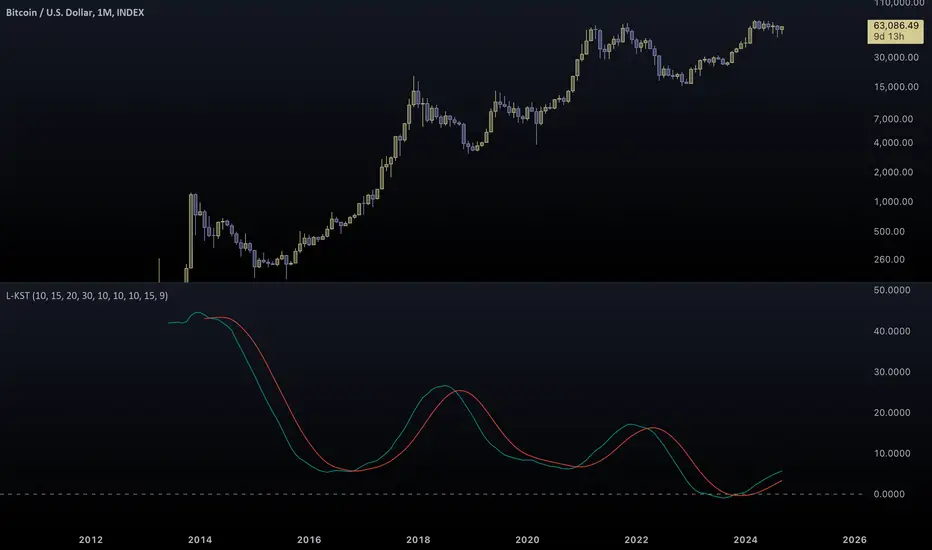
This version of the indicator "Log Know Sure Thing" (L-KST) was developed by me as a refined solution to the original. Exponential charts like Bitcoin need exponential calculations. Simplistic approaches don't work in today's world. This indicator manages to adapt in all kinds of scenarios...
From negative charts:
(notice that the original KST breaks)
To extreme charts:
(again, the original doesn't manage to capture the Bitcoin oscillation)
If you are not familiar with KST, read the following analysis:
www.tradingview.com
For a following version of this indicator I plan to incorporate actual overbought-oversold levels (if this doesn't mark the 20th).
Contrary to the original, this version of KST is bound to specific levels.
Stay tuned for that, it won't take long...
Tread lightly, for this is no-mans-land.
Use caution when using contraband indicators.
-Father Akikostas
MACD (KST Based) V2This is the next version of the original indicator:
To anyone unfamiliar with KST, it is a cousin of RSI. Basically, this indicator is analyzed like we would analyze charts using Stochastic RSI. It is basically an "energy oscillator".
This indicator considers price with the theory of relativity.
Relativity works this way: A downward moving MACD means that price velocity is slowing down. An upward moving one means that price is accelerating .
KST-Based MACD is all about relative performance. Exponential charts behave identically to horizontal ones.
Compare SPX and SPX/CURRCIR and see for yourself.
Just like the classic MACD, bear/bull signals appear on the histogram.
A band is drawn around the MACD, which is useful to pinpoint overbought/oversold conditions / squeezes.
It is also very useful for pinpointing / confirming divergences.
Tread lightly, for this is hallowed ground.
-Father Grigori
P.S. This is version 2 of the original one. Custom formulae are used all around this indicator. Basically, every formula has been reimagined for it to work in super-long-term timeframes. This indicator, compared to the previous one, doesn't ignore any chart data. It takes every single candle into consideration.
P.S.2. Pro tip: Use two separate windows, one with KST-MACD and one with KST-Histogram, just like in the cover.

KST-Based MACDAs a follow-up to my previous script:
I am posting a stand-alone KST-based MACD.
Note that this indicator is highly laggy. Specific care must be taken when using it.
The MACD-Signal crossing is quite delayed but it is a definite confirmation.
For earlier signs, the Histogram must be analyzed. A shift from Green-White signals the 1st Bear Signal.
A MACD-Signal crossing signals the 2nd Bear SIgnal.
The same applies for bull-signs.
This indicator is useful for long-term charts on which one might want to pinpoint clear, longterm divergences.
Standard RSI, Stochastic RSI and MACD are notoriously problematic when trying to pinpoint long-term divergences.
Finally, this indicator is not meant for pinpointing entry-exit positions. I find it useful for macro analysis. In my experience, the decreased sensitivity of this indicator can show very strong signs, that can be quite laggy.
Inside the indicator there is a setting for "exotic calculations". This is an attempt to make this chart work in both linear/ negative charts (T10Y2Y) and log charts (SPX)
Tread lightly, for this is hallowed ground.
-Father Grigori

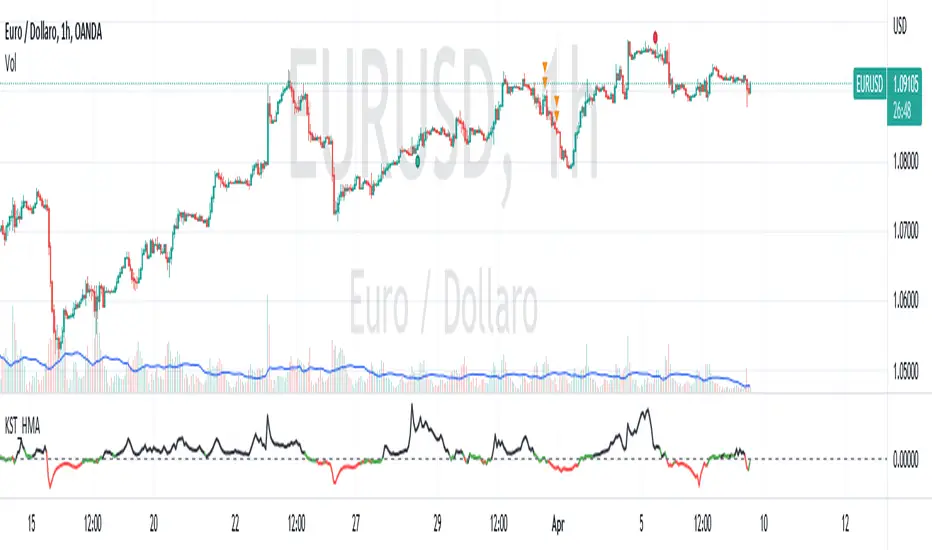
KST con HMA---------- ENGLISH DESCRIPTION ----------
The indicator created is called "KST with HMA" and is used to measure the impulse of an asset's price.
The code begins by defining four variables representing ROC (Rate of Change) period lengths for calculating the KST (Know Sure Thing) and a variable for the length of the HMA (Hull Moving Average).
Next, an HMA function is defined to calculate the Hull Moving Average, a type of weighted moving average that adjusts for price volatility.
ROC values are then calculated for the four periods defined above and KST values are calculated as a weighted sum of the ROC values. These values are then normalized with the HMA and the standard deviation of the HMA is calculated. The normalized value is finally plotted with three different color lines: black for values greater than 1, red for values less than -1, and green for values between -1 and 1.
Finally, a black dashed line is plotted to represent the zero line. The green line indicates a phase of market uncertainty or lateralization, while the indicator can be used to identify buy points above zero and sell points below zero.
---------- ITALIAN DESCRIPTION ----------
L'indicatore creato è chiamato "KST con HMA" e viene utilizzato per misurare l'impulso del prezzo di un asset.
Il codice inizia definendo quattro variabili che rappresentano le lunghezze dei periodi di ROC (Rate of Change) per il calcolo del KST (Know Sure Thing) e una variabile per la lunghezza dell'HMA (Hull Moving Average).
Successivamente viene definita una funzione HMA per il calcolo della Hull Moving Average, un tipo di media mobile ponderata che si adatta alla volatilità del prezzo.
Vengono poi calcolati i valori ROC per i quattro periodi definiti in precedenza e calcolati i valori KST come somma ponderata dei valori ROC. Questi valori vengono poi normalizzati con l'HMA e viene calcolata la deviazione standard dell'HMA. Il valore normalizzato viene infine plottato con tre diverse linee di colore: nero per valori superiori a 1, rosso per valori inferiori a -1 e verde per valori tra -1 e 1.
Infine, viene plottata una linea tratteggiata nera per rappresentare la linea zero. La linea verde indica una fase di incertezza o lateralizzazione del mercato, mentre l'indicatore può essere utilizzato per individuare punti di acquisto sopra lo zero e di vendita al di sotto dello zero.
Adaptive Fisherized KSTIntroduction
Heyo guys, here is a new adaptive fisherized indicator of me.
I applied Inverse Fisher Transform, Ehlers dominant cycle analysis,
smoothing and divergence analysis on the Know Sure Thing (KST) indicator.
Moreover, the indicator doesn't repaint.
Usage
I didn't backtest the indicator, but I recommend the 5–15 min timeframe.
It can be also used on other timeframs, but I have no experience with that.
The indicator has no special filter system, so you need to find an own combo in order to build a trading system.
A trend filter like KAMA or my Adaptive Fisherized Trend Intensity Index could fit well.
If you find a good combo, let me know it in the comments pls.
Signals
Zero Line
KST crossover 0 => Enter Long
KST crossunder 0 => Enter Short
Cross
KST crossover KST MA => Enter Long
KST crossunder KST MA => Enter Short
Cross Filtered
KST crossover KST MA and KST above 0 => Enter Long
KST crossunder KST MA and KST under 0 => Enter Short
KST crossunder 0 => Exit Long
KST crossover 0 => Exit Short
More to read: KST Explanation
Enjoy and let me know your opinion!
--
Credits to
- @tista
- @blackcat1402
- @DasanC
- @cheatcountry

Know Sure Thing - Weekly Candle VersionKnow Sure Thing - Plotted on weekly candles (source from Martin Pring)
Developed by Martin Pring, Know Sure Thing (KST) is a momentum oscillator based on the smoothed rate-of-change for four different timeframes.
Modifications:
Arrows representing long/short signals based on the timeframe (S for short term, M for mid term, L for long term)

Know Sure Thing and EMA Strategy by JLXThis is a simple strategy based in Know Sure Thing indicator and an Exponential moving average,
Rules are as follow:
- You can go long when the KST cross signal bellow 0 and price closes above the target EMA
- You can go short when the KST cross signal above 0 and price closes bellow the target EMA
I include a trailing stop loss, default its 0.5%
Hope you enjoy it

Dankland Playground Moneymaker - V2“version 2” of my playground bot script. Its essentially a powerhouse suite of strategies. Although it is similar to the previous script, it nets different results as sections have been changed. Such as the somewhat reluctant removal of the Chande Momentum... The RSIs have also been updated, this was one of the main changes. RSIS now include a Moving Average cross of RSI to generate signals above and below the given thresholds instead of simply on crossing a threshold. This should give greater functionality overall. Most functions including Moving Averages have been updated to include a wider range of kinds of moving averages. This includes not just the moving average cross, but MACD and RSIs as well. I tried to perform the same upgrade on the %B, Stochastics and SMI, but hit the unpacked code limit of 60,000 lines... So, more “versions” will have to come for future “upgrades”, with the recognition that there will be cases where the old, “downgraded” versions may perform better and that some people (like myself) may continue to use them on some markets until I/we devise superior settings on the new ones for said markets. For instance, instead of replacing my 1 hr BTCUSD bot (where I used the now deleted Chande to pretty pleasing affect...) I made a new one for LINKUSD 10 min so I can have both running for now and work on replacing the BTCUSD later.
How it works basically is this... you have 16 oscillators which can all be used as independently as you wish. They can be split up into different groups or ran all together.
When in separate groups they should not be able to sell eachothers positions without triggering a full stop loss by turning the Independence/Stop All switches on. Every single oscillator has its own entry and exit position sizing which can be stated as either a percent of balance or a flat amount of contracts (or both combined). Each oscillator has a minimum amount of profit you can tell it to sell it, which is calculated from the average cost of your current position, which does include all groups. This works out to help you average out better entry and exit prices, essentially a method of DCAing.
You can set the minimum sale amount, which is to keep it from placing orders below your exchanges minimum dollar trade cost.
All this functionality combined also ensures more accurate back tests by ensuring that the script simply cannot spend money it doesn't see as in the balance, whereas other scripts will use a percentage of equity, and once 100% of your equity is in BTC for instance, it will keep buying more BTC for free and thus spoof up backtest numbers. If you look through the strategies here, many people claim to have amazing scripts and then you look into it and this is happening and skewing their numbers. These people are either very ignorant or what they made or scam artists and trolls in my opinion.
This version also includes On Bar Close switches for each oscillator. When switched on, signals are only allowed to generate on Bar Close. This helps to prevent retriggering from live signals, which when you are running this many oscillators, will become a problem! However, in most cases, you do not need to generate signals intrabar, as backtests will show, ignoring intrabar buys and sells (intrabar stop losses can still be very important though!) won't exactly keep you from high profitability strategies, but rather, allowing elements of chaos from live indicators moving up and down intrabar will, in fact, drift your actual results further and further from the backtest. You want an accurate backtest though. So choose wisely when you turn these off and you will do better.
The included oscillators are as follows:
NO MORE Chande Momentum cross – REMOVED – I was hitting PINE code limits here so I had to make choices and this one simply had to go. Begone!
Moving Average Cross
MACD cross
%B Bollinger cross
Stochastic cross + region filter
Stochastic RSI cross + region filter
SMII cross and region filter
Three RMIs
Know-Sure-Thing line-cross
Coppock Curve line-cross
TRIX line-cross
RSI of MA w/ MA cross
RSI of MA of KST w/ MA cross
RSI of MA of Coppock Curve w/ MA cross
RSI of MA of Trix w/ MA cross
So the idea is that this is essentially multiple strategies combined into one backtestable house. Balance is calculated for all position sizes in order to try to prevent false entries that plague so many scripts (IE, you set pyramiding to 2, each buy $1000, initial balance $1000, and yet it buys two orders off the bat for $2000 total and nets 400% profit because the second was considered free, happens on 90+% of scripts on Tradingview if you aren't very very careful!)
You tune each indicator and position size them so that they work together as well as you can and in doing so you are able to create a single backtest that is capable of running a bot, essentially, between multiple strategies - you can run a slower Moving Average cross, a faster SMI cross or MACD , or Bollinger that grabs big moves only, all the while having MACD trade small bonuses along the way. This way you can weight the Risk to Reward of each against eachother.
I will not try to claim this is something you can open and with no work have the best bot on the planet. This scripts intention is to take a lot of relatively common trading strategies and combine them under on roof with some risk management and the ability to weigh each against eachother.
If you are looking for a super advanced singular algorithm that tries to capture every peak and valley exactly on the dot, this is not for you. If you are looking for a tool with a high level of customizability, with a publisher who intends to update it to the best of his ability in accordance to seeking to make the best product that I personally can make for both myself and the community (because I will be using this myself of course!) that was specifically designed with the intention of performing well in spot markets by averaging low entry costs and high exit costs, this is for you! That is the exact intention here. It can certainly work with margin, but you will have to take extra care in setting your stop losses. I intend to make a version capable of going short which will be included as part of the package. It may take some work to keep all of the risk management working as well for shorts though. There will be more scripts added to the “package” as I hit the limit on this one a few times and have had to keep some ideas out already.
The current backtest shown is hand-optimized by myself for Link /USD 10min market (Binance US – shouldn't need much work to fit to other exchange markets) with multiple stop losses.

KSTKST is famouse and Trading View has KST in their indicators
but Trading View's KST can not watch pine code
so i just made this
this code is not that complex,but i hope this work will help someone

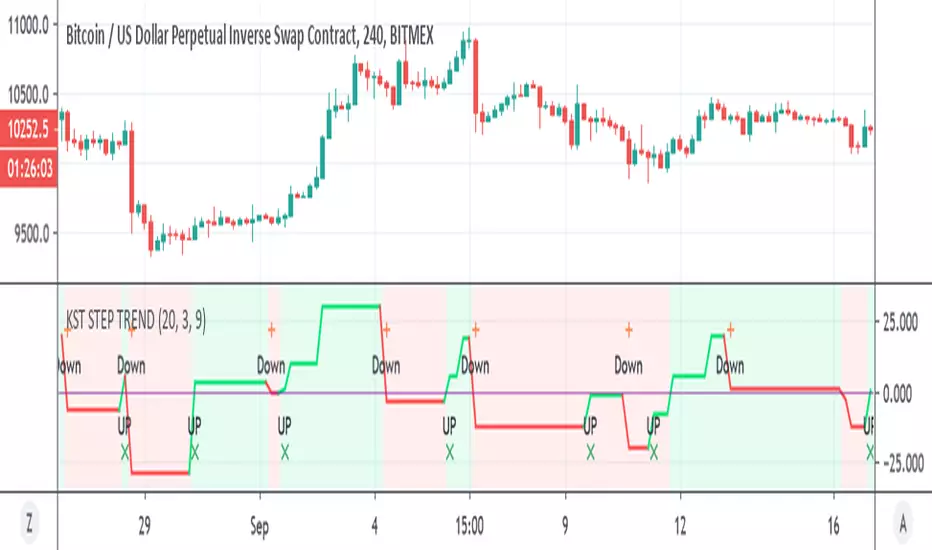
KST STEP TRENDSo here we make KST with Alex step trend
buy can be at start of up or when cross zero , sell opposite
alerts inside
Function : Know Sure Thing ! (KST)Firstly : Know Sure Thing, or KST , is a momentum oscillator developed by Martin Pring to make rate-of-change readings easier for traders to interpret. In a 1992 Stocks and Commodities article, Mr. Pring referred to the indicator as "Summed Rate of Change ( KST )," but the KST term stuck with technical analysts. The indicator is relatively common among technical analysts preferring momentum oscillators to make decisions.
References : Investopedia (www.investopedia.com )
Let's start :
Simply :
KST : Above point 0 means long position (positive zone), below point 0 (negative zone) means short position.
I liked this indicator more than RSI because we can evaluate the breaking points of the channels we draw on the indicator according to the regions.
Plus area (positive area), breaking the channel upwards may indicate a very strong rise, and minus area (negative area) the channel downwards may indicate a very strong fall.
As a person who is very keen to identify major trends in advance, I like the KST indicator to approach the target quickly and simply. I also find it very successful in terms of divergences.
CAUTION : This indicator has been written before many times on TV. I have no effort on it. I saved loads only for variable periods. But I have enough experience to say that you are successful in trends with KST . Nevertheless, do not use it alone, as other promoters may benefit.
For example , I divided the standard periods into 4 as in the script. With a correct adaptive period, it has the potential to contribute greatly to accurate moves! You can use with mutable variable periods. Abundant trend lines can be drawn on the indicator and divergences between price and indicator can be sought. Best regards!

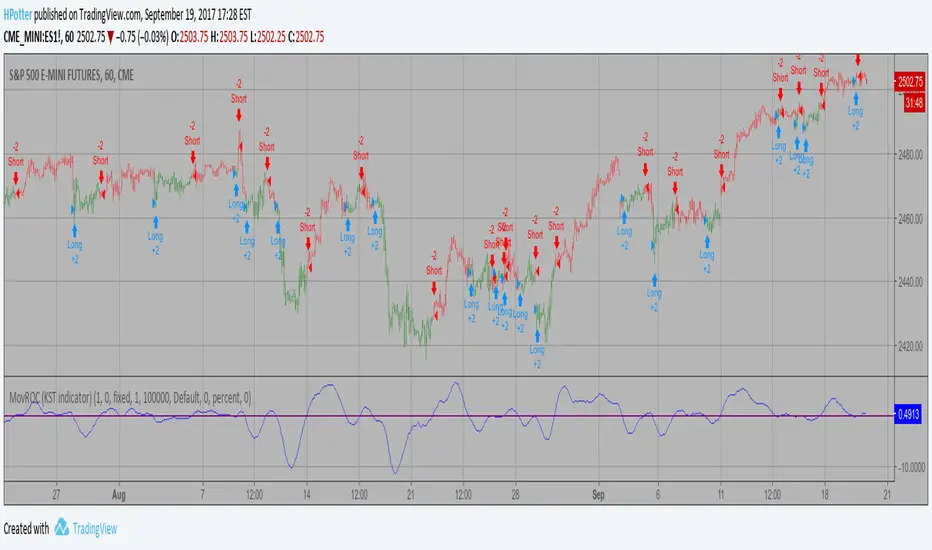
MovROC (KST indicator) Backtes This indicator really is the KST indicator presented by Martin Pring.
the KST indicator is a weighted summed rate of change oscillator that
is designed to identify meaningful turns. Various smoothed rate of change
indicators can be combined to form different measurements of cycles.
You can change long to short in the Input Settings
WARNING:
- For purpose educate only
- This script to change bars colors.
MovROC (KST indicator) This indicator really is the KST indicator presented by Martin Pring.
the KST indicator is a weighted summed rate of change oscillator that
is designed to identify meaningful turns. Various smoothed rate of change
indicators can be combined to form different measurements of cycles.
WARNING:
This script to change bars colors.

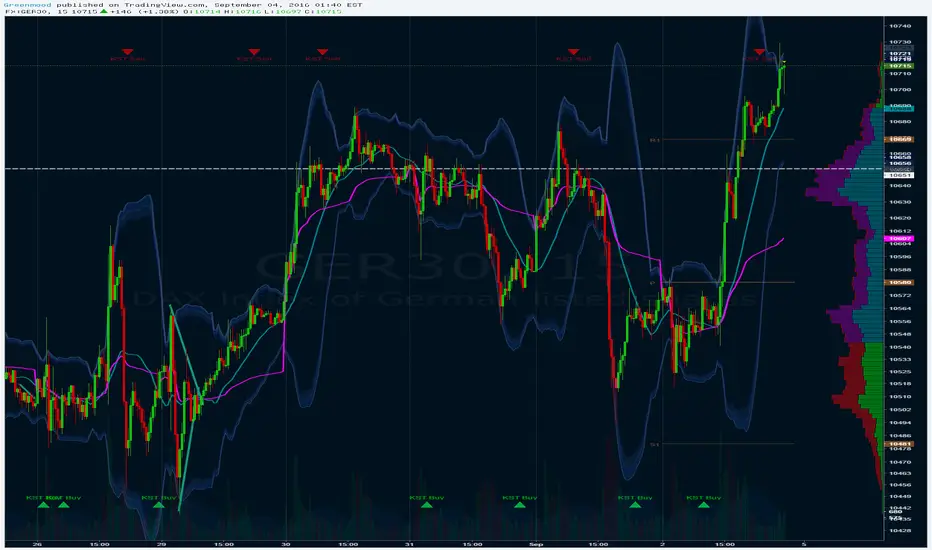
GreenMood inchart KSTThreshold min / max as well as usual KST 0.41% settings (ROCx, SMA ) can be changed in format view.
MovROC (KST indicator) This indicator really is the KST indicator presented by Martin Pring.
the KST indicator is a weighted summed rate of change oscillator that
is designed to identify meaningful turns. Various smoothed rate of change
indicators can be combined to form different measurements of cycles.
