JMA filter 2This is based on ChuckBanger Juric indicator (a modification of it)
things you need to know how to work with this one
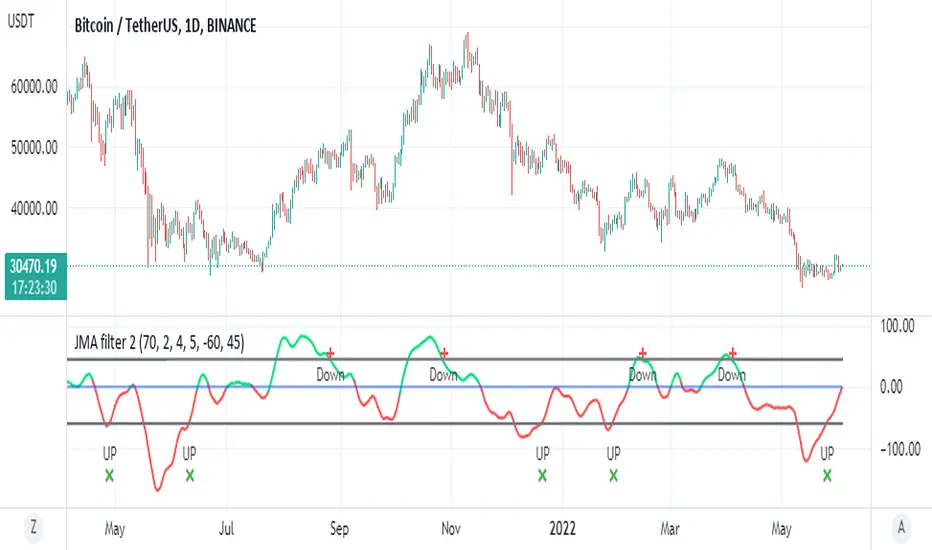
to control the wave setting you need to adjust the length , slow ,fast and c in menu for optimal result
positive trend is above zero in green
negative trend bellow zero red
the best part herein this indicator is to finding of high and low based on lower treshold =trel
higher threshold for high =treh
there is signals once it crossed up or down
for each time frame you need to set the threshold for optimal results as it change for each TF it will be different so be careful about it
so rule of thumb is to look for the previous peaks either up or down and to set the threshold according to it
it more sensitive then RSI to my opinion and very good to detect sweet spot either for sell or buy
one can add alerts (not included)
or modify it to make it better
here on Tesla
Jurikresearch
Jurik Volatility BandsVolatility is a core concept in trading and impacts our trading strategies. Therefore, all traders should have some sort of volatility indicator displayed to gauge the current volatility and future expected moves.
Jurik Volatility Bands displays the price inside a volatility channel. In this way, we can measure the current price action in accordance with its volatility.
Usage
The indicator is mainly used for scalping and intraday trading. Whenever the price touches either the upper or lower volatility band, we can consider it a volatility move. It can lead to a pullback or breakout move. However, we know that when the volatility is high, we expect more significant price moves and should prepare ourselves for it.
Disclaimer: No financial advice, only for educational/entertainment purposes.

