Aggregated Open Interest Multi-Exchange (USD)This indicator aggregates Open Interest (OI) data from multiple major cryptocurrency exchanges into a single unified view in USD, using data available on TradingView. It automatically adapts to the asset you're viewing on the chart.
Features:
Aggregates OI from 7 major exchanges: Binance, Bybit, OKX, Bitget, Deribit, HTX, and Coinbase
All values converted to USD - unlike native OI which shows contracts/coins
Uses only data available on TradingView platform
Automatically detects the asset from your chart (BTC, ETH, SOL, etc.)
True apples-to-apples comparison across exchanges
Displays as candlesticks showing OI open, high, low, and close
Toggle exchanges on/off individually
Handles different contract types per exchange automatically
Why USD conversion matters:
Traditional OI indicators show values in contracts or crypto units, making it difficult to compare across exchanges. This indicator converts everything to USD, giving you the real dollar value of open positions across all exchanges.
How it works:
Simply add the indicator to any crypto perpetual futures chart. It will automatically fetch and aggregate OI data from all supported exchanges for that asset using TradingView's built-in data feeds, converting everything to USD.
Supported Exchanges:
Binance, Bybit, Bitget, HTX: USDT perpetuals
Deribit: BTC/ETH use USD contracts, others use USDC
OKX: Contract-based (automatically converted)
Coinbase: USDC perpetuals
Perfect for traders who want a comprehensive view of total market Open Interest in USD across exchanges using reliable TradingView data.
J-USD

Currency Basket vs USD - Trend & RSI Breakdown📊 Indicator Methodology
Currency Basket vs USD – Trend & Valuation Breakdown
💱 Strategy of Rotating Between USD and the Currency Basket
💰 100% cash strategy – always ready for market crashes.
🟢 Hold USD if the trend indicator shows USD is trending.
🔵 Hold the currency basket (EUR, PLN, CZK, CHF, GBP) if the basket is trending.
✅ This way, you're always on the winning side of the trade, never risking a loss of purchasing power.
📈 Since it's a LONG ONLY, NO LEVERAGE strategy, there are no trading or holding fees, except for a small 0.15% FX fee every few months when the trending currency changes.
📈 Trend Indicator
Uses 5 different indicators working together to determine which asset is in a trend.
👀 On the chart it's visualized as:
➕ Plus symbols indicating trend strength (usually ranges from -4 to +4).
🔺 If USD has a higher trend signal than the basket → Hold USD.
🔻 If the basket has a higher signal → Hold the basket.
🕒 Signals typically last several months and operate on the 3D (3-day) timeframe, giving a high probability of catching macro moves.
💡 Valuation Indicator (Z-scored RSI)
Uses RSI with a length of 30.
Z-scored between -1 to 1.
📉 Interpretation:
-1 for USD = too strong → likely stagnation or reversal.
-1 for Basket = undervalued → likely growth or stabilization.
📊 Displayed as a separate line below the main chart.
📍 A horizontal line at 90 is added on the main chart – helping you quickly see what’s above or below this key reference level.
⚙️ How the Strategy Works in Practice
✅ You update the indicator daily (takes only seconds).
✅ The trend indicator tells you which currency to hold.
✅ The valuation indicator prepares you for possible reversals.
🔄 When the trend shifts, you rotate your full position.
⏳ Trades typically last several months.
📈 Usually generates consistent profits of 2–8%.
💪 It grows your capital while keeping you ready to buy assets during major selloffs.
🔍 Best Usage
Use it as a quick scanner to observe trend or valuation changes.
If a signal appears, validate it using additional trend and valuation indicators.
📌 If most agree, take the position.

Wick Size in USD with 10-Bar AverageWick Size in USD with 10-Bar Average
Version: 1.0
Author: QCodeTrader
🔍 Overview
This indicator converts the price wicks of your candlestick chart into USD values based on ticks, providing both raw and smoothed data via a 10-bar simple moving average. It helps traders visualize the monetary impact of price extremes, making it easier to assess volatility, potential risk, and plan appropriate stop loss levels.
⚙️ Key Features
Tick-Based Calculation:
Converts wick sizes into ticks (using a fixed tick size of 0.01, typical for stocks) and then into USD using a customizable tick value.
10-Bar Moving Average:
Smooths out the wick values over the last 10 bars, giving you a clearer view of average wick behavior.
Bullish/Bearish Visual Cues:
The chart background automatically highlights bullish candles in green and bearish candles in red for quick visual assessment.
Stop Loss Optimization:
The indicator highlights long wick sizes, which can help you set more accurate stop loss levels. Even when the price moves in your favor, long wicks may indicate potential reversals—allowing you to account for this risk when planning your stop losses.
User-Friendly Customization:
Easily adjust the USD value per tick through the settings to tailor the indicator to your specific instrument.
📊 How It Works
Wick Calculation:
The indicator calculates the upper and lower wicks by measuring the distance between the candle’s high/low and its body (open/close).
Conversion to Ticks & USD:
These wick sizes are first converted from price points to ticks (dividing by a fixed tick size of 0.01) and then multiplied by the user-defined tick value to convert the measurement into USD.
Smoothing Data:
A 10-bar simple moving average is computed for both the upper and lower wick values, providing smoothed data that helps identify trends and deviations.
Visual Representation:
Columns display the raw wick sizes in USD.
Lines indicate the 10-bar moving averages.
Background Color shifts between green (bullish) and red (bearish) based on candle type.
⚡ How to Use
Add the Indicator:
Apply it to your chart to begin visualizing wick sizes in monetary terms.
Customize Settings:
Adjust the Tick Value in USD in the settings to match your instrument’s tick value.
(Note: The tick size is fixed at 0.01, which is standard for many stocks.)
Optimize Your Stop Loss:
Analyze the raw and averaged wick values to understand volatility. Long wicks—even when the price moves in your favor—may indicate potential reversals. This insight can help you set more accurate stop loss levels to protect your gains.
Analyze:
Use the indicator’s data to gauge market volatility and assess the significance of price movements, aiding in more informed trading decisions.
This indicator is perfect for traders looking to understand the impact of extreme price movements in monetary terms, optimize stop loss levels, and effectively manage risk across stocks and other instruments with similar tick structures.

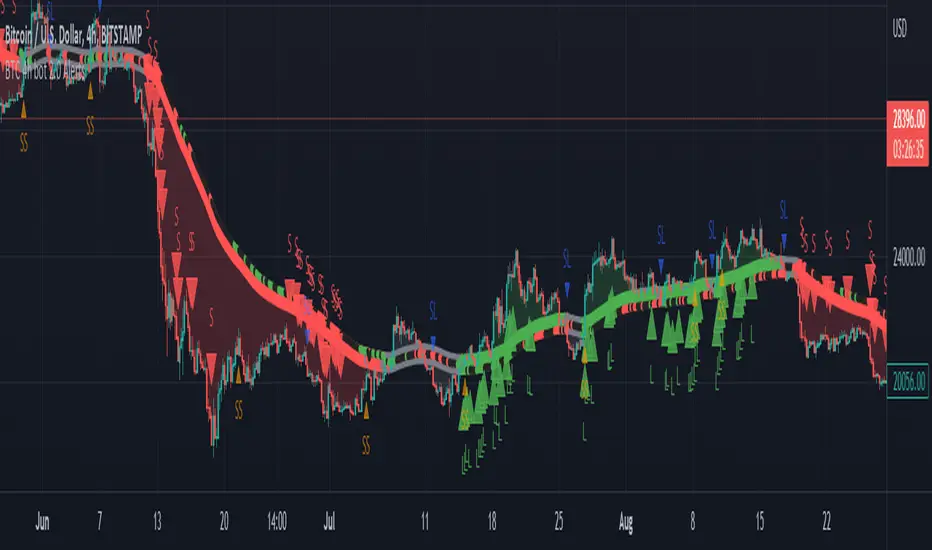
BTC 4h bot 2.0 AlertsThis is Alert version of BTC 4h bot 2.0.
Optimized for pairs BTC vs stablecoins, 4h timeframe.
HOW IT WORKS:
Script is based on the fact that there are certain phases of the market when there is a greater probability that BTC will go to one side or the other. To evaluate which phase we are in, the script uses "Main trend" and "Confirmation signals".
Main trend
- Is composed of a combination of several supertrends and moving averages. A Supertrend is a trend following indicator that helps in identifying whether we are in an uptrend or a downtrend. A higher factor is used to capture the main trend and not just small movements. In case the market goes sideways, the Supertrend does not work well, so it is a combination of multiple supertrends along with moving averages to differentiate a real strong trend from a range.
- It can be seen on the graph as a thick solid line.
- In an uptrend is green, in a downtrend red, gray represents the neutral zone.
Confirmation signals
- Are several script-evaluated indicators such as RSI , MACD , ADX and others, which serve to confirm the trend. In this case, it is the opposite way to the Main trend. Confirmation signals are used here to detect small movements. They are trying to capture bullish and bearish price momentum.
- On the graph they are seen as dashed lines above or below the Main trend (in the gray zone they are in the middle).
- It indicates only two signals, green for buy and red for sell.
HOW TO USE IT:
if the Main trend and Confirmation signals are of the same color, it will send a buy or sell signal, depending on which phase of the trend it is in. If the Main trend is e.g. in an uptrend and the market is going up, Confirmation signals should generate a lot of signals. But if the market starts to go in the opposite direction, Confirmation signals should generate fewer signals or none at all, thus reducing the number of wrong trades. In the gray zone of the Main trend it does not open positions.
To close position is possible to use stop loss and take profit or alternative could be to set very high TP value, thereby letting the script close the positions by itself by Stop Long or Stop Short.
The recommended setting is:
TP: 3.9%
SL: 4.7%.
In this case, it is a Alert version, where can be seen all the signals, which the script generates.
Green triangels indicate open Long.
Red triangels indicate open Short.
Small blue triangels indicate Stop Long position.
Small orange triangels indicate Stop Short position.
Signal is valid after bar is closed, so do not open a position before.
Script works well on Bitstamp, but also other exchanges with pair BTC/USD or BTC/stablecoins.
The script works consistently well over a long period of time, using past probabilities, but this does not guarantee future results.
USD Liquidity IndexThis USD Liquidity Index composed of 2 parts, total assets and major liabilities of the Federal Reserve .
There is a certain positive correlation between USD liquidity and risk asset price changes in history.
Suggested that USD Liquidity is mostly determined by the Federal Reserve balance (without leveraged), this index deducts three major liabilities from the total assets (in green color line) of the Federal Reserve . They are the currency in circulation (WCURCIR) in gold color, the Treasury General Account (WTREGEN) in blue color, the Reverse Repo (RRPONTSYD) in red color.
The grey line is the calculation result of the USD Liquidity Index. With it goes up, liquidity increases, vice versa.

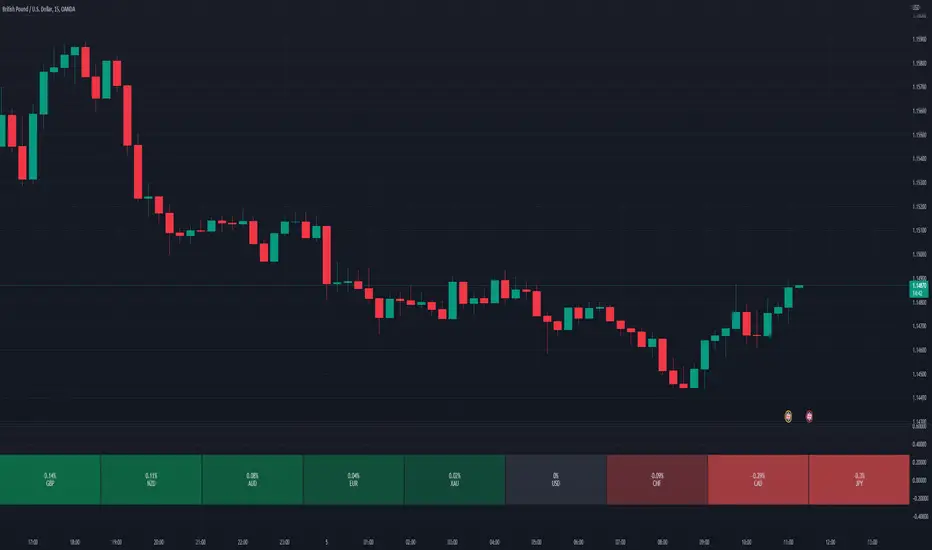
Relative Perfomance IndexHello Traders.
Lets keep it simple..
1. Take the major pairs that have USD in them and watch their change over a specific timeframe.
2. Now lets sort these changes of each pair from the most positive to the most negative.
Good, I see you have some ideas already.
This is exactly what this indicator does. You will visualize the biggest change in pairs of the timeframe of your choice and from this you can decide on pairs that you want to trade.
Macro EMA Correlation
This script is useful to see correlation between macroeconomic assets, displayed in different ema line shown in percentage to compare these assets on the same basis. Percentage will depend on the time frame selection. In the higher timeframe you will see higher variation and in small timeframe smaller variation.
You can select the timeframe who suit your trading style. The 1h and 4h fit well for longer trend swing trade and the lower time frame 15m, 5m, 1m are good for scalping or daily trading.
The following asset are available:
Bitcoin
Ethereum
Gold
Crypto total market cap excluding bitcoin (total2)
United state 10-year government bond (US10Y)
Usdt dominance show the concentration of usdt hold. For example, when trader are fearful they sell their crypto position to keep more usdt in their portfolio (USDT.D)
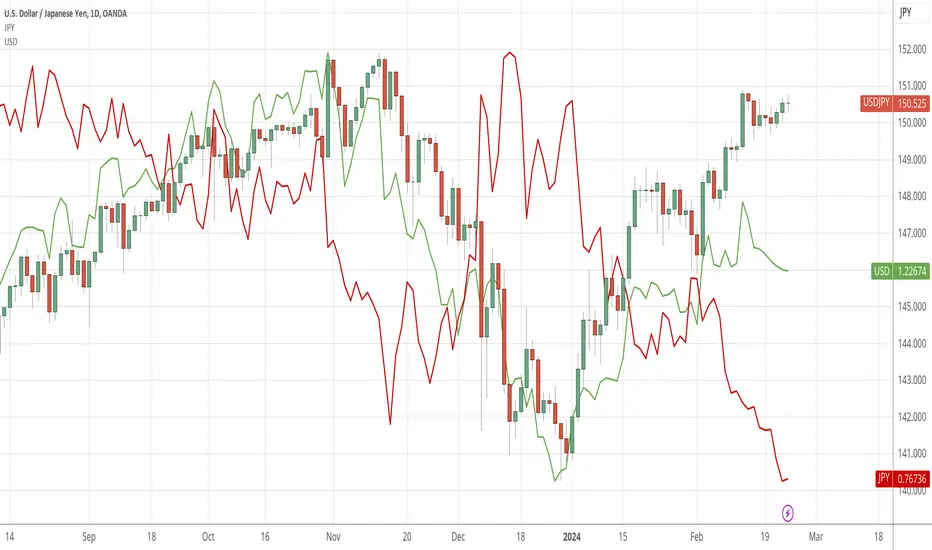
The USD/JPY pair the dollar usd versus the Japanese Yen one of the most forex traded pair.
You can clic on parameter to select the asset you want to analyse.
The main correlation observed are:
bitcoin negatively correlated with the usdt dominance.
bitcoin negatively correlated with the usd/jpy pair
bitcoin is positively correlated to eth, total2 (altcoin)
bitcoin positively correlated with gold
bitcoin is mostly negatively correlated to us10y
The basis of correlation is that positively correlated asset goes in the same direction and that the negatively correlated goes in opposite direction.
So, the idea is to use these information to see trend reversing.
Example 1: when bitcoin and usdt dominance are extended in opposite direction we look for a possible retracement toward 1% wich is the middle base.
Example 2 : when bitcoin make a move we look for ethereum and total 2 to follow

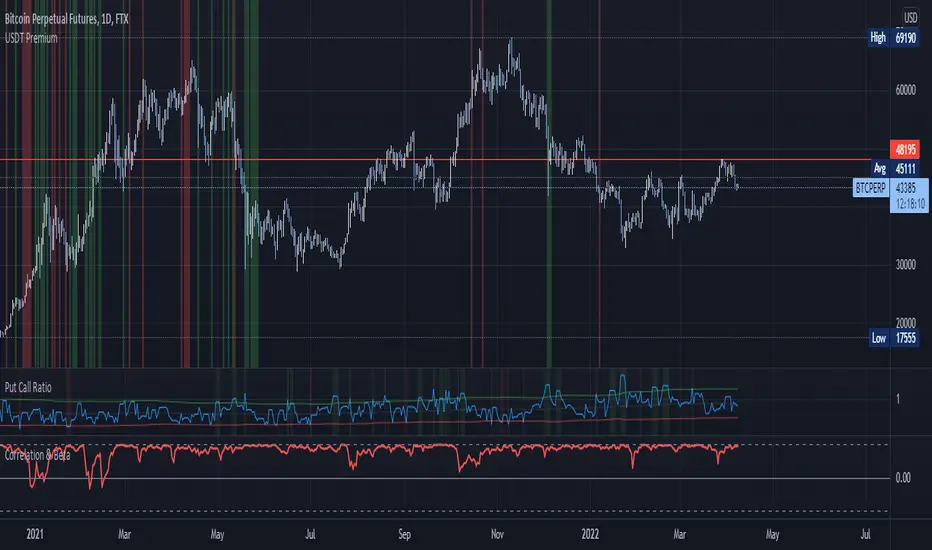
USDT/USD PremiumKraken + FTX USDT premium indicator.
Inspired by John J Brown, forked from IAmSatoshi (Migrated to V5 and few changes + more markets coming).
John J Brown: "
USDt premium/discount exist because of conversion fees.
It is a good market indicator:
If USDt>USD, then market is growing and in need of liquidity;
If USDt

Intraday FOREX london scalperThis forex System is only for ECN Broker Account.
Pairs: Major with spread < 0.0001 (EUR/USD).
Setup:
Wait for the market to make to 60 minute from the open.
If the market is near the intraday high be prepared to go short
If the market is near an intraday low for the same time period, then be prepared to go long.
Rules for entry
For sell setups: Enter on sell stop 1 pip from low of the last 15 min bar.
For buy setups: Enter in buy stop 1 pip from high of the last 15-minute bars.
Rules for exit
Take profit: Close out positions on 6 pips profit..
Stop Loss: Close out on 5 pips loss or if trade takes more than 1 minute.

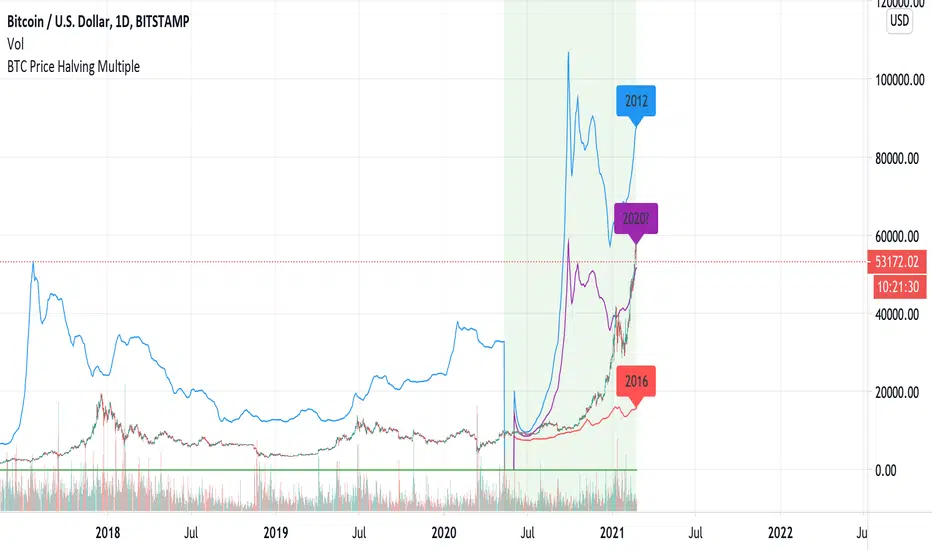
True Inflation Compensator (USD)This script will draw your underlying ticker compensating for a truer USD inflation rate based on an average between the M2 money supply increase and the government's reported CPI. It only considers the last year of inflation by default, but you can set any amount of years in the options.
This is especially relevant given the current massive printing that is going on within the US economic system. If you look at the S&P500 the market has by no means completely recovered, but due to massive printing most do not realize this by just looking at the base chart. A similar concept applies to Bitcoin. Unfortunately due to today's economic climate one must compensate for printing to get a true analysis of how investments are doing.

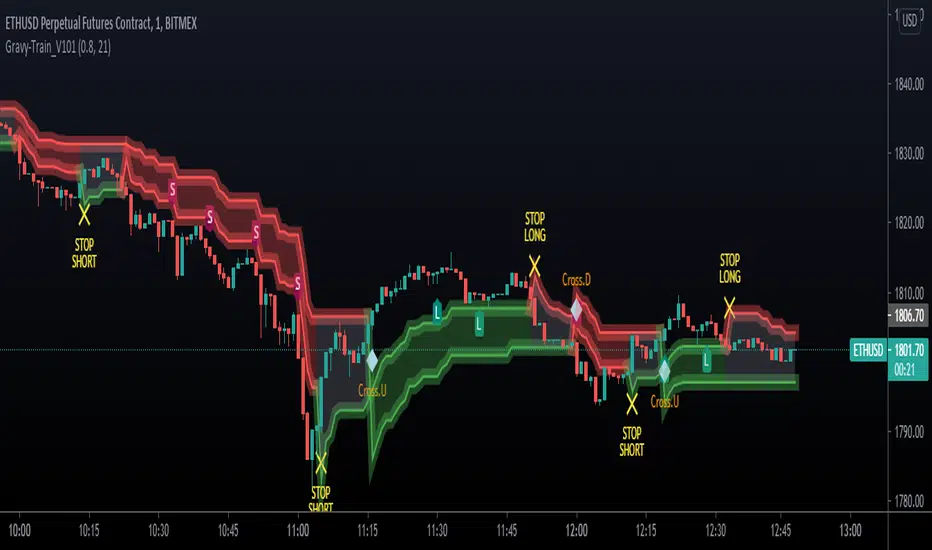
UTG - Gravy TrainThe most complex indicator we've ever developed.
Works on ALL MARKETS!
Gravy Train is a ALL IN ONE - ONE GLANCE indicator.
- It allows you to gauge trend, gives you appropriate LONG & SHORT identifiers
- It identifies when the trades should be over
- Cloud based support & resistance Zones drawn on the chart
- It keeps you OUT of the market in areas of indecision
- It works on ALL timeframes
- Takes the emotion out of trading various markets
- Gravy Train is Unity Trading Groups bread and butter for Scalping, Swing Trading, Position Trading & Day Trading
Unity Trading Group is proud to present Gravy Train!
To gain access to this script, you can find our details in our Signature, use the links below to find out!
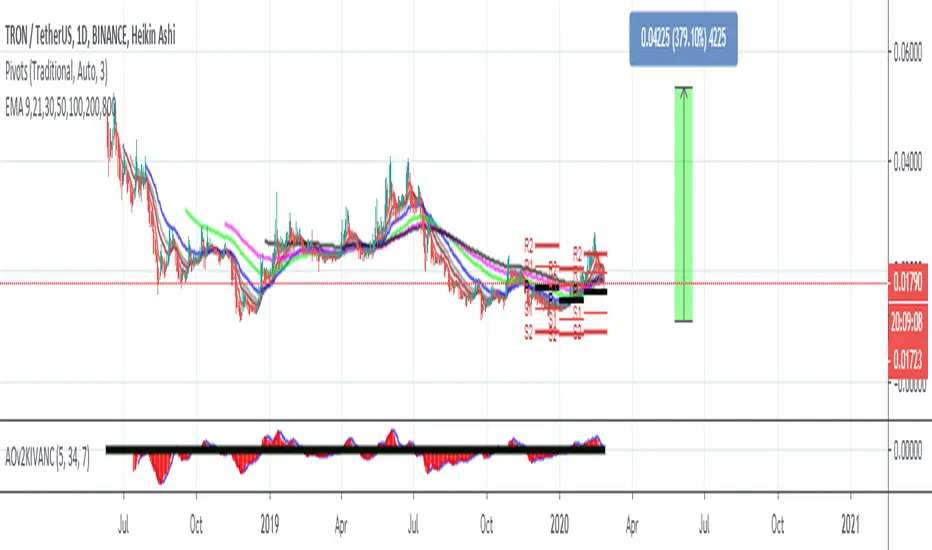
Takashi Triangular Arbitrage | 2nd Gen | [Alerts]Spot discrepancies between three currencies: these opportunities are rare and usually benefit to traders using advanced programs. You can now set up alerts and discover those for yourself.
This indicator signals opportunities for executing triangular arbitrage. Triangular arbitrage is the result of a discrepancy between three different currencies that occurs when the currency's exchange rates do not exactly match up. These opportunities are more frequent at cryptocurrency markets. The trader would exchange an amount at one rate (Currency_B/Currency_A), convert it again (Currency_C/Currency_B) and then convert it finally back to the original (Currency_C/Currency_A), and assuming low transaction costs, net a profit.
Example:
As per standard inputs, the trader would use US dollars to buy BTC (BITFINEX:BTCUSD), use BTC to buy NEO (BITFINEX:NEOBTC), use NEO to buy US dollars back (BITFINEX:NEOUSD). Whenever the quantity of US dollars bought back is higher than 1% from the initial amount, the indicator will send an alert signaling an arbitrage possibility.
Disclaimer: triangular arbitrage requires advanced automation tools and is only possible if there is enough liquidity to quickly execute all 3 trades at prices used on the indicator.
Inputs
Symbol 1
Symbol input. First step currency to initiate triangular arbitrage. (Currency_B/Currency_A)
Symbol 2
Symbol input. Second step currency to continue triangular arbitrage. (Currency_C/Currency_B)
Symbol 3
Symbol input. Final step currency to finalize triangular arbitrage. (Currency_C/Currency_A)
Discrepancy %
Float input. Amount in percent of profit return after triangular arbitrage is finished. Transaction fees not included.
To get access to this and other scripts check links below.

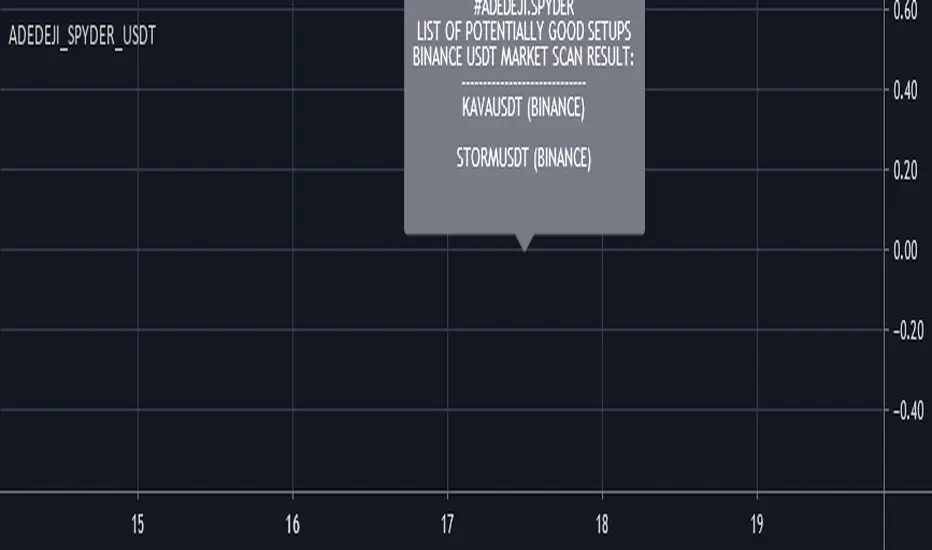
Adedeji_Spyder_USDTLike the previously published Adedeji.Spyder.v1.0 (), this indicator is a scanner; it scans only Binance USDT markets for tickers that meet certain conditions favorable for potential positive price action movements. It significantly and greatly reduces the time required for you to scan the market looking for great setups so you can focus on your entries.
It works efficiently for majority of the most commonly used time-frames (15m, 30m, 45m, 1H, 2H, 3H, 4H, 6H, 12H, 18H, 1D, 2D, 3D and 1W).
Tool is best used in conjunction with my other scripts:
1. Cynotronic Divergence tool (www.tradingview.com) or any other reliable momentum indicator
2. Adedeji_Edge (www.tradingview.com)
How to use:
Simply add the indicator to your chart, wait for the scan/search to be complete and the result displayed. Go to any of the pairs and as you normally would, time your entries by using Adedeji_Edge_v1.1
It's advised to keep a keen eye on demand and supply zones (draw relevant SUP, RES as well as dynamic trendlines on the charts) as targets and take profit zones. The suggested divergence tool gives reliable indication of areas where there is strength or weakness.
This tool scans only 40 tokens/coins on Binance USDT market. The list is not automatically generated; it will be updated regularly.
Development/improvement is a continuous thing!
Disclaimer:
Past performance does not guarantee future results. This tool/indicator is for educational purposes. As always you should fully understand there are high risks involved when trading cryptocurrencies and other digital instruments.
[astropark] Bullish Bearish Divergences for all OscillatorsDear Followers,
today a new great Scalper Tool , which works excellent on all timeframes and charts , both FOREX and Cryptocurrencies!
It alerts you when a new divergence has been spotted on the chart based on your preferred oscillator or set of oscillators ( yes, you can combine them! )
Here the list of currently supported oscillators (more in the future):
RSI (Relative Strength Index)
MACD
MACD Histogram
Stochastic
Stochastic RSI
CCI (Commodity Channel Index)
Momentum
Volume Oscillator
OBV (On Balance Volume)
VWmacd
Bollinger Bands %B
William %R
Chaikin Money Flow
Chaikin Oscillator
AO (Awesome Oscillator)
DPO (Detrended Price Oscillator)
Ultimate Oscillator
RVI (Relative Volatility Index)
Klinger Oscillator
This script will let you set all notifications you may need in order to be alerted on each triggered divergence (both regular and hidden).
This script:
works on all timeframes , starting from 1 minute: so you can enjoy high-frequency trading by using a 24/7 running bot and a proper money and risk management strategy if you like
shows you both bullish and bearish divergences, both regular and hidden , with a triangle up or down respectively
lets you activate more than one oscillator at the same time
lets you choose to be alerted only if all active oscillators agree on spotted divergence , so you will get only stronger and more secure ones (you can set both all or at least a configurable number of enabled oscillators)
lets you edit basic configuration settings of each oscillator
lets you disable or enable hidden divergences on chart
This is a premium indicator , so send me a private message in order to get access to this script.

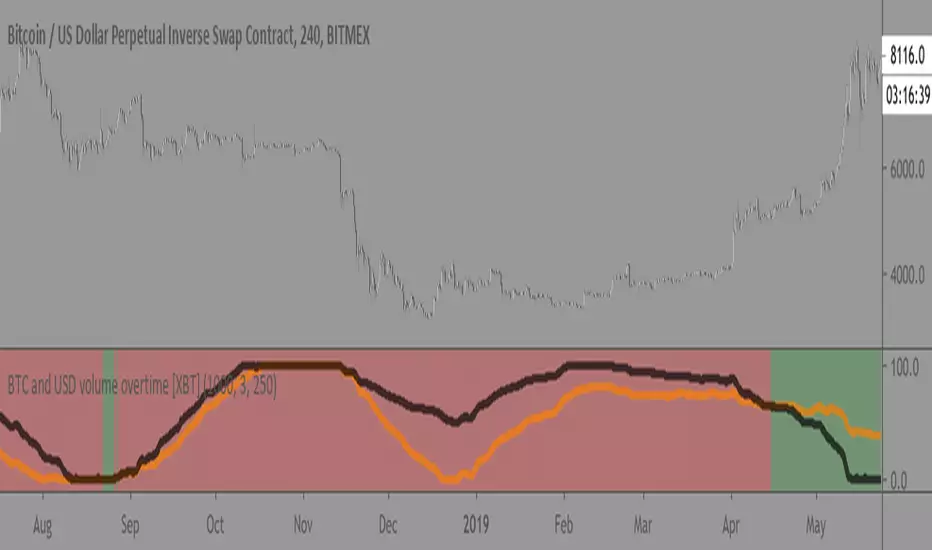
BTC and USD volume overtime [XBT]Compares BTC volume vs USD volume overtime
Best used on 4hr timeframe. Not really some crazy alpha but good overview/statistic to keep track of.
(make sure to use on XBTUSD pair since it isnt using security calls to call the data)
Enjoy!
USD Relative Strength Comparison (RSC)Simple indicator implementing relative strength against the equally weighted basket of major currencies. Perhaps I will coin it the Equally Weighted Index (EWI) and trademark it like ICE did with DXY.
usd = (usdjpy/100 + usdcad + 1/gbpusd + 1/eurusd + usdchf + 1/audusd + 1/nzdusd)/7
DXY is hard to compare against other indices because of it's weightening. Secondly it does not compare against all majors and includes SEK which is not a major currency. Source: Wikipedia .
In this chart it becomes more clear why GU is in an uptrend. From April 25th USD has been consolidating against the basket of majors while GBP has gained in strength against the same basket.
gbp = (gbpusd + gbpjpy/100 + gbpcad + 1/eurgbp + gbpchf + gbpaud + gbpnzd)/7
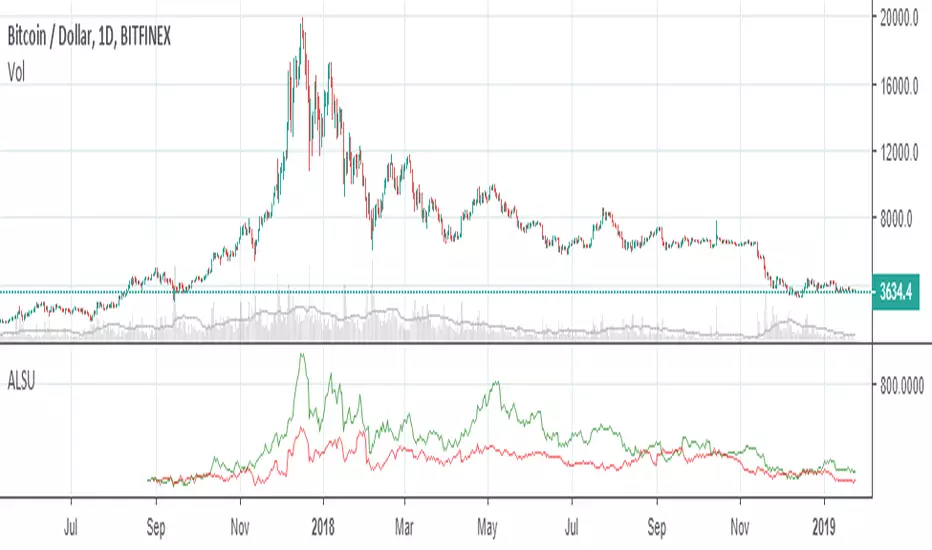
ETHUSDSHORTS+ETHUSDLONGS - Bitfinex ETH Shorts & Longs & TotalBitfinex ETH Shorts & Longs & Total
There is "Shorts" & "Longs" & "Shorts + Longs" & "Shorts - Longs"

BTC Aggregate USD Volumeaggregated USD volume of BTC from Bittrex, Poloniex, OkCoin, Gemini, Binance, Bitstamp, Kraken, Bitfinex, Bitmex (leveraged), and Coinbase

All Longs Shorts USDSummary longs, shorts of cryptos ( BTC ETH EOS XRP LTC XMR) in millions USD on Bitfinex.