ATR+VWAP Alert//These signals mostly consist of crossovers between a 13 VWMA and a 62 VWMA. I've found these two moving averages to be quite special in their ability to
//recognize a quick trend using volume data. The VWAP is used in the alert system as well, to give some perspective on which direction we are looking to take. We
//are also using ATR. We only take trades when the ATR is on the move, meaning we have a chance to catch a volatile move! Finally, we use RSI to help weed out bad
//trades. We only take 'longs' with bullish readings from RSI, and we only take 'shorts' with bearish readings from RSI. These alerts are fantastic for catching quick intraday
//trades in either direction. I recommend using a small 'take profit' target rather than using an exit indicator. These trades can move 20-30 pips and reverse just as quickly. Good luck!
//How To Use:
//When the alert system is added to the chart, you will notice up/down symbols appear at various locations. For bullish alerts, right click an 'Up' symbol and choose 'Add Alert on VWap & ATR..'
//There are two condition options. 'Long/short', and right below that 'Buy-Signal/Sell-Signal'. Choose 'long' and 'Buy-Signal'. At options, choose 'Once Per Bar Close'. Design your alert, and you're good to go.
//For bearish signals, find a 'down' signal on the chart. Right click and follow the same process, except choosing 'short/Sell-Signal' conditions.
Tips:
Use VWAP as a stop-loss. If a candle closes below/above the VWAP in the direction against you.. get out of the trade. The losses will be minimal and few compared to the wins. Use discretion and trade carefully. This works great with crypto. Invent your own exit. If you come up with a clever exit, please share!
You can contact me at my Discord!
discord.gg
Intraday

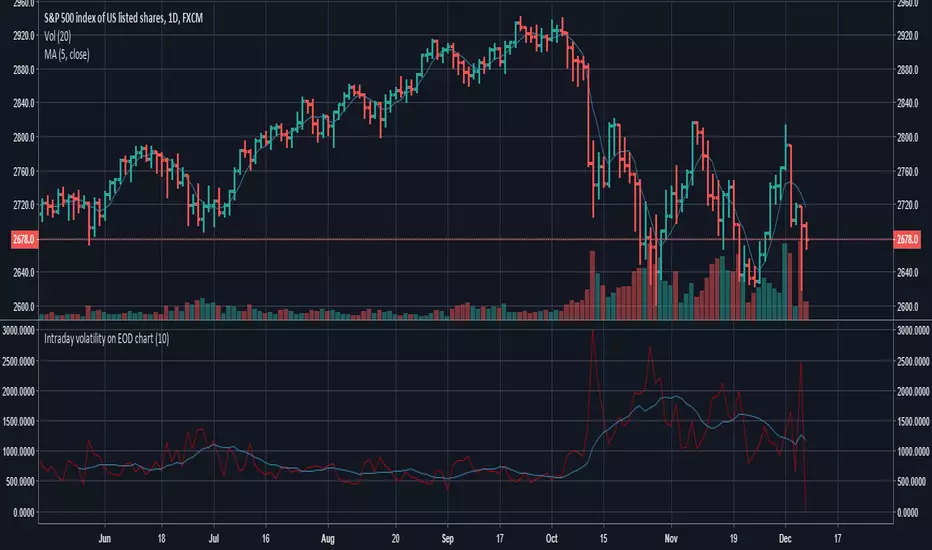
Intraday volatility on EOD chartThis indicator will allow you to compare Daily bars with Intraday insight.
Indicator draws the sum of high-low intraday bars on EOD timeframe.
The purpose is to compare TR or ATR with intraday data, because high-low on 1 daily bar says little about intraday bars inside.
You can replace the function (cum(high - low)) with whatever you need to calculate on intraday bars.
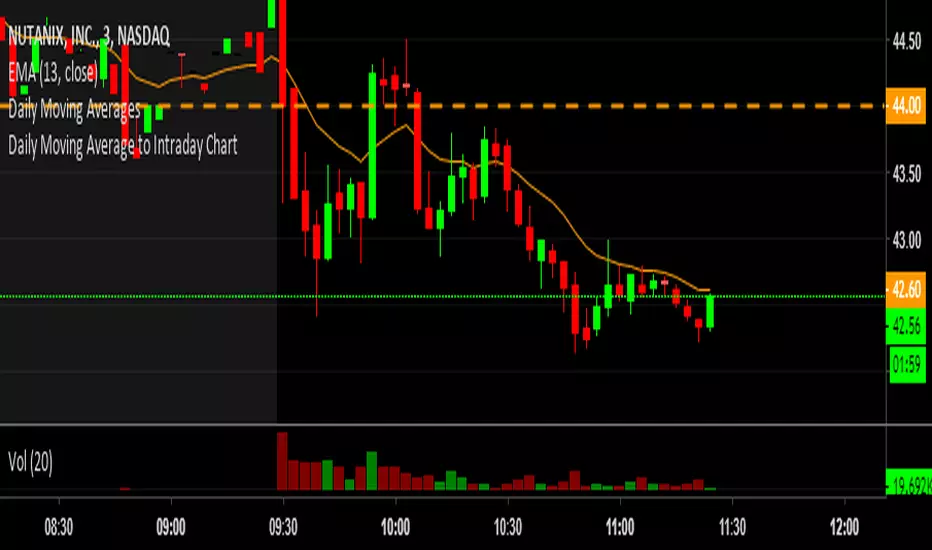
Daily Moving Average to Intraday ChartThis is going to include the 20EMA, 100SMA and 200SMA automatically into your intraday charts.
BullTrading Intraday StopHunt Indicator Phycologically traders tend to sell on lows and buy on highs. BullTrading Intraday StopHunt Indicator is designed to help you avoid such situations by monitoring the market for intraday trading setups.
The indicator plots a "Fractal Envelope © " containing the most significant Support and Resistance levels for analysis and entry level selection.
Trend filtering is provided by a MTF P-SAR (SAR will avoid repainting false signals).
The BullTrading Chaos Trend Wave is used instead the Alligator to trade fractals.
BullTrading Intraday StopHunt Indicator will provide 3 types of signals:
First one is a swing/intraday signal, it will alert you when the price is located at a very sensitive level (buy or sell) filtered by trend. If you check the indicator after the close of the day you can even know this exact level in advance (plot Red or Lime color).
Second signal will alert you the Chaos Trend Wave Moving Average Crossovers filtered by price position (related to the Fractal Envelope) and mayor trend.
Third signal is a scalping signal, it will alert you all the fractal breakouts filtered by price position (related to the Fractal Envelope) and mayor trend.
You will be amazed the huge amount of trade opportunities for a given week trading only one financial instrument.
Obviously the indicator is not perfect and will plot few false signals on mayor trend reversals or big price manipulations. AVOID THE TRAP BY WAITING THE PRICE USING BUY LIMIT AND SELL LIMIT ORDERS.
NOTE: This indicator works on any timeframe, but standard settings are calibrated for 15' charts.

ADR - Average Daily Range [@treypeng] [v2]
This is an intraday indicator.
Average Daily Range provides an upper and lower level around the daily open. It is calculated by taking an EMA/SMA average of a given number of previous days' True Range.
It can be useful for helping guide support and resistance, for taking profits and for placing stops.
It's a similar idea to the ATR indicator, but calculated on a daily timeframe only.
Settings:
Length: number of days to take an average from
Offset: Set this to 0 to include today's range. Set to 1 to exclude today. Set to 2 to exclude today and yesterday.....and so on.
The other settings should be self explanatory :)

Hull MA +- ATR by shoxi Added HMA-ATR and HMA+ATR to make easier taking profits and placing stop losses in intraday trading.

TH ORB | Buy & Sell Levels Based on ORBTradersHunt's ORB Indicator is designed for Intraday Trading for Indian Market but it can also be used for Global Markets and Commodities . It is based on Support & Resistance Levels based on Opening Range Technique. User can select different ORB ranges like 1min, 10min, 15/30/45min, 1/2/3 HOUR etc.
The details are as follows;
Orange line is Trendsetter which means price closing above or below it will take the instrument in that direction. Green Level indicates strong buy price, and Orange level can be used as SL if trader is taking long position. Basically, a trader can use these levels as best Support and Resistance levels based on the ORB selected.
visit our website www.tradershunt.com for more information.

Daily SMA x2 With InputsIdeal for Intraday charts when you want to know the daily SMAs or for daily charts if you want to save on an indicator

RSI OverlayThe RSI Overlay indicator is a great way to find entries into shorter, intraday market movements. Best when used with a volatility or trend type filter.

AP13Indicator “AP13”
Class : oscillator
Trading type : intraday
Time frame : 5 min – 15 min
Purpose : search for reverse points
Level of aggressiveness : aggressive
Indicator «AP13» is based on the Fractal Market Hypothesis. According to this hypothesis each price movement can be represented in form of a set of self-similar structures – fractals. To identify fractals in this indicator elements of Bill Williams’s trading system are used (see “Trading Chaos” by Bill Williams for details). They allow identifying local bottom and local top of the price movement.
Accordingly, when you know that price has reached the bottom (or top), you have enough information to build a trading strategy based on these signals: buy from the bottom and sell from the top. The novelty of this indicator is filtration of the fractals: only those ones which are in the current trend direction are displayed. As the result the quality of the signals from the indicator «AP13» is much higher comparing with classical fractal analogues.
Structure of the indicator
Indicator consists of the following elements:
- Triangles with titles – blue ones with “BUY” title and red ones with “SELL” title to indicate according trading signals;
- Red lines – stop-loss lines – lower line for the “buy” trades, upper line for the “sell” trades;
- Lime and orange lines – trend lines used to identify the current tendencies.
Input parameters of the indicator
To set up the indicator a number of input parameters are used:
- Averaging Period – regulates the level of aggressiveness of the indicator – the less the parameter is more signals are generated;
- Stop multiplier – this parameter is used to detect stop-loss values. The higher the parameter is the bigger the stops are.
Rules of trading
Signal for “buy” is generated when a blue triangle with title “BUY” appears on the chart. Signal for “sell” is generated when a red triangle with title “SELL” appears on the chart.
For short (“sell”) positions stop-loss should be set above the upper red line. For long (“buy”) positions stop-loss should be set below the lower red line.
Take-profit is set near the previous fractal or position is closed when the opposite signal appears on the chart. One more possible option is to close position after certain period of time (for example a few candles after its opening).

NMA indicatorIndicator “NMA”
Class : oscillator/trend deviations
Trading type : intraday
Time frame : 5 min – 60 min
Purpose : search for divergences
Level of aggressiveness : standard
Indicator «NMA» is used to determine the divergence points between current prices and their fair (theoretical, calculated) values. Presence of strong divergence is a signal that prices have entered overbought/oversold zone. This, in turn, is a basis for position opening opposite to the current price dynamics.
Structure of the indicator
Indicator consists of colored lines and signal triangles, displayed on the chart.
- green line – shows current fair price. When current price is close to this line it means that there are no any significant divergences in the price dynamics. The green line is also a take-profit line – at this price positions should be closed;
- blue line – shows synthetic support level (analogue of the oversold zone), which is changing dynamically. From blue line “buy” trades are recommended;
- red line – shows synthetic resistance level (analogue of the overbought zone), which is changing dynamically. From red line “sell” trades are recommended;
To ease the trading process indicator displays on the chart “buy” and “sell” signals in form of blue/red triangles.
Input parameters of the indicator
To set up the indicator a number of input parameters are used:
- AR period (period of indicator, by default = 21) – is used to calculate fair (theoretical) prices based on linier auto regression model.
- Number of deviations (the number of standard deviations, by default = 1.5) – this parameter regulates the level of aggressiveness of the indicator. The bigger the parameter is the less signals are generated, but higher the quality if these signals is.
Rules of trading
Indicator can be used on the any time frame. For the intraday purposes periods from 5 min to 1 hour are recommended.
The general rules are as follows:
- if price crosses the blue line up-down – this is a signal that current price has fallen too much relatively its theoretical value (analogue of the oversold zone);
- if price crosses the red line down-up – this is a signal that current price has risen too much relatively its theoretical value (analogue of the overbought zone);
- “buy” from the blue line. For additional indication blue triangle is displayed on the chart;
- “sell” from the red line. For additional indication red triangle is displayed on the chart;
- take-profits are set near the green line
- stop-losses are not provided. Positions are closed after the opposite signal appears.

KenjiKenji
Class : average analysis
Trading type : intraday
Time frame : 4H
Purpose : work in trend
Level of aggressiveness : standard
Indicator «Kenji» is a brand new look on the average analysis. The main problem of most of the trading strategies and indicators based on average analysis is a number of false signals in case of flat (for example frequent crossing of the averages, frequent changes of the average direction etc). As the result average analysis can’t show its real power and effectiveness.
Indicator «Kenji» using a unique algorithm allows avoiding the most common traps of the average analysis and significantly increasing the quality of the signals.
It generates signals for the comfort trading in local trend. Indicator provides information both on timing of the position entry and timing on profit fixation. Also it helps to determine the level of aggressiveness of the concrete signal. This makes «Kenji» indicator a very useful tool for amateur and experienced traders.
Structure of the indicator
Indicator consists of colored zones and level lines:
- colored zones (marked blue, red or green) – used for color identification of the trading possibilities and to detect the entry points;
- level lines (marked red and blue depending on current price direction) – used for color identification of the fact that current price direction is up/down.
To ease the trading process indicator displays on the chart “buy” and “sell” signals. These signals are divided into 2 groups: standard (trading with basic lot size) and aggressive (trading with double basic lot size). Take-profit zones are also displayed on the chart. They are represented with the blue/red x-crosses. Red x-crosses show zones where profits on “sell” positions should be taken. Blue x-crosses show zones where profits on “buy” positions should be taken.
Input parameters of the indicator
To set up the indicator a number of input parameters are used:
- Slow Average Period – period of the slow average. The bigger the period is the more conservative reaction of the average for the price changes are.
- Fast Average Period - period of the fast average. The bigger the period is the more conservative reaction of the average for the price changes are.
- Correlation Period – period used in correlation analysis to calculate the level of interconnection between the averages.
Rules of trading
When signal “buy”/”sell” is appeared on the chart corresponding trade should be opened.
Profit for “sell” position should be fixed when the red x-cross appears on the chart. Profit for “buy” position should be fixed when the blue x-cross appears on the chart.

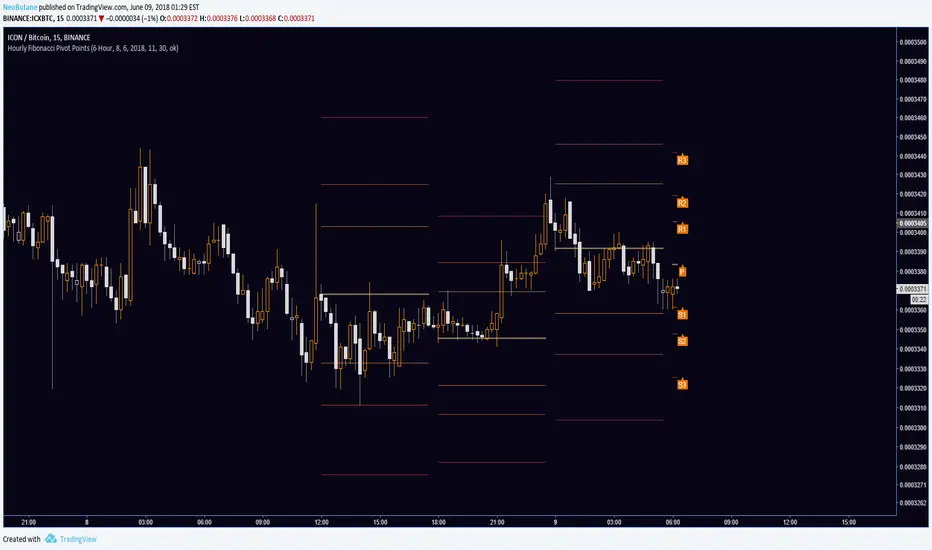
Hourly Fibonacci Pivot PointsCurrently has 1 hour and 2 hour periods available for use. There is a toggle between Fibonacci and traditional pivot points.
Line break style is used to create separate pivots on lower time frames; otherwise circles is best used to prevent confusion.
My Intraday Predictor Systems for public use - Very reliablePresenting you all with one of my favorite reliable "Predictor engine" which can be used primarily for Intraday trading.
Background:
As like many, I am one of those who trade part time and so cannot stick my self in front of charts through out the day to identify reliable intraday patterns. May be I would have gone out for a meeting/break and come back to see that I missed a great intraday opportunity in a stock. So I started working on predicting next day's candle based on previous candle. By this way, I know on the end of the day, what I am going to trade tomorrow and at what price levels. So next day morning, I can place those orders once the market opens.
But predicting next day's candle was not that easy, I analyzed various indicators and kept studying them to see, when there is a big red/green candle, does the values of those indicator form a pattern for the previous day(s). Like this I studied a lot of indicators and finalized a set of few which gave reliable patterns.
Predictor System using MACD,RSI,Fisher Transform & KST indicators:
The one that is shared here is a combo of two predictor systems that I created using the above mentioned indicators. It actually analyzes the progressive nature of MACD and RSI to see the current trend, and it uses Fisher Transform and KST indicators to finalize the signal and remove false signals. The calculations in it are very complex and was developed with a lot of analysis and of course with trial and error method as well. Generally all of my predictive engines try to correlate one indicator with other to see where it squeezes well to create a reliable indicator. Most of my intraday calls are given using this indicator as well.
How to use this indicator:
A word of caution : Please note, this indicator is not one which can give guaranteed returns or with 100% success rate, and I havent seen any thing of that sort so far, so please don't believe in those and dont be surprised if this indicator fails for a few times. I have been using this indicator for quite some time and I have seen it creates close to 80% success rate.
Chart timeframe : 1 Day time period only. I have never used this indicator with any other time frame, and based on my best guess it wont work fine for anything lesser than 1D.
Stocks with which this indicator work well : Usually with high volume stocks and preferably with F&O stocks.
How to trade : At end of the day, keep all selected stocks in a watchlist, and open a chart with 1day time period. Add this indicator to the chart. Keep scrolling through all your favorite stocks (which are in watchlist) and see if this indicator signals (for current day) any double green/red arrows. If so, note down those and the stocks close price.
Once you scanned the entire watchlist and come up with the finalized stocks for which you found the signal for current day (i.e if you look at daily chart on end of 24th May, you should look for signals on 24th May candle). Just because there is a signal, please dont go short/long on the opening of next day market, wait for it go above/below 0.25% of the previous day's close. Or based on your risk appetite you can increase threshold percentage to more.
Once the stock hits the buy/sell price, try to book profits at levels of 0.75%, 1.2% and 1.67% of the buy/sell price. But based on the market trend you can adjust these numbers.
Refer the chart for more information.
Time limited :
As of now I am keeping this script as Invite-Only script with time limit, as this has come out of my years of hardwork and with a lot of patience and took a lot of effort. So I would like to share it only with those who are really interested and are capable intraday players. So please PM and I will give access to this script to you.

AbdoulFX
Class : oscillator
Purpose : intraday
Period : 15 min
Indicator “ AbdoulFX ” is developed for intraday trading purposes. The most relevant time frame for it is 15 min. Still it can be used on other frames as well (some additional modifications may be needed).
Indicator is based on the Gaussian distribution and generates trade signals with different levels of aggressiveness. Signals with less power have the lowest trade volumes (x1). The more powerful the signals are the bigger trade volumes are proposed (x2 or x3).
Structure of Indicator
Indicator consists of three red lines and three blue lines. These lines model the high and low values of the price for the current period of time. Each line is characterized by a certain level of probability. That means that current candle high (low) will not be higher (lower) than the red (blue) line. The farthest red (blue) line has the biggest probability not to be reached and crossed.
Also in case of signal appearance special marks are displayed on the price graph.
Rules of trading
All trades should be done within current or next 15 min candle. In general the next candle means the next trade cycle.
General rules are as follows: buy near the blue line, sell near the red line. Take-profits are set to the nearest another colored line. In case of sell – the nearest blue line (in case of buy – the red one). Stop-losses are above/below the last red/blue line.
In order to ease trading this indicator generates trade signals by itself.
Buy x1 – first buy trade with basic volume;
Buy x2 - second buy trade with double volume;
Buy x3 – third (the last) buy trade with triple volume;
Sell x1 – first sell trade with basic volume;
Sell x2 - second sell trade with double volume;
Sell x3 – third (the last) sell trade with triple volume;

McGD-IntradayGuys, presenting you with one of my favorite custom wrote indicator for intraday. It works best in a 5 min chart. Please use it along with your other favorite indicators to get more reliable results. I generally use this with MA's and have got enough success in this.
Once you get a long/short signal, keep a profit of upto 1.5% and SL of 0.7%. If you see the signals reverse in the subsequent candles itself, then exit the position and go in reverse or wait for a better confirmation.
This indicator basically uses the McGinley dynamic indicator with custom calculations and optimizations to make it more fit for intraday.
Thanks, happy trading. :-)

ORB PotentialWhen indicator line shows rising trend, it means market has been good candidate for Intra-day ORB trading strategy. Indicator measures market's tendency of uni-directional moves during intra-day. Markets with rising indicator line can be used for Intra-day ORB trading in anticipation of continuing its past tendency to show intra-day unidirectional moves.

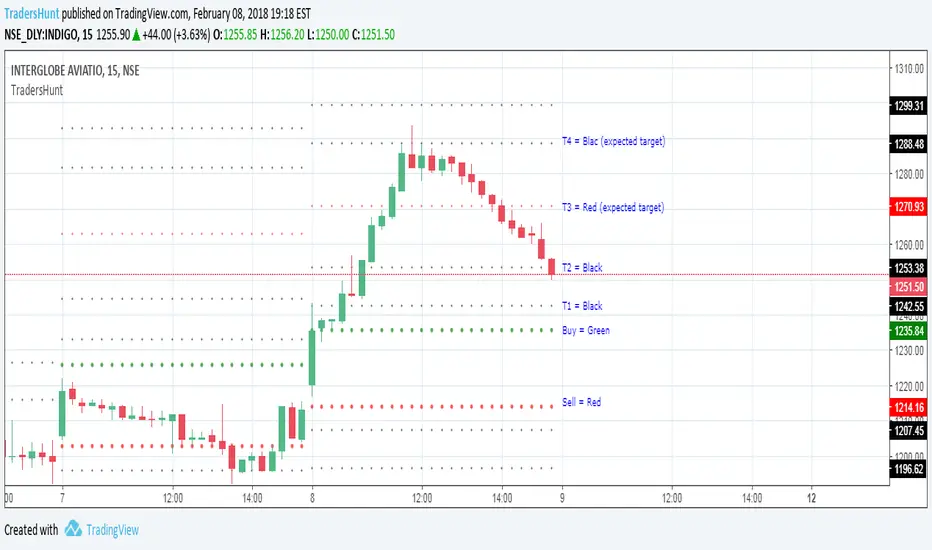
Traders Hunt Intraday LevelsTradersHunt's Buy & Sell Indicator is designed for Intraday Trading for Indian Market but it can also be used for Global Markets and Commodities . It is based on Support & Resistance Levels.
The details are as follows;
Green Level indicates buy price, a trader should wait for 15min candle to close above it and Red level can be used as SL if trader is taking long position. The Black colored levels above Green are Targets for taken Long Position. Similarly red colored level indicates Sell value and levels below it are targets for short position.

OBV Daily ResetJust a quick OBV indicator for intraday trading that resets to 0 at the start of each new session (based on dayofmonth changes). I saw someone looking for this in chat and jotted it down for him.

Intraday Momentum IndexIntraday Momentum Index indicator script. This indicator was originally developed by Tushar Chande.

TradersHunt Buy & Sell LevelsTradersHunt's Buy & Sell Indicator is designed for Intraday Trading for Indian Market but it can also be used for Global Markets and Commodities. It is based on Support & Resistance Levels.
The details are as follows;
Green Level indicates buy price, a trader should wait for 15min candle to close above it and Red level can be used as SL if trader is taking long position. The Black colored levels above Green are Targets for taken Long Position. Similarly red colored level indicates Sell value and levels below it are targets for short position.
visit our website www.tradershunt.com for more information.
[naoligo] 12x MA DT (5, 15, 30 & 60)This indicator is based on "Generic 8x MA Plotter", by @LazyBear.
It is also based on my own indicator "10x MA (H, D, W, M)", which is good for Swing Trading and/or Position.
This one is focused in daytrade and it will plot three Moving Averages based on current time interval (under 5 minutes) and nine based on chosen periods by 5, 15, 30 and 60 minutes. You will be able to see where is, for example, a 50 period's SMA of 15 minutes when using a 2 minutes time interval chart. I find it very useful to analyze, in a snap, possible price ranges and enter/exit points. All reference values are from setups known and used by daytraders.
you can choose between EMA or SMA (default: SMA) for each time interval, that are distributed in:
3x MA current time interval;
3x MA 5 minutes;
2x MA 15 minutes;
2x MA 30 minutes;
2x MA 60 minutes.
I've tried to keep the code as simple as possible, so you can increase the number of MA or modify the type for each time interval.
Cons: Use it wisely, because if you choose to plot all the 12 Moving Averages, it will may consume a lot of your navigator resources.
Enjoy!

[naoligo] 10x MA (H, D, W, M)This one is based on "Generic 8x MA Plotter" indicator, by @LazyBear.
It will plot three Moving Averages based on current time interval and seven based on chosen periods by hour, day, week and month. You will be able to see where is, for example, a 50 days SMA when using a 5 minutes time interval chart. I find it very useful to analyze, in a snap, possible price ranges and enter/exit points. All reference values are from setups known and used by traders.
Cons: Use it wisely, because if you choose to plot all the 10 Moving Averages, he will consume a lot of the computer resources.
Enjoy!!
Edit: I forgot to mention that you can choose between EMA or SMA for each time interval, that are distributed in:
2x MA Hour;
2x MA Day;
2x MA Week;
1x MA Month.
I've tried to keep the code as simple as possible, so you can increase that number or modify the Moving Average that each time interval will use.
Peace!
