Interactive Motive Wave ChecklistHere is an interactive tool that can be used for learning a bit about Elliott Waves
🎲 How it works?
The script upon load asks users to enter 6 pivots in an order. Once all 6 pivots are selected on the interactive chart, the script will calculate if the structure is a valid motive wave.
When you load the script, you will see a prompt on the chart to select points on the chart to form 6 pivots.
When you select the 6 pivots, the checklists are populated on the chart to notify users which conditions for qualifying the selection has passed and which of them are failed.
🎲 Conditions for Motive Wave
Motive wave can be either Impulse or Diagonal Wave. Diagonal wave can be either expanding or contracting diagonals. To learn more about diagonal waves, please go through this idea.
Rules for generic motive waves are as below
Pivots in order - Checks wether the pivots selected are in progressive order.
Directions in order - Checks if the pivot directions are correct - either PH, PL, PH, PL, PH, PL or PL, PH, PL, PH, PL, PH
Wave 2 never moves beyond the start of wave 1 - Wave 2 retracement is less than 100% of wave1
Wave 3 always moves beyond the end of wave 1 - Wave 3 retracement is more than 100% of wave2
Wave 3 is never the shortest one - Checks if Wave 3 is bigger than either Wave 1 or wave 5 or both.
Now, these are the specific rules for Impulse Waves on top of Motive Wave conditions
Wave 4 never moves beyond the end of Wave 1 - meaning wave 1 and wave 4 never overlap on price scale.
Wave 1, 3, 5 are all not extended. We check for retracement ratios of more than 200% to be considered as extended wave.
Below are the conditions for Diagonal Waves on top of Motive Wave conditions
Wave4 never moves beyond the start of Wave 3 - Wave 4 retracement is less than 100%
Wave 4 always ends within the price territory of Wave 1 - Unlike impulse wave, wave 4 intersects with wave 1 in case of diagonal waves. This is the major difference between impulse and diagonal wave.
Waves are progressively expanding or contracting - Wave1 > Wave3 > Wave5 and Wave2 > Wave4 to be contracting diagonal. Wave1 < Wave3 < Wave5 and Wave2 < Wave4 to be expanding diagonal wave.
Here is an example of diagonal wave projection
Here is an example of impulse wave projection
Impulsewave

Adaptive Trend (Expo)Adaptive Trend (Expo)
DESCRIPTION
This Adaptive Trend (Expo) indicator is used to detect trends as well as to adapt to the trend characteristic in order to filter-out trend noise. Having an indicator like this enables professional traders to stay longer in trends. The indicator is also equipped with upper- and lower boundaries as well as a mid-line.
Positive trend
If the two trendlines (positive & negative trendline) emerges into one single line, it’s regarded as a positive trend. If a green cloud is painted in the indicator it’s a sign that the indicator is categorizing that price move as noise, and thus the professional trader should keep their long position, or enter Long.
Negative trend
If the two trendlines (positive & negative trendline) separates and become two lines as well as a red cloud is painted in the indicator, this is regarded as a negative trend.
As a general rule, if the ‘positive & negative trendline’ is above the midline there is a positive trend. If the ‘positive & negative trendline’ is below the midline there is a negative trend.
You have the possibility to change the ‘trendvalue’, a shorter length is more sensitive than a longer length.
HOW TO USE
1. Use the indicator to identify trends.
2. Use the indicator as a trend following strategy.
INDICATOR IN ACTION
EURUSD
EURUSD
EURUSD
BTCUSD
The indicator works with RENKO, HEIKIN ASHI and with KAGI charts as well.
I hope you find this indicator useful, and please comment or contact me if you like the script or have any questions/suggestions for future improvements. Thanks!
I will continue to work on this indicator, so please share your experience and feedback with me so that I can continuously improve it. Thanks to everyone that have contacted me regarding my scripts. Your feedback is valuable for future developments!
ACCESS THE INDICATOR
• Contact me on TradingView or use the links below
-----------------
Disclaimer
Copyright by Zeiierman.
The information contained in my scripts/indicators/ideas does not constitute financial advice or a solicitation to buy or sell any securities of any type. I will not accept liability for any loss or damage, including without limitation any loss of profit, which may arise directly or indirectly from use of or reliance on such information.
All investments involve risk, and the past performance of a security, industry, sector, market, financial product, trading strategy, or individual’s trading does not guarantee future results or returns. Investors are fully responsible for any investment decisions they make. Such decisions should be based solely on an evaluation of their financial circumstances, investment objectives, risk tolerance, and liquidity needs.
My scripts/indicators/ideas are only for educational purposes!

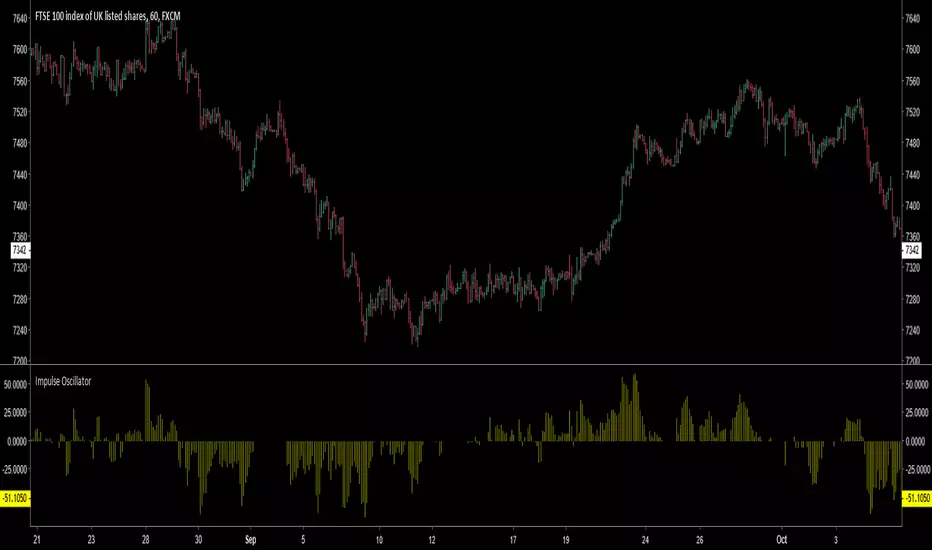
Impulse Oscillator without legs for Price Action & Elliott WavesHi Traders,
I have a newcomer for impulsetrading.
This indicator is an oscillator that show without legs impulses of Price Action .
For the expertise: you can use it for counting elliott waves !
Have fun and winning trades!