STRENGTH INDEX / Impulse SystemSTRENGTH INDEX / Impulse System Indicator
Developed by Marcelo Ulisses Sobreiro Ribeiro
This powerful TradingView indicator combines two distinct trading approaches in one versatile tool:
1. STRENGTH INDEX (Multiple EMA System)
The first section features a unique configuration of 17 exponential moving averages designed to identify market strength and trend direction. The system includes:
Core EMAs (6, 21, and 34 periods) plotted with distinct colors and weights
A dense cluster of 14 additional EMAs (7-20 periods) that create a "zone of strength"
2. Impulse System (Based on Dr. Alexander Elder's Work)
The second section implements a modified version of Dr. Alexander Elder's famous Impulse System from his classic book Trading for a Living, featuring:
Color-coded bars (green/red/blue) based on trend strength
Customizable MACD parameters (12,26,9 by default)
Optional moving average (SMA/EMA/WMA/VWMA) with adjustable periods
EMA baseline (13-period default) for trend identification
Key Features:
Switch between systems with one click
Fully customizable parameters
Clean visual presentation with adjustable line weights
Maximum 500 plotted lines for performance optimization
This indicator is ideal for traders who want to:
✔ Identify strong trends using the EMA cluster
✔ Follow the market's impulse with Elder's proven system
✔ Customize their analysis with multiple technical tools
Tip: Use the STRENGTH INDEX for trend identification and the Impulse System for entry/exit timing.
Impulsesystem
100PipsADay all in one impulse versionThis is user 100PipsADay's strategy ,third screen strategy , or triple screen strategy.
But this version uses the impulse system to determine trend (uses macd histogram and ema directions).
Remember, you must use on 1 hr timeframe in order to have the correct parameters.
Elder impulse releaseThe purpose of Impulse Release is to prevent trading in the wrong direction. While the Impulse System operates in a single timeframe, Impulse Release is based on two timeframes. It tracks both the longer and the shorter timeframes to find when the Impulse points in the same direction on both.
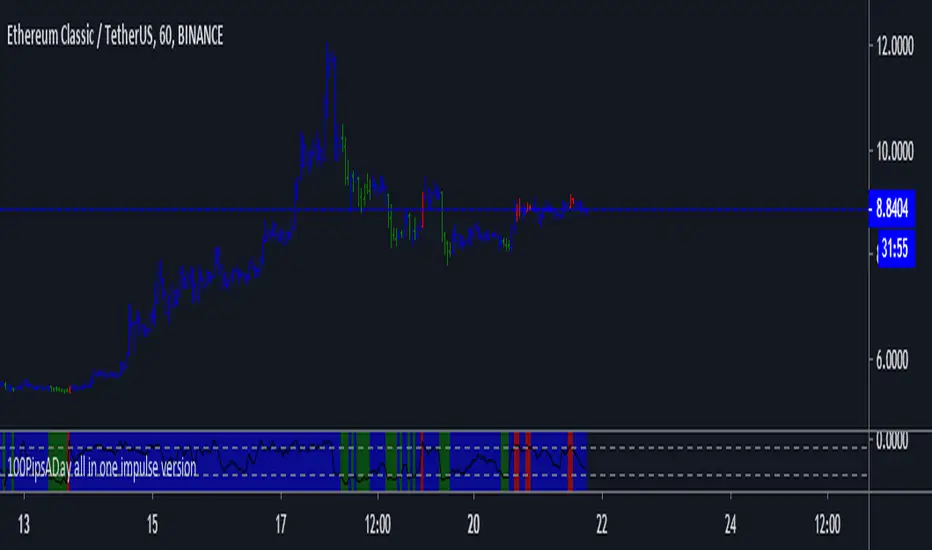
Its color bar flashes several signals:
If one timeframe is in a buy mode and the other in a sell mode, the signal is "No Trade Allowed", a red bar.
If both are neutral, then any trades are allowed, showing a blue bar.
When one is bullish while the other is either bullish or neutral, there is a green bar, allowing traders to buy and prohibiting shorting.
When one is bearish while the other is either bearish or neutral, a red bar signals that shorts are permitted, while long trades are not allowed.
Please check Dr Elders books available on amazon they are a great buy and a nice to read.