ICT - GAPs and Volume Imbalance
GAPs
Gaps are areas on chart where the price have moved sharply up or down, with no trading in between. Gaps often fill, but they don't have to.
Volume Imbalance
Volume imbalance - determined using 2 candles
Bullish Volume Imbalance - area between the close of 1st candle and the open of 2nd candle
Bearish Volume Imbalance - area between the close of 1st candle and the open of 2nd candle
How to use the indicator:-
When you find imbalance in volume or a GAP in the chart, you may expect price to rebalance it before continuation.
Importantly, GAPs/Imbalances do not always fill. Traders should never assume that a gap/imbalance will fill without understanding the reasons for the gap and monitoring trading activity around the gap.
Pair it with your current bias for better results.
Imbalance

Automatic Order Block + Imbalance by D. BrigagliaThis script combines automatic orderblock and imbalance tracking.
Bullish OB - Blue
Bullish Imbalance - Green
Bearish OB - Red
Bearish Imbalance - Orange
Please note that the actual definitions of orderblock and imbalance are not respected in this script for the sake of simplicity. Scripts that are too complex may overfit some particular chart. Since there is no way to translate the actual ob and imb definitions into pinescript language, I decided to keep it simple.
Ideally, you want to see a bullish OB followed by buy side imbalance, or viceversa. OBs that are broken weakly are generally invalidated, ones that are broken strongly generally become breakers, and you can use them as good support/resistance levels.
Also, a good thing you can do when an OB and an imbalance match, is going in the lower timeframes and catching the structure reversal in the OB or imbalance zone. That may provide excellent RR trades. Always trade with OB that confirm the HTF trend.
Nothing in my content on tradingview is considerable investment advice.

Mark FVGsMark FVGs is marking FVG (stands for Fair Value Gap, other name is Imbalance or IMB) on your chart so that you can instantly detect them
It supports:
- marking bullish and bearish partly filled or unfilled FVGs of the current timeframe
- marking bullish and bearish already filled FVGs of the current timeframe
- marking bullish and bearish FVGs of the any 4 timeframes on your current timeframe
technically it re-builds them on the last bar or as soon as new realtime bar is updated. it looks with 1k bars back to find the nearest specific number of FGVs
Adjustments:
- changing the maximum number of FVGs to display.
- changing the color of FVG area
- displaying already filled FVG of the current time frame
- changing the mode of displaying area it can either extended or fixed width
- displaying labels of other time frame FVGs

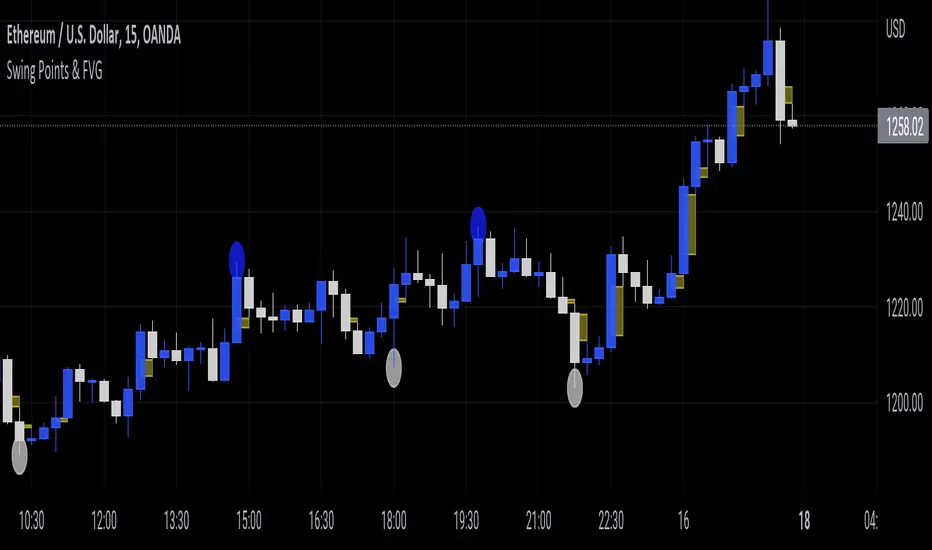
Swing Points & FVGClassic ITH/ITL
Intermediate Term High - High that has short term high on either of it's side.
Intermediate Term Low - Low that has short term low on either of it's side.
FVG
The indicator also marks Fair Value Gaps which is a very important concept in price action trading. FVGs are formed when there is ineffeciency,or imbalance, in the market.
Rebalanced ITH/ITL
Rebalanced ITH - A short term high that rebalanced the ineffeciency in price can be considered as an Intermediate Term High.
Rebalanced ITL - A short term low that rebalanced the ineffeciency in price can be considered as an Intermediate Term Low.
Use the ITH and ITL points marked by the indicator to determine the structure of the market.
Indicator repaints only when it tries to identify the latest ITH/ITL.
Ichimoku ImbalanceYou may have heard the word balance or imbalance
This indicator is designed based on Ichimoku periods to display imbalances in each period
When you see a black mark, it means that one of the Ichimoku periods is saturated or unbalanced
If the current candle was equal to the lowest price on 9/26/52 of the last period and the highest price was equal to the last candle from left on 9/26/52 of the last period
If the current candle was equal to the highest price on 9/26/52 of the last period and the lowest price was equal to the last candle from right on 9/26/52 of the last period
This indicator is a useful and powerful tool for Ichimoku traders to understand overbought and oversold points in different time periods.
Note: This is an auxiliary tool and does not issue buy and sell signals

Order Flow Imbalance Finder By TurkThis indicator is created to find the imbalances when a market exchange receives too many of one kind of order—buy, sell, limit—and not enough of the order's counterpoint and price shoots up or down and it left with unfilled orders. If you know how to trade the imbalances, this indicator can help you by find imbalances automatically.
Imb finderThe indicator finds imbalance's zone
Support:
- Two dynamic color
- Hides fulfiled blocks
- Extends last active imabalance's zone

Fractal Break Imbalance / Fair Value Gap (FVG) / Liquidity VoidFractal Break Imbalance / Fair Value Gap (FVG) / Liquidity Void
Order imbalances in either direction, either excess buy or sell orders, reduce liquidity. The market will seek to fill gaps sooner or later. The script marks an imbalance / FVG after a fractal break. It also marks any other imbalance.
Default Colours:
Green - Imbalance after fractal break to the upside
Red - Imbalance after fractal break to the downside
Yellow - Other imbalances
How To Use:
Gaps can be used to determine possible entries and targets. Those familiar with liquidity raids, supply and demand, and ICT concepts may realise it's potential.
Indicator in use:

Candle Colored by Volume Z-score [Morty]This indicator colors the candles according to the z-score of the trading volume. You can easily see the imbalance on the chart. You can use it at any timeframe.
In statistics, the standard score (Z-score) is the number of standard deviations by which the value of a raw score (i.e., an observed value or data point) is above or below the mean value of what is being observed or measured. Raw scores above the mean have positive standard scores, while those below the mean have negative standard scores.
This script uses trading volume as source of z-score by default.
Due to the lack of volume data for some index tickers, you can also choose candle body size as source of z-score.
features:
- custom source of z-score
- volume
- candle body size
- any of above two
- all of above two
- custom threshold of z-score
- custom color chemes
- custom chart type
- alerts
default color schemes:
- green -> excheme bullish imbalance
- blue -> large bullish imbalance
- red -> excheme bearish imbalance
- purple -> large bearish imbalance
- yellow -> low volume bars, indicates "balance", after which volatility usually increases and tends to continue the previous trend
Examples:
* Personally, I use dark theme and changed the candle colors to black/white for down/up.
Volume as Z-score source
Any as Z-score source, more imbalances are showed

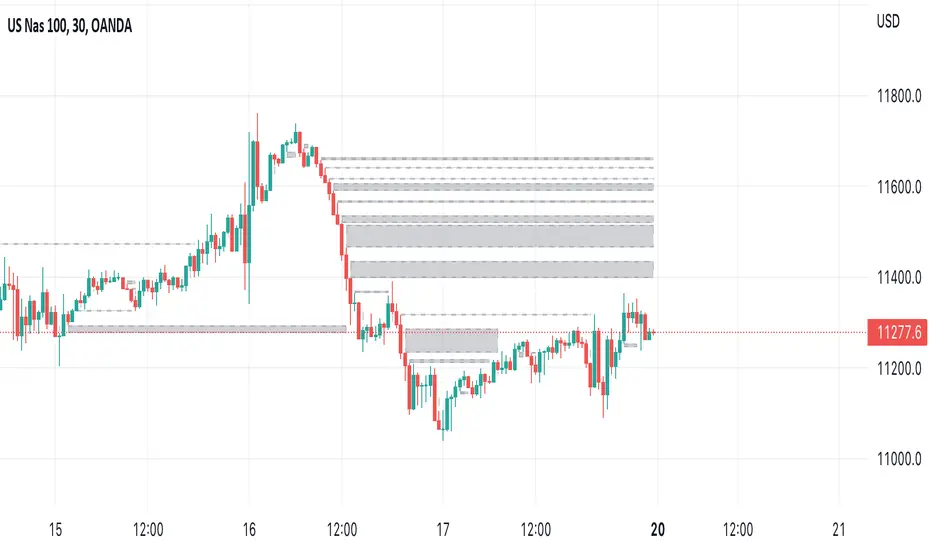
Fair Value Gap█ OVERVIEW
This indicator displays the Fair Value Gap of the current timeframe and an additional higher timeframe. For each FVG the gaps act as targets creating bullish and bearish gaps that are often filled.
█ FEATURES
MTF Options
MidPoint FIll
Delete Old On Fill
Label FVG Timeframe
MTF Options
Enabling the MTF Options will allow the user to use the "MTF Timeframe" setting to choose what HTF Fair Value Gap to display
MidPoint FIll
A line plot at the Half way point will be included in the Fair Value Gap, this will be used to delete the gap when reached instead of a full fill.
Delete Old On Fill
Deletes historical Fair Value Gaps when filled.
Label FVG Timeframe
Labels Every Fair Value gap with there relevant timeframe to make it easier to determine which gap is being filled.
█ HOW TO USE IT
The indicator is quite straight forward in its application, providing users with targets that are often filled as they are seen as market imbalance.
Just applying it to your chart will provide the existing Fair Value Gaps. MTF Confluence is helpful in seeing what is happening on the macro perspective.
█ SUGGESTION
My suggestion for clarity is to use a different color to some degree between the MTF and Current TF as Opposed to text, keeps the chart clear.
█ LIMITATIONS OF PINE (Please read)
I see many users going on different indicators with MTF in mind and trying to use it for LTF data e.g. 1hour chart, and selecting 5min in chart settings.
This is not recommended by the team themselves and should be noted for use always use HTF: www.tradingview.com
To understand how to use fair value gaps I recommend learning about the subject some more, searching online will provide you resources. The internet is your friend when learning. All the best.

ICT Fair Value Gap [LM]Hello traders,
I would like to present you ICT Fair Value Gap script. The idea is the same as in my other script to look form imbalances. I have improved the previous script from teaching of ICT and created this script to train the eye to see those gaps. Shrinking option also shows if the gap has been already filled and also in case gap is filled you can get alert in case you will set it up .
The script has two settings:
general settings - definition of volatility condition for middle candle
box settings - setting for boxes, box colors, shrinking
I hope you enjoy it,
Lukas

Imbalance Identifier With Target BoxTarget Area to help me with my target area for visual reference
Imbalance Identifier - Helps me to see where the trade may come back to
EMA on 1 Minute Time frame for helping to identify Direction to take trades in
I primarily use this as a tool to help me identify very short term direction for scalping small target area (Adjustable)
Preset for the main 28 Forex Pairs, US30,US100,US500 Dax40 and Gold on the 1 Minute timeframe

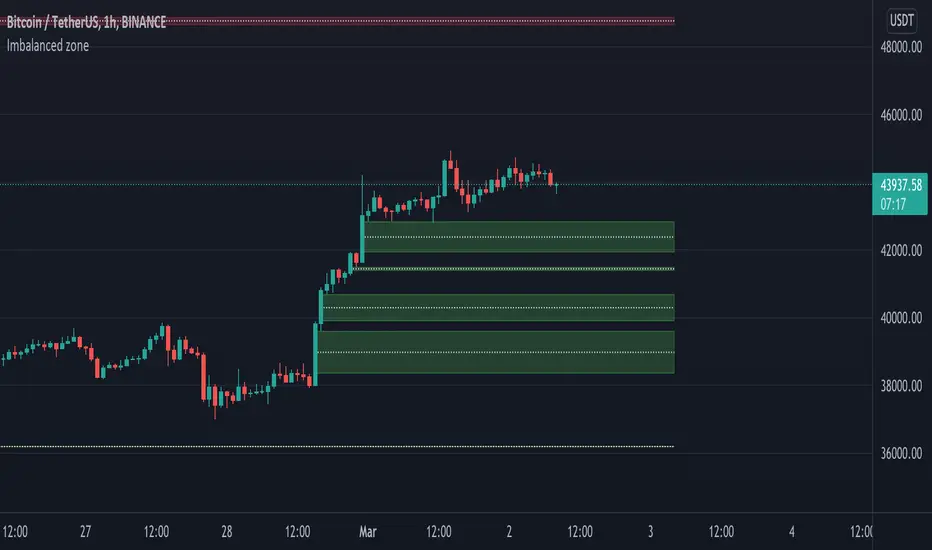
Imbalanced zoneImbalance, this is a zone / gap created when the price move with force in a given direction. It identify a zone where the price could
potentially go back. This gives perfect targets for your trades.
Imbalance is created from the high and low of 3 candles. When the wicks the of 1st and 3rd candle does not fully overlap the middle one.
You can define the penetration ratio which will delete a tested zone from the chart. Usually find that 20% (0.2) is pretty accurate.
Imbalance, ADR Daily Target & ADR > 3X1 x ADR Movement Calculated on the Asian Session - Times can be altered to suit your parameters
Daily Target is set High from low of Asian Range and Low from High of Asian Range
0-3X ADR Calculated and Displayed from a point you select for the following days targets - can be set Bearish or Bullish and ADR parameters can be altered
Imbalance Finder - Can be switched on or off to show imbalance on current time frame - default is off

Imbalance FinderImbalance Finder
I struggled to always see it visually this marks whether there is or isn't imbalance
Very quick way of finding imbalance between bars
