ROGUE ICT PROROGUE ICT PRO | ICT-Inspired Confluence System
The ROGUE ICT PRO is a precision tool built for traders who follow the principles of Inner Circle Trader (ICT) methodology. This script is designed to highlight potential high-probability trade setups based on multiple confluences including Market Structure Shifts (MSS), Fair Value Gaps (FVGs), killzone timing, rejection confirmations, and optional HTF bias filters.
This tool is intended for educational and research purposes only and is best used by traders who already understand ICT-style concepts.
🔍 Key Features:
- Market Structure Shift (MSS): Detects bullish or bearish structure breaks and plots them on the chart.
- Fair Value Gaps (FVGs): Highlights potential imbalance zones after a structure shift.
- Signal Logic: Buy or sell signals only trigger when price returns to a valid FVG and confirms with a rejection wick or engulfing (optional).
- Session Killzones: Filter entries to only occur during specific sessions: Asian, London, or New York.
High Timeframe Bias (Optional):
- HTF EMA trend direction
- HTF swing structure break
- HTF candle bias
RSI Confirmation (Optional): A 3-period RSI must be in overbought (for sell) or oversold (for buy) territory.
ATR-Based Risk Management:
SL and TP lines are drawn dynamically using ATR with configurable multipliers and risk-reward ratio.
Cooldown Logic: Prevents signal spam by enforcing a minimum bar gap between trades.
Previous Day High/Low Anchoring (Optional): Visual levels drawn from the previous day’s extremes.
⚙️ Customization:
Every feature can be toggled or configured via the settings menu:
Choose which killzones to enable.
Select your HTF bias filter or disable bias altogether.
Adjust ATR, Risk:Reward, and RSI levels to suit your strategy.
Fine-tune structure sensitivity, gap size, and rejection rules.
🛡️ Disclaimer:
This indicator is provided for educational and informational purposes only. It is not intended as financial advice or a trading signal service. Past performance is not indicative of future results. Always conduct your own research and consult with a licensed financial advisor before making any trading decisions.
Icteducation
ICT EverythingVersion 1.0
Global Settings
• Timezone Selection
• Hide Indicator Above Specified Time
Thematic Override
• Override Colors For Dark Theme ( Colors Set for White Theme by Default )
• Override Session Highlighting Color
Session Options
• Show Historical Sessions
• Enable/Disable Session Highlighting
• Session Specific Visibility
• Session's Crucial Time Vertical Lines w/ Options
NY Midnight Line Options
• Show Historical NY Midnight Vertical Lines
• Midnight Verticle Line Options
• Show Historical NY Midnight Price Lines
• Midnight Price Line Options
Opening Price Line Options
• New York 8:30 AM Price Line Settings
• Equities Open 9:30 AM Price Line Settings
• Option to Display Historical Price Lines
HTF Levels
• Weekly Open
• Monthly Open
label Settings
• Show/Hide Label Text
• Show/Hide Label
Day of Week
• Show Day of Week at the bottom of chart w/ Time Co-ordinates Selection
••• Message Me For Link to Frequently Updated Version of This Indicator •••
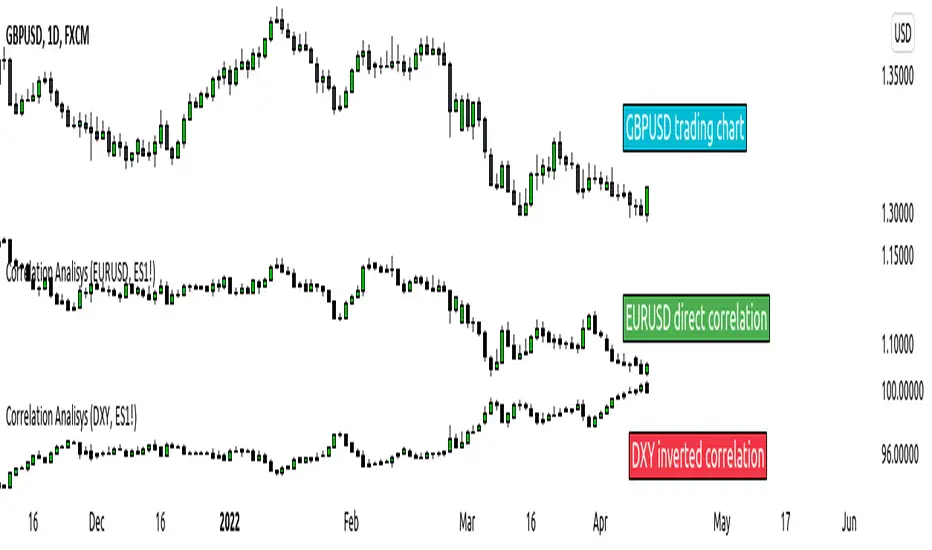
ICT index correlated market indicatorThis is not a real indicator, but is what ICT use as indicator for trading futures indexes.
it can only display SP500, Dow Jon Industrial Average and Nasdaq, if someone want other market can copy the code and change some parameters (is more easy than it can appear)
A good idea is using this other market on backtest to confirm the divergence idea of Linda Raske, than use it to spot quickly in real market.
Another idea published by ICT is the "hidden entry pattern", the entry signal appear in ES or YM but I trade NQ for volatility, so I use the trigger of SP500 or Dow to enter in Nasdaq.
Rember always don't trust anybody, do your own backtest and research!